Forecasting Foreign Tourist Visits to Bali Using Bayesian Vector Autoregression with Normal-Inverse-Wishart Prior
on
136
Forecasting foreign tourist visits to Bali using Bayesian Vector Autoregression with Normal-inverse-Wishart Prior
I Wayan Sumarjaya1 and Ni Ketut Tari Tastrawati2
-
1Department of Mathematics
Faculty of Mathematics and Natural Sciences, Udayana University
Bali, Indonesia
sumarjaya@unud.ac.id 2Department of Mathematics
Faculty of Mathematics and Natural Sciences, Udayana University
Bali, Indonesia
ABSTRACT
As a major tourist destination, Bali has become an icon for tourism in Indonesia. In general, the number of foreign tourist visits shows an increasing trend. However, there is considerable fluctuation in the number of visits which is affected by season. In another word, there is a stochastic trend in the number of tourist visits. Policy makers need a method to predict this tourist visits. A commonly used method to predict tourist visits is time series analysis. Time series analysis has been used in various fields such as finance, business, engineering, meteorology, geophysics, and tourism, to name but a few. Research on forecasting tourist visits usually uses univariate data. This research aims to forecast the number of foreign tourist visits from four major countries such as Asia Pacific, ASEAN, America, and Europe simultaneously using Bayesian vector autoregression with normal-inverse-Wishart prior. First data is plotted to see its characteristics. Then the data is modeled using Bayesian vector autoregression. In this stage normal-inverse-Wishart prior is used. Next, Markov chain Monte Carlo is conducted to make a prediction from the posterior distribution. The forecast suggests that the number of tourist visits in general increased, albeit some fluctuation in some months.
Keywords: autoregression, Bayesian vector autoregression, time series analysis, tourist visits forecasting
As a major tourist destination, Bali has become an icon or role model for tourism in Indonesia. In general, the number of tourist visits shows an increasing trend. However, these visits vary from months to months or fluctuated due to seasonal effect. This means that there is a stochastic trend on the tourist visits data. Policymaker, for instance, the Bali tourism board, needs to predict these tourist visits so that a proper marketing strategy can be made. One way to forecast this visits is by using time series analysis.
Research on forecasting tourist visits to Bali using time series analysis has been carried out by [1], [2], and [3]. However, these authors mainly use univariate time series model. Univariate time series has few shortcomings. First, it cannot measure interdependence structure between the time series. Second, long-term relationship cannot be measured by using single series alone. These shortcomings can be overcome by using multivariate time series model.
This research aims to forecast the number of tourist visits of four major countries using Bayesian vector autoregression. Bayesian vector autoregression (BVAR) is different from classical vector autoregression in that the former uses prior information. This research uses foreign tourist visits data from four major countries: Asia Pacific, ASEAN, America (including Canada and Latin America), and Europe. The classification of these countries is based on grouping as mentioned in Bali Tourism Board.
This article is organized as follows. Section one contains motivation and background for forecasting foreign tourist visits to Bali. Section two discusses the brief concept of multivariate time series using Bayesian vector autoregression and prior selection. Forecasting and its analysis are discussed in section three. Section four concludes the article.
This section discusses basic concept of vector autoregression, Bayesian vector autoregression, and normalinverse Wishart prior. The following discussion is adapted from [4]. Let yt for t = 1,...,T be M ×1 vector of observation on M time series variables, εt be M × 1 vector of errors, β0 be M ×1 vector of intercepts, and Bj be M × M. matrix of coefficients. Vector autoregression of order p is defined as
p
yt = βo + ∑ Bjyt - j + εt (1)
j=1
where vector εt is assumed to be independent and identically distributed N (0, Σ).
Equation (1) can be modified further. Define Y as T × M matrix which stack T observation of response variables, xt = (1, yt ∣,., y∖-p) , and define
x1
x2
xT
(2)
Next, define B = (β0,B1,.,Bp)' and β = vec(B). Then (1)
can be written in form of normal distribution variate matrix as
Y = XB + E
or
yt = ( Im ® X) β + ε
where ε ~ N(0, Σ ® It ).
The likelihood function that corresponds to (4) is
L (β, ∑I y, X)
= (2π)-tm /2 ∑8 Im 2
× exp{-1(y - (Im ® X)β)'(Σ-1 ® Im )(y - (Im ® X)β) I 2
and the log-likelihood has the form [5]
ln L χ - ^ln ∣Σ ® IM ∣
-{-1 (y - (Im ® X)β)'(∑-1 ® Im )(y - (Im ® X)β)
I 2
(3)
(4)
(5)
(6)
Define X :=IM ® X and β = (X'(Σ-1 ® IM )X)-1X'(Σ-1 ® IM ) y so that the loglikelihood (6) can be written as [5]
ln L = - - ln ΣH 2(β - β)X'(Σ-1 ® Im )X(β - β) ∣
2tr[( y -X β)(y -X β)'(Σ"1 ® I m)]
X ln( N(β∖β, Σ,X, y)IW(Σ | β, X, y).
Now the normal-inverse-Wishart prior has the form
p(β, Σ ∖ X, y) χ p(y ∖ X, β, Σ)p(β, Σ).
Incorporating prior in (8) yields the following conditional posterior distribution:
p (Σ∖β, X, Y) = IW (Ξσ+ (Y - Xβ)'( Y - Xβ), T + γ).
Markov chain Monte Carlo algorithm such as Gibbs
sampling can be used to make inference based on (9). Detail derivation of (9) can be seen in [5] and [6].
This research uses foreign tourist visits from four major countries: Asia Pacific, ASEAN, America (including Canada and Latin America), and Europe during the period from January 2010 to June 2016. The plot of the visits for the four countries can be seen in Figure 1.
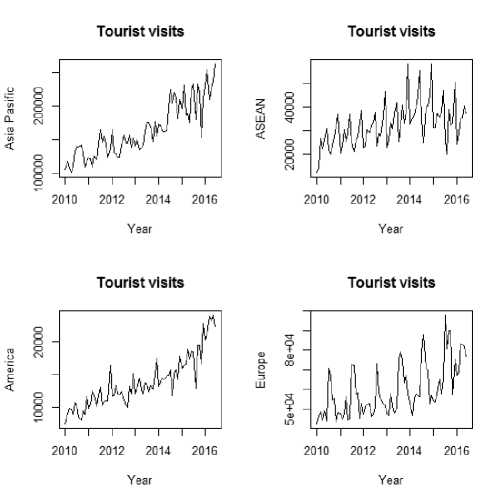
Fig. 1. Foreign tourist visits to Bali during January 2010—June 2016.
Figure 1 shows an increasing stochastic trend and pronounces seasonal effect on the four foreign tourist visits. To model and to forecast the four-time series simultaneously Bayesian vector autoregression with normal-inverse-Wishart prior is applied. The lag selection, in this case, 12, follows from an empirical research study carried out by [7].
The forecasts for foreign tourist visits can be seen in Table 1. The plot of the forecasts and the credible interval can be seen in Figure 2.
TABLE I
Forecasts of foreign tourist visits for the next 12 months
|
Month |
Asia Pacific |
America |
ASEAN |
Europe |
|
Jul. 2016 |
254,906 |
23,369 |
31,105 |
92,101 |
|
Aug. 2016 |
230,891 |
21,279 |
26,208 |
89,716 |
|
Sep. 2016 |
276,676 |
22,577 |
42,292 |
93,010 |
|
Oct. 2016 |
227,706 |
22,011 |
37,748 |
90,136 |
|
Nov. 2016 |
184,553 |
21,820 |
36,001 |
72,947 |
|
Des. 2016 |
250,688 |
27,660 |
57,285 |
90,310 |
|
Jan. 2017 |
252,709 |
23,998 |
30,620 |
87,931 |
|
Feb. 2017 |
252,574 |
23,509 |
33,713 |
77,574 |
|
Mar. 2017 |
228,883 |
27,894 |
47,204 |
87,810 |
|
Apr. 2017 |
264,296 |
27,415 |
42,981 |
100,601 |
|
May 2017 |
272,261 |
26,697 |
48,591 |
98,512 |
|
Jun. 2017 |
276,951 |
24,984 |
47,542 |
86,176 |
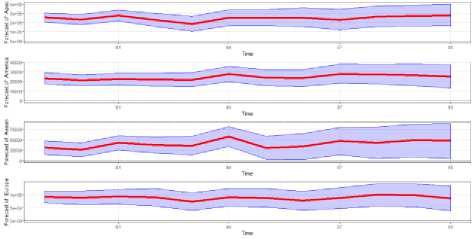
Fig. 1. Plot of forecasts for period June 2016 to July 2017.
Forecasting foreign tourist visits to Bali using Bayesian vector autoregression shows an increasing stochastic trend albeit considerable fluctuation due to seasonal effect.
Acknowledgment
The authors would like to thank Udayana University for the financial support under the research scheme Hibah Unggulan Program Studi contract number 2731/UN14.1.28/LT/2016 dated 27 June 2016.
References
-
[1] I. B. K. P. Arimbawa K., K. Jayanegara, and I. P. E. N. Kencana, “Komparasi metode Anfis dan fuzzy time series kasus peramalan jumlah kunjungan wisatawan Australia ke Bali,” E-Jurnal Matematika, vol. 2, no. 2, 2013, pp. 18—26.
-
[2] I. M. C. Satria, I. K. G. Sukarsa, and K. Jayanegara, “Peramalan jumlah wisatawan Australia yang berkunjung ke Bali menggunakan multivariate fuzzy time series,” E-Jurnal Matematika, vol. 4, no. 3, 2015, pp. 90—97.
-
[3] R. Rukini, P. S. Arini, and E. Nawangsih, “Peramalan jumlah kunjungan wisatawan mancanegara (wisman) ke Bali tahun 2019: metode ARIMA,” Jurnal Ekonomi Kuantitatif Terapan, vol. 8, no. 2, 2015, pp. 136—141.
-
[4] G. Koop and D. Korobilis, “Bayesian multivariate time series methods for empirical macroeconomics,” Foundations and Trends in Econometrics, vol. 3, no. 4, 2009, pp. 267—358.
-
[5] K. O’Hara (2016, November 1). Bayesian macroeconometrics in R [Online]. Available: http://bayes.squarespace.com/storage/bmr/BMR.pdf.
S. Karlsson, “Forecasting with Bayesian vector autoregression” in Handbook of Economic Forecasting, vol. 2B, E. Graham and T. Allan, Ed.
New York: Elsevier, 20
Figure 2 shows a plot of forecasts for the next 12 months. As can be seen from the figure there is an increasing (stochastic) trend for all the visits albeit some fluctuation in a certain month (see also Table 1).
Discussion and feedback