Causality between Frequency of Visit with Tourists Satisfaction: a Multi-group Analysis
on
128
Causality between Frequency of Visit with Tourists’ Satisfaction: A Multi-group Analysis
Eka N. Kencana1§ and Trisna Darmayanti2
-
1 Sociometrics Research Group – Department of Mathematics Faculty of Mathematics and Natural Sciences, Udayana University Jimbaran Campus, Badung 80361, Indonesia
E-mail: i.putu.enk@unud.ac.id
-
2 Department of Food Science and Technology
Faculty of Agricultural Technology, Udayana University Jimbaran Campus, Badung 80361, Indonesia
Email: trisnadarmayanti@unud.ac.id
ABSTRACT
This work is aimed to study the causal relationship between frequencies of visit to Bali with tourists’ satisfaction regarding the quality of destination. An instrument with five Likert-scale options was designed to measure visitors’ perception. The respondents in this study are 150 tourists who visited Kuta and Nusa Dua areas in September— October 2016, two famous tourist destinations in Bali; consists of 75 foreign and domestic tourists, respectively. The respondents were asked for their satisfaction and quality of destination had been visited. By applying structural equation modeling with multi-group analysis (MGA-SEM), the result shows the quality of destination significantly affects their satisfaction. In addition, satisfaction level for repeater guests is smaller compared to tourists’ who visited the destination for the first time.
Keywords: Bali, Kuta, multi-group, MGA-SEM, Nusa Dua, repeater guest, satisfaction level
The Ministry of Tourism, Republic of Indonesia reported that tourism has a strategic position in supporting national economic growth. In 2015, Indonesian tourism-related industries (directly and/or indirectly) had proven capable of creating 12 million jobs [1]. As an industry that is classified as a labor-intensive, tourism development is the right choice to reduce poverty, to create employment, and to accelerate national economic growth [2] [3] [4].
As a province in Indonesia that is not endowed with significant natural resources, Bali is well-known around the world as an exotic tourist destination with the uniqueness of its tradition and customs and rituals. As a tourist destination that relies on culture, Bali has always been a significant contributor to the total foreign tourists visiting Indonesia. At the end of 2015, according to Bali Regional Statistics Office, the number of foreign tourists visiting Bali reached 4,001,835 people or 38.45 percent of the total number of foreign tourist arrival to Indonesia which as much as 10,406,759 people.
One criterion to be considered in tourism development is the quality of tourists’ attraction at the destination. Refers to Indonesian Law No. 50 Year 2011, the attraction for tourists can be grouped into three categories, i.e. (a) natural attraction, (b) cultural attraction, and (c) man-made attraction. All of these attractions will affect the quality of the destination as well visitors’ satisfaction. Especially for Bali tourism, the local government chooses to focus on cultural-based tourism without neglecting the others two attractions.
As a part of industries system, tourism and its related sectors can be examined from two sides, i.e., supply side, and demand side. On the demand side, tourists who are satisfied with their tour experiences will tend to revisit the destination; on the supply side, host and tourism-related industries will strive to improve quality of destination(s) as well products and/or services that are consumed by the visitors [5]. This work is directed to answer the following questions:
-
1. What kind of attraction is more attractable and dominate the tourists’ satisfaction level who visit Nusa Dua and Kuta areas as two of central destinations in Bali?
-
2. Is there a difference in the level of satisfaction between first-time guests with the repeater guests who visit Nusa Dua and Kuta areas?
-
3. Is tourists’ satisfaction level affect their intention to revisit the destination?
We argue the answers to the above questions will help the local government as well tourism stakeholders in Bali in designing effective strategies to strengthen and improve the quality of cultural-based tourism of Bali. The remainder of this paper is organized as follows. Research method presents data collecting technique was applied, mathematical model, and the hypotheses were developed. Results of work, statistical tests, and discussion were described in result and discussion part. Finally, we present the conclusion as well as recommendation and limitation of our work in the last part.
Data Collection
Prior to data collection, a questionnaire with its items was designed by using five Likert-scale options was built. This questionnaire was tested for its items validities and reliability
through distributed it for domestic and foreign tourists – 25 people respectively – who visited both destinations in the third week of August 2016. After the questionnaire has been proven valid and reliable, the data started to be collected by distributing it to domestic and foreign tourists who visited destinations at Kuta and Nusa Dua areas in September—October 2016. Accidentally, domestic and foreign tourists, 75 people respectively, were selected as respondents and asked for their perception regarding the quality of attraction that is offered at the destination, the level of their satisfaction, and their intention to revisit the destination.
Research Model and Hypotheses
A quantitative approach was applied in this work to study the causal relationship between (a) quality of the destination, (b) level of satisfaction, and (c) intention of tourists to revisit the destinations. Noting all of these constructs cannot be measured directly, structural equation modeling (SEM) was used to model the relationship among them under studied as well to answer the research questions. Of two types of SEM technique available, covariance-based SEM (CB-SEM) and variance-based SEM (VB-SEM or PLS-SEM). PLS-SEM was used with following considerations:
-
1. PLS-SEM does not require the fulfillment of normal assumption that is needed by CB-SEM software such as AMOS and/or LISREL [6] [7];
-
2. PLS-SEM can be used without losing its power of the test even though the sample size is relatively small [7] [8].
The conceptual model involving three latent variables or constructs under studied is shown in Fig. 1, and the research hypotheses are as follows:
H1 : natural attraction significantly affects level of
tourists’ satisfaction;
H2 : cultural attraction significantly affects level
of tourists’ satisfaction;
H3 : Man-made or artificial attraction
significantly affects level of tourists’ satisfaction;
H4 : Tourists’ facilities significantly affects level
of tourists’ satisfaction;
H5 : Destination’s accessibility significantly
affects level of tourists’ satisfaction;
H6 : Tourists’ satisfaction significantly affects
their intention to revisit the destination; and
H7 : Frequency of visiting affects level of tourists’
satisfaction.
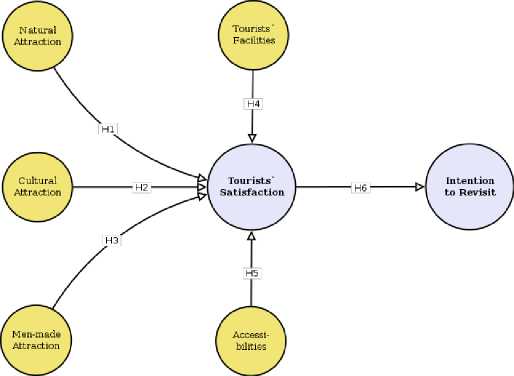
Fig. 1. Conceptual Research Model. Six hypotheses were depicted (H1, …, H6) while H7 is hidden.
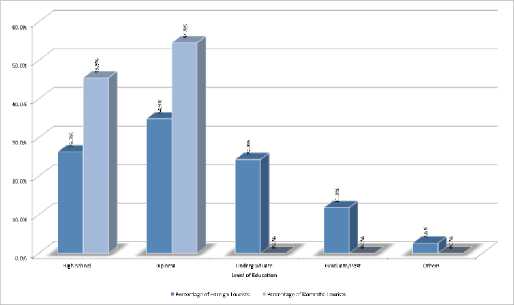
Fig. 3. Distribution of Educational Level.
Quality of Questionnaire
As aforementioned, prior to data collection is conducted, the questionnaire was tested regarding its reliability and items’ validities. Any item in one group is argued valid to use if its correlation with the total item in its group is greater than 0.30 [9] and the group as the representation of construct or latent variable is said reliable if its Cronbach’s coefficient (α) is greater than 0.60 [10].
Noting that respondents in this work are domestic and foreign tourists, two questionnaires were formulated. Both are similar in all aspects except one in Bahasa Indonesia and the other in English. Statistical Package for Social Sciences (SPSS) was used to assess the reliability of constructs and items’ validities. The result is listed in Table I-A to I-F.
Profiles of Respondents
Briefly, respondents for both groups are dominant aged between 26 and less than 45 years, that accounts 52.9 percent and 53.2 percent for foreign and domestic tourists, respectively. The complete distribution of respondents’ age is shown in Fig. 2.
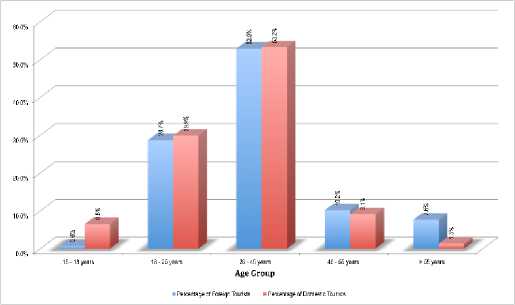
Fig. 2. Distribution of Age.
In addition, most of the respondents have been completed their diploma. For domestics tourists, the respondent with diploma's degrees dominate is account for 54.5 percent, whereas respondent from foreign tourists is account for 34.9 percent. Furthermore, we did not find domestic respondents who completed their undergraduate degrees or more whereas 37.8 percent of foreign respondents were completed these levels. Complete distribution for the education level of respondents is shown in Fig. 3.
TABLE I-A.
Result of Reliability and Validity Test for Natural Attraction
|
Item Cod e |
Description |
Correlation | |
|
Dome stic |
Fore ign | ||
|
NA T1 |
The beauty of beach panorama |
0.657 |
0.65 8 |
|
NA |
Temperature is convenient for |
0.613 |
0.56 |
|
T2 |
sightseeing |
5 | |
|
NA |
The forest & mangroves are |
0.644 |
0.64 |
|
T3 |
still natural |
2 | |
|
NA |
The flora and fauna are |
0.454 |
0.55 |
|
T4 |
beautiful to look at |
4 | |
|
Cronbach’s coefficient (α) |
0.749 |
0.79 3 | |
TABLE I-B.
Result of Reliability and Validity Test for Cultural Attraction
|
Item Cod e |
Description |
Correlation | |
|
Dome stic |
Fore ign | ||
|
CA |
The traditional building is |
0.590 |
0.65 |
|
T1 |
fascinating |
6 | |
|
CA |
The Balinese way of life is |
0.725 |
0.51 1 |
|
T2 |
unique | ||
|
CA |
The Balinese are friendly and |
0.696 |
0.65 |
|
T3 |
courteous |
3 | |
|
CA T4 |
The Balinese music & dance is fascinating |
0.676 |
0.54 3 |
|
CA |
Local stories and urban legend |
0.668 |
0.37 |
|
T5 |
is fascinating |
7 | |
|
CA T6 |
Variety of cultural events |
0.669 |
0.58 3 |
|
Cronbach’s coefficient (α) |
0.859 |
0.79 6 | |
TABLE I-C.
Result of Reliability and Validity Test for Men-Made Attraction
|
Item Cod e |
Description |
Correlation | |
|
Dome stic |
Fore ign | ||
|
MA T1 |
The artificial monument is beautifully viewed |
0.543 |
0.28 1 |
|
MA T2 |
Interesting museum collection |
0.476 |
0.36 9 |
|
MA T3 |
The street statues are artistic |
0.578 |
0.31 3 |
|
Cronbach’s coefficient (α) |
0.712 |
0.60 3 | |
TABLE I-D.
Result of Reliability and Validity Test for Tourists’ Facilities
|
Item Cod e |
Description |
Correlation | |
|
Dome stic |
Fore ign | ||
|
FA C1 |
Quality and variety of accommodation services |
0.693 |
0.77 3 |
|
FA C2 |
Quality and variety of travel agency |
0.659 |
0.65 1 |
|
FA C3 |
Quality and variety of culinary tourism |
0.645 |
0.76 4 |
|
FA C4 |
Quality and variety of sport tourism |
0.806 |
0.59 2 |
|
FA C5 |
Availability of camp services |
0.492 |
0.65 6 |
|
FA C6 |
Availability of children’s attraction |
0.715 |
0.52 4 |
|
FA C7 |
Availability of adult’s attraction |
0.679 |
0.68 3 |
|
FA C8 |
Quality and variety of spa services |
0.729 |
0.57 9 |
|
FA C9 |
Quality and variety of gift shop |
0.664 |
0.77 2 |
|
Cronbach’s coefficient (α) |
0.902 |
0.89 5 | |
TABLE I-E.
Result of Reliability and Validity Test for Accessibilities
Description Correlation
|
Item Cod e |
Dome stic |
Fore ign | |
|
AC |
Availability of tourism |
0.696 |
0.56 |
|
C1 |
information center |
2 | |
|
AC |
Availability of |
0.510 |
0.71 |
|
C2 |
communication center |
9 | |
|
AC |
0.66 | ||
|
C3 |
Quality of road |
0.733 |
6 |
|
AC C4 |
Quality of traffic |
0.606 |
0.58 7 |
|
AC |
Availability of pedestrian |
0.645 |
0.67 |
|
C5 |
facilities |
5 | |
|
AC C6 |
Ease of parking location |
0.737 |
0.74 1 |
|
AC |
Availability of transportation |
0.558 |
0.70 |
|
C7 |
mode |
4 | |
|
Cronbach’s coefficient (α) |
0.865 |
0.86 0 | |
TABLE I-F.
Result of Reliability and Validity Test for Intention to Revisit
|
Item Cod e |
Description |
Correlation | |
|
Dome stic |
Fore ign | ||
|
ITR |
Choose Bali as favourite |
0.815 |
0.68 |
|
1 |
destination |
0 | |
|
ITR |
Choose Badung as favorite |
0.843 |
0.68 |
|
2 |
destination |
8 | |
|
ITR 3 |
Will recommend Bali |
0.844 |
0.66 5 |
|
ITR 4 |
Will recommend Badung |
0.847 |
0.65 0 |
|
Cronbach’s coefficient (α) |
0.929 |
0.83 5 | |
Examinations of correlation values and Cronbach’s coefficients for domestic tourists’ data showed all the correlation values are greater than the threshold value as much as 0.30 as suggested by Churchill [9] and six alpha coefficients are greater than 0.60 as suggested by Hair et al. [8]. Observing these figures, we conclude our questionnaire to collect data from domestic tourists is valid and reliable to use.
Similar results from reliability and validity test for foreign tourists’ data is also obtained. Except for item MAT1 (The artificial monument is beautifully viewed), the others have correlation values over the threshold as suggested. Noting if this item is eliminated will decrease the alpha coefficient from 0.603 (Table I-C) to 0.572, is smaller than suggested, then we decided to keep it as the reflective item for man-made attraction construct. Observing the correlation values and the alpha coefficients for foreign’s questionnaire, we believed it is also feasible just as well for domestic’s questionnaire.
Outer Model Assessment
A structural equation model (SEM) consists of two submodels, i.e., outer or measurement model, and inner or
structural model [7] [8]. The outer model will represent the relationship between construct with its associative indicators, and inner model will show the causal relationship between exogenous construct(s) with the endogenous construct(s) through the direct, indirect, as well total effects. Refers to Hair et al. [8], prior to making inferences regarding SEM one has to check both sub-models; is started by examining the outer model and validating the hypotheses in the inner model.
In the outer model, the relationship between construct and its indicators will happen in a reflective or formative way. For reflective indicators, all items are the reflection of construct; for formative indicators, the construct is built or is affected by all of the associative items. Mathematically, if xi is a reflective item for construct ξj, then the relationship among them can be expressed as in (1); but if xi is a formative item for construct ξj, then the relationship can be expressed as in (2), as follows:
xi = γ0j + γ1j ξj + δi; i = 1, …, p; j =1, …, q (1) ξj = β0i + β1i xi + εj; i = 1, …, p; j =1, …, q (2) p and q in (1) and (2) represent the number of indicators for ξj and the number of constructs in the model. At the analysis stage, xi and ξj are expressed in standardized forms so that the terms γ and β can be eliminated.
According to Peng and Lai [11], the feasibility of a causal relationship between the latent variable with reflective items is done by examining the composite reliability (CR) which is represented by the average variance extracted (AVE) and convergent validity (CV) values, whereas causal relationship for construct with formative items is done by examining the significance of its path coefficients. Refers to Hair et al. [8], to establish an internal consistency the CR value must be ≥ 0.708; and to reach convergence for one construct, the AVE must be ≥ 0.50 [11]. Using SmartPLS 3.2.4 [12], the results for measurement sub-model are summarized in Table II and Table III:
TABLE II.
Result of Outer Model for Construct with Reflective Indicators
|
Construct or Latent Variable |
Numbe r of Items |
AV E |
CR |
Note |
|
Natural Attraction |
4 |
0.62 1 |
0.86 7 |
Feasi ble |
|
Cultural Attraction |
6 |
0.57 0 |
0.79 9 |
Feasi ble |
|
Men-made Attraction |
3 |
0.56 5 |
0.88 5 |
Feasi ble |
|
Tourists’ Facilities |
9 |
0.59 1 |
0.92 8 |
Feasi ble |
|
Accessibilities |
7 |
0.56 5 |
0.90 0 |
Feasi ble |
|
Intention to Revisit |
4 |
0.75 2 |
0.92 4 |
Feasi ble |
TABLE III.
Result of Outer Model for Construct with Formative Indicators
|
Indicator |
Pat |
p- Val | ||
|
Construct |
Cod |
Description |
h | |
|
e |
Val ue |
ue | ||
|
Tourists’ Satisfacti on Level AVE = 0 .692 CR = 0 .918 |
SA T1 |
Visiting satisfaction |
0.2 96 |
0.0 00 |
|
SA T2 |
Experiences > expectation |
0.3 00 |
0.0 00 | |
|
SA T3 |
Quality of destination |
0.3 19 |
0.0 00 | |
|
SA T4 |
Cleanliness of destination |
0.1 21 |
0.0 46 | |
|
SA T5 |
Destination is more superior than others |
0.1 40 |
0.0 22 |
Information on Table II confirmed all constructs in the model with reflective indicators have sufficient internal consistency and convergence validity, which is indicated by its respective AVE’s and CR’s are greater than its suggested values. For tourists’ satisfaction as the only one construct with formative items, all of the items show significantly path coefficients as listed in Table III. Refers to these figures, we argued it is worth to analyze the inner model.
Inner Model Assessment
To assess the inner model that represents causal relationships between exogenous with endogenous constructs, we applied bootstrapping procedure that is set running at 200 iterations for 500 samples that are generated from original data. Because of covariance fit does not applicable for PLS-SEM due to free-distribution of variance assumption, then we focus on non-parametric evaluation criteria to verify the inner model by following considerations from Hair et al. [13] that suggest to check the coefficient determination (R2) of endogenous construct, the global criterion for goodness-of-fit model, and to determine coefficients and its significance by applying bootstrap procedure as aforementioned. Fig. 4 shows these values of inner model:
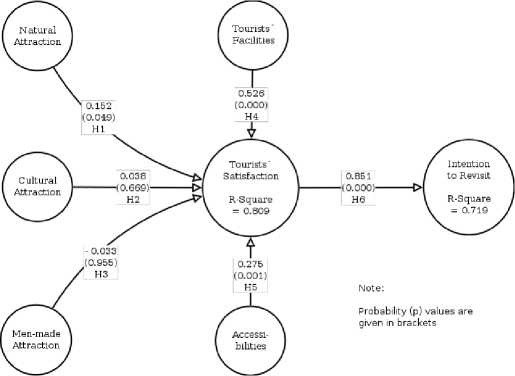
Fig. 4. Research Model with Estimates and the R2-values for Endogenous Constructs.
Refers to Chin [14], the R2-value of the endogenous construct can be used to evaluate construct’s quality. Threshold values as much as 0.19, 0.33, and 0.67 is needed to declare respective endogenous construct has weak, moderate, or substantial quality. Refers to these criteria, tourists’ satisfaction
and intention to revisit with R2 as much as 0.809 and 0.719 respectively, has a substantial quality.
To measure the goodness-of-fit (GoF) of our model, we applied formula suggested by [7] as follow:
GoF = √Corrtmunahty R2 = √ AVE R2 (3)
—
In (3), AVE and R2 represent geometric mean with weight are the number of items for respective constructs. We found AVE = 0.614 and R2 = 0.769. By using (3), the GoF for our model is 0.687. Noting this value, we argue our model is sufficient and qualified to model the causal relationship among constructs in the inner model.
Multi-group Analysis for Model
To study the effect of visit frequency on tourists’ satisfaction and their intention to revisit, multi-group analysis SEM (MGA-SEM) was applied. As a new routine available on SmartPLS 3.0 and later version, this technique is used by grouping the respondents according to their visit frequencies. The number of respondents who are classified as the first-time visitor is 66 people while the number of repeater guests is 84 people. The results of MGA-SEM analysis is showed in Fig. 5.
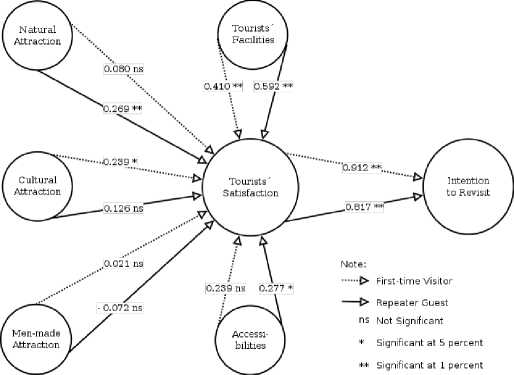
Fig. 5. The Inner Model Result for Multi-group Analysis SEM (First-time vs. Repeater Guests).
Discussion
Without discerning the frequency of visiting Kuta and Nusa Dua areas, cultural and man-made attraction did not significantly affect the level of foreign and domestic tourists’ satisfaction. Their satisfaction is affected significantly by tourists’ facilities, accessibility, and natural attraction at both destinations. As depicted in Fig. 4, the most influential factor in determining tourists’ satisfaction is facilities with path’s coefficient is 0.526. This finding is not necessarily mean that cultural attractions lose its power in attracting tourists come to Bali, but simply because Kuta and Nusa Dua areas are segmented as destinations that promote the natural scenery, especially the beach with all the activities that tourists can do. This research confirms that Kuta and Nusa Dua areas in Badung regency more perceived by visitors on the potential of natural tourism compared with cultural and man-made tourism.
Regardless of the insignificant effect of cultural attractions and artificial attractions on tourists’ satisfaction when the frequencies of visits are ignored, MGA-SEM gives another view about the determinants of tourists’ satisfaction. For the first-time visitors, the cultural attraction at both
destinations is the only significant attraction in determining tourists’ satisfaction with path value as much as 0.239 while the others did not show significant effects. This finding confirms Bali as a famous destination around the world is well-known regarding its culture as well as the unique tradition and Balinese daily life. In other words, most of the first-time visitors will come to Bali because they want to experience directly what they heard about Bali and its people. Only a small part of them visiting Bali due to the intention to enjoy the beauty of Bali’s panorama as well as the man-made attractions such as building or statues.
However for the repeater guests, visitors who have been to Bali at least once, cultural attractiveness diminishes, and its effect becomes insignificant. In this case, they tend to change their preference from cultural to natural attractions. Effect of natural attraction on tourists’ satisfaction become significant as shown in Fig. 5 with the path value as much as 0.269.
Another interesting finding from our work is men-made attraction shows an insignificant effect on visitors’ satisfaction for first-time and repeater guests. Perhaps most tourists who visited both destinations perceive this kind of attraction as the ‘by-products’ of natural and/or cultural attraction that can be experienced while they visit Kuta and Nusa Dua. In addition, as for be theorized in some tourism textbooks, facilities as well accessibilities are the important factor to be considered in destination development [15] [16]. Fig. 4 and Fig. 5 show effects of these factors are significant in forming satisfaction.
For the causal relationship between tourists’ satisfaction with their intention to revisit the destination, the effect of satisfaction is significant (see Fig. 4 and Fig. 5). However, if path coefficients for first-time and repeater guests were compared, tourists’ satisfaction has a bigger effect on intention to revisit for first-time visitors (path = 0.912) than for repeater guests (path = 0.817) although both values are significant.
Based on the findings of this work, some conclusion and suggestions to tourism' stakeholders at Province of Bali as well Badung regency can be listed as follow:
-
1. Without discerning the frequency of visiting destination, tourists’ satisfaction is significantly affected by tourists’ facilities, destination accessibilities, and natural attractions at the destinations;
-
2. For first-time visitors, their satisfaction is influenced by tourists’ facilities, accessibilities, and cultural attractions but for repeater visitors, their satisfaction is affected by tourists’ facilities, accessibilities, and as well natural attractions;
-
3. A decline in the influence of the cultural attractions on the level of tourists’ satisfaction who are categorized as repeater guests; and
-
4. Visitors’ intention to revisit tend to decrease for repeater guests.
Refers to the conclusion, we suggest the stakeholders as well as policymakers in tourism development:
-
1. To improve quality and variety of cultural attractions. It is very important to keep cultural attractions (dances and the like) are not monotonous. Involving the local
host in developing new of cultural attractions and enhancing the quality is highly recommended;
-
2. Noting Kuta and Nusa Dua areas are perceived as naturally-based destinations, efforts to increase safety as well comfort for tourists doing activities are important.
ACKNOWLEDGEMENT
We would like to acknowledge and thank the Center of Research and Community Services and Faculty of Mathematics and Natural Sciences of Udayana University for the financial support under contract No. 2736/UN14.1.28/LT/2016, dated 27 June 2016.
REFERENCES
-
[1] KEMENPAR, Laporan Akuntabilitias Kinerja Kementerian Pariwisata 2015. Jakarta: KEMENPAR Republik Indonesia, 2016.
-
[2] Anucha Leksakundilok, "Ecotourism and Community-based Ecotourism in the Mekong Region," University of Sidney, Sidney, Working Paper # 10 ISBN: 1 86487 222 5, 2004.
-
[3] Weibing Zhao and J. R. Brent Ritchie, "Tourism and Poverty Alleviation: An Integrative Research Framework," Current Issues in Tourism, vol. 10, pp. 119-143, 2007.
-
[4] Eka N. Kencana and I Wayan Mertha, "People Participation as Social Capital Form for Realizing Sustainable Ecotourism," International Journal of Social, Management, Economics and Business Engineering, vol. 8, no. 10, pp. 3014-3020, October 2014.
-
[5] Alastair M. Morrison, Marketing And Managing Tourism Destinations. London, UK: Routledge, 2013.
-
[6] J. J. Hox and T. M. Bechger, "An Introduction to Structural Equation Modeling," Family Science Review, vol. 11, pp. 354-373, 1998.
-
[7] Michel Tenenhaus, Vincenzo Esposito Vinzi, Yves-Marie Chatelin, and Carlo Lauro, "PLS path modeling," Computational Statistics & Data Analysis, vol. 48, pp. 159-205, 2005.
-
[8] Joseph F. Hair, Jr., G. Tomas M. Hult, Christian M. Ringle, and Marko Sarstedt, A Primer on Partial Least Square Equation Modeling (PLS-SEM). California, USA: SAGE Publications, Inc., 2014.
-
[9] Gilbert A. Churchill, "A Paradigm for Developing Better Measures of Marketing Constructs," Journal of Marketing Research, vol. 16, no. 1, pp. 64-73, February 1979.
-
[10] Joseph F. Hair, Rolph E. Anderson, Ronald L. Tatham, and William C. Black, Multivariate Data Analysis with Readings, 4th ed. New Jersey: Prentice-Hall, Inc., 1995.
-
[11] David X. Peng and Fujun Lai, "Using partial least squares in operations management research: A practical guideline and summary of past research," Journal of Operation Management, vol. 30, pp. 467480, 2012.
-
[12] Chistian. M., Wende, S., and Becker, J.M. Ringle. (2015) SmartPLS
3.
-
[13] Joe F. Hair, Marko Sarstedt, Christian M. Ringle, and Jeannette A. Mena, "An assessment of the use of partial least squares structural equation modeling in marketing research," Journal of Academic Marketing Science, vol. 40, pp. 414-433, 2012.
-
[14] Wynne W. Chin, "The Partial Least Squares Approach to Structural Equation Modeling," in Modern Methods for Business Research, G. A. Marcoulides, Ed. New Jersey, USA: Lawrence Erlbaum Associates, 1998, pp. 295-358.
-
[15] A. J. Bukart and S. Medlik, Tourism: Past, Present and Future. London, UK: William Heinenmann, Ltd., 1974.
-
[16] Chris Cooper, John Fletcher, Alan Fyall, David Gilbert, and Stephen Wanhill, Tourism Principles and Practice. London, UK: Financial Times Management, 20
Discussion and feedback