Internet of Things Based Control and Monitoring LCD Projector for Smart Class Room Concept
on
JURNAL ILMIAH MERPATI VOL. 10, NO. 1 APRIL 2022 p-ISSN: 2252-3006
e-ISSN: 2685-2411
Internet of Things Based Control and Monitoring LCD Projector for Smart Class Room Concept
Kadek Suar Wibawaa1, Putu Wirabuanaa2, A.A.K. Agung Cahyawan Wiranathaa3 aInformation Technology Department , Udayana University, Indonesia
e-mail: 1suar_wibawa@unud.ac.id, 2 wbhuana@unud.ac.id, 3agung.cahyawan@unud.ac.id
Abstrak
Konsep Smart Class Room membutuhkan teknologi modern untuk mengontrol dan memonitor perangkat Liquid Cristal Display Projector. Desain teknologi ini dapat dicapai dengan menerapkan Internet of Things. LCD Projector dapat dikontrol secara remote melalui aplikasi mobile berbasiskan android. Research and Development merupakan metode yang tepat digunakan untuk menghasilkan prototipe. Hasil implementasi sistem memperlihatkan remote control melalui jaringan internet menggunakan firebase database realtime dapat dicapai dalam durasi waktu 3 detik. Jarak antara LCD Projector dengan perangkat sistem tertanam dapat berkomunikasi dengan baik hingga 2 meter menggunakan sensor Infra merah. Perubahan temperatur dan ambient intensitas cahaya dapat terdeteksi baik dalam waktu pengukuran 500mS. Deteksi arus memperlihatkan 4 mode status LCD : ON, OFF-Fan On, Stand by dan Off.
Kata kunci: Smart Class Room, Internet of Things, Monitoring LCD, Deteksi Arus, Aplikasi Mobile
Abstract
The Smart Class Room concept requires modern technology to control and monitor Liquid Crystal Display Projector devices. This technology can be created by implementing the Internet of Things. The LCD Projector can be controlled remotely via an android-based mobile application. Research and Development is the right method to produce prototypes. The results of the implementation of the system show that remote control via the internet using a realtime firebase database can be achieved in 3 seconds. The distance between the LCD Projector and the embedded system device can communicate well up to 2 meters using the Infrared sensor. Changes in Temperature and Ambient Light intensity can be detected within 500mS measurement time. Current detection shows 4 LCD status modes: ON, OFF-Fan On, Stand by and Off.
Keywords : Smart Class Room, Internet of Things, Monitoring LCD, Current Detection, Mobile App
being equipped with a solid remote control causes permanent damage to the LCD Projector because the user uses the beam to operate the LCD Projector [8], so it is necessary to make a control mechanism and operational monitoring of the LCD Projector device. Internet of things technology can be used as a solution to design a control and monitoring system for LCD projector devices so that it can reduce the failure rate due to operational procedure errors.
The research method uses a Research and Development approach to produce a product. The object of research is the Control and Monitoring of LCD Projector Based on the Internet of Things for the Smart Class Concept. This study aims to determine the success rate of system product design using a simple internet of things architectural diagram approach as shown in Figure 1. If a problem is found in the system, whether it is due to user error, methods/procedures, communication systems, or measurement techniques, then the analysis step can be carried out in the brainstorming session.
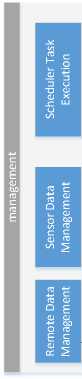
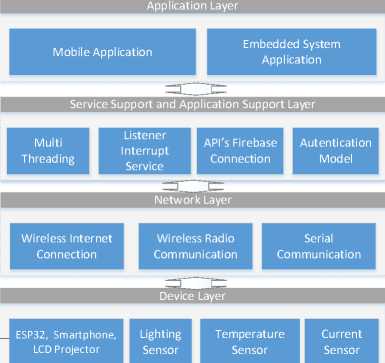
Figure 1. Simple Architecture System
Liquid Cristal Display Projector (LCD Projector) works based on the refraction of light by LCD panels. In order to monitor LCD devices, we need to know the components of the LCD Projector technical specifications [9]. The first component is light intensity. The light intensity determines the brightness level of the LCD. Generally the brightness level ranges from 3000 to 4000 Ansi lumens [10]. The second component is the working temperature of the LCD projector. Working temperature Range from 40 to 55°C. The third is work power. The working power of the LCD Projector consists of : High (±269 Watt), Standard (±218 Watt), Low (±186 Watt) and on standby mode (±0.5Watt) [11]. And the fourth component is the remote LCD projector device. By using this remote device, a reengineering process can be carried out to obtain a remote communication protocol format between the remote device and the LCD Projector. Based on it, the LCD Projector Monitoring Status in On, Off and in Standby mode can be known.
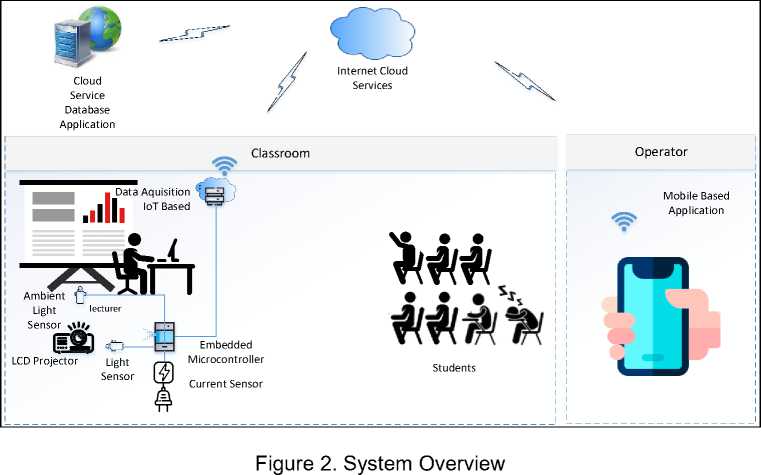
The LCD projector control and monitoring system was developed to create a smart classroom concept. Users can monitor and control the LCD Projector through an application on a smartphone as shown in Figure 2. LCD status updates are sent in real time when the smartphone system and application are connected via the internet. Transfer data from smartphone applications and embedded system applications using realtime firebase database services. This service allows two-way communication. The embedded system performs data acquisition from sensor readings and sends it to the firebase realtime database continuously so that users via smartphones can monitor the status of the LCD. Users can use the remote
feature to remotely control the LCD via the mobile application. Users can turn on, turn off, set the LCD remotely.
The embedded system digital signal receiver circuit (Figure 3) is used in the reengineering process. The analog remote control signal emitted by a product of a certain type and brand (based on an infrared signal) is captured for further translation into a string of binary numbers that have a specific meaning. The data obtained is then translated and retransmitted using a series of infrared signal senders (Figure 5).
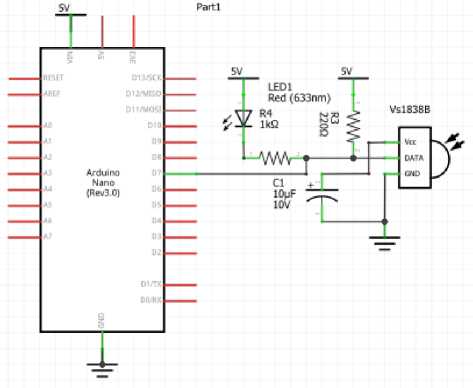
Figure 3. Schematic diagram remote receiver
Tests on the reengineering process that have been carried out have resulted in mapping the digital number form of the LCD Projector product with the PJ-xx Serial Number. The signal code in hexa decimal form obtained from the raw data of the signal receiving circuit is used as input data and transmitted back to control the LCD projector using a series of embedded LCD control systems.
The LCD control embedded system is a set of electronic circuits used to control and monitor the LCD. This circuit mainly consists of an ESP 8266 microcontroller as a signal processor that supports internet network communication via a wifi connection. The temperature sensor uses the DHT11 Series with a measuring sensitivity of 1 °C. The light intensity sensor uses the BH1750, 16 bit serial output module. The BH1750 supports I2C BUS interface with a filter that reduces noise at a frequency of 50/60HZ.
Table 1. BH170 Sensor calibration result
|
LUX METER |
BH170 SENSOR |
ERROR |
|
0 |
0.02 |
-0.02 |
|
2 |
2.5 |
-0.5 |
|
22 |
23.5 |
-1.5 |
|
68 |
68.9 |
-0.9 |
|
101 |
102.92 |
-1.92 |
|
119 |
119.52 |
-0.52 |
|
180 |
180.92 |
-0.92 |
|
296 |
296.97 |
-0.97 |
|
335 |
338.59 |
-3.59 |
|
360 |
361.83 |
-1.83 |
|
511 |
512.03 |
-1.03 |
|
702 |
702.06 |
-0.06 |
|
STANDAR DEVIATION |
0.980624415 | |
|
STANDAR ERROR |
0.283081885 | |
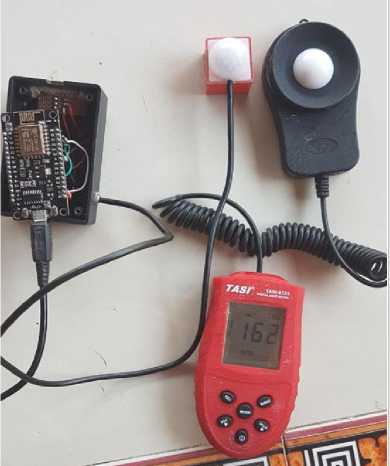
Figure 4. Calibration Process
Calibration is carried out to determine the error rate of sensor measurement readings by comparing the sensor measurement results with a light intensity measuring instrument. By comparing the measurement results as shown in Table 1, it can be seen that the standard deviation value is 0.98 and the standard error is 0.28.
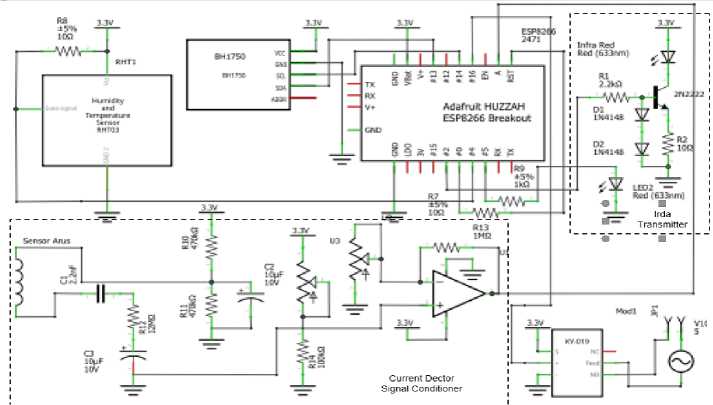
Figure 5. Schematic diagram embedded system lcd controller
Current Sensor is used to detect the active status of the LCD Projector. The current sensor uses the SCT013 module with a maximum current of 5A. This sensor uses a magnetic field induction model to detect the working current of a closed system circuit. According to the LCD power consumption specification data, the maximum load is at 218 watts for standard mode. Then it can be calculated the maximum current of 0.99 Ampere at a working voltage of 220 Volt.
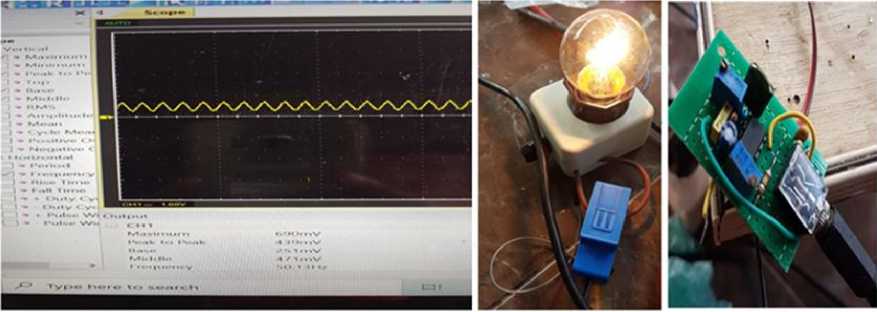
(a) Capturing data using oscilloscope
(b) load (c) Signal Conditioner
Figure 6. Calibration Current Sensor Proccess
The microcontroller as a signal processor has an Analog to Digital Converter (ADC) interface module with a resolution of 10 bits (1024) and an internal voltage reference of 1.1 Volts. So that a signal conditioning circuit is needed for the measurement offset at the Max measured current of 1A with the middle value at 0.5 Volts using a current sensor with a Max measurement range of 5A.
Offset Calibration Signal Conditioning Current Sensor With 90 Watt Load
Offset Calibration Signal Conditioning Current Sensor With 2S Watt Load
Time (mS)
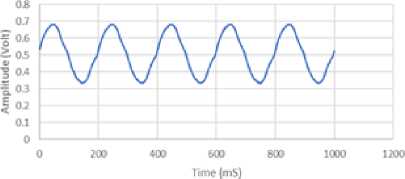
Figure 7. Current Detection ADC reading Chart
Calibration is carried out using incandescent lamps with a load of 25 Watt and 90 Watt (Figure 6 a, b and c). Calibration aims to ensure the system is able to detect loads with a measurement value range from 0 to 1 Ampere. From the measurement results obtained Peak to Peak for a 25 Watt load of 0.455 Volt (valley) and 0.561 (peak). A 90 Watt load produces a valley value of 0.331 Volt and a peak value of 0.68 Volt. From the results of these measurements, the design of the signal conditioning circuit in the embedded system circuit has reached the standard (Figure 7).
Software applications are developed in two different application services. The first application was developed for end users via a mobile application as shown in Figure 8a. The application runs on the Android operating system, developed using the Java programming language with the Android Studio IDE. The appearance of the application interface design follows the actual LCD remote device model. This makes the application easy to use due to the experience of users who are used to using remote devices that are already available. Firebase Database Realtime as one of the two-way data interconnect API's is used as a two-way data transmission service. This service allows real-time data updates (Figure 8b).
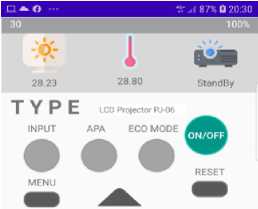
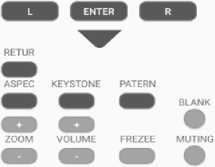
(a) User Interface MobiIeAppIication
smart-led
⅛ - DATA
Date: ''Mon, 15-Nov-2Θ21
- Lux: "28.23"
NewCommand: ',3θ"
OIdCommand: "30"
......StatusLCD: StandBy
— StatusRemote: " NON E'
— Temperature: "28.80"
Time: "18:53:05”
(b) Firebase Database Data Structure
Figure 8. Design Implementation Mobile Application and Fire Base Realtime Database Structure
Embedded system software applications are built using the C programming language, which runs on the Real-time Operating System (RTOS) Software development Kit kernel. The service model uses a time scheduler for sensor measurement task management as shown in Figure 9. Main Program is in a state of listener receive data from firebase update. The interrupt service routine timer flags the sensor to perform measurements and perform measurement data acquisition periodically. Sensor measurement results are sent to Firebase Dabase Realtime periodically within 1 minute (Example in Figure 10).
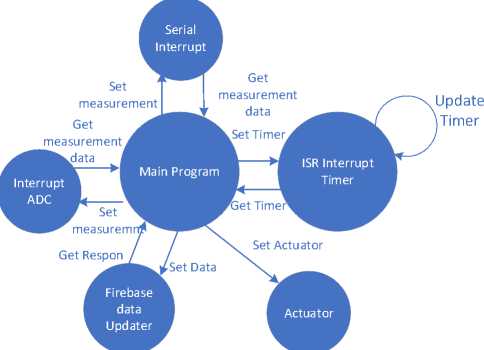
Figure 9. State Machine Diagram Embedded System Application
When the Listener receives a remote control command via the firebase updater receive data the app prioritizes the task and delays sensor measurement. The embedded system application provides a response in the form of data updates while updating sensor measurement data in the database.
O COMS
∣l
18:52:59.050 -> 1 2 3 4 5
18:53:03.801 ->
18:53:03.801 -> Connection established!
18:53:03.801 -> IP address: 192.168.43.102
18:53:04.030 -> 28.23,28.80
18:53:08.255 -> {"Lux":"28.23"f"StatusRemote":"NONE", "StatusLCD":"StandBy"r"Date":"Monr 15-Nov-2021",
"Temperature":"28. 80","Time":"18:53:05")
Figure 10. Dump serial line update database realtime
System integration (Figure 11) testing is conducted to determine the overall system performance. The remote control of the embedded system can work well with a test distance of 2 meters. The system is capable of transmitting updated measurement data from the mobile application to the embedded system application and vice versa within a test time period of 3 seconds so that some features that require execution time of less than 3 seconds cannot run properly.
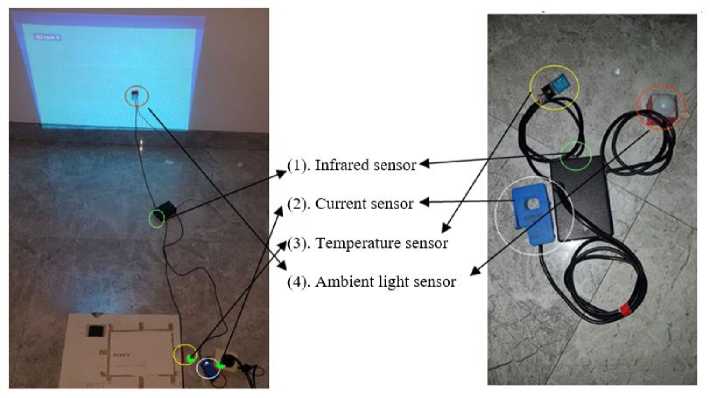
Figure 11. Integration System
The change in the ambient light intensity value when the LCD is first activated takes 83 seconds from an ambient value of 28 lux to stabilize at an intensity of 320 lux (Figure 12). Changes in the intensity value are strongly influenced by the measurement distance from the light source and the light intensity of the environment. The temperature increased from the measured environmental temperature of 28 degrees Celsius with a peak value of 51 degrees Celsius with a time of 4 minutes 7 seconds, and decreased to the optimal working temperature of the LCD Projector 45.2 degrees Celsius (Figure13a). Figure 13b shows that the LCD projector temperature has decreased. A very sharp decrease occurs when an active LCD projector fan cools the LCD which enters the OFF state. At the optimum temperature of 35 degrees Celsius the LCD FAN stops cooling the LCD and the current to the LCD can be cut off.
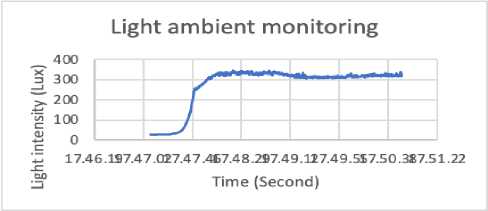
Figure 12. Measurement ambient light intensity
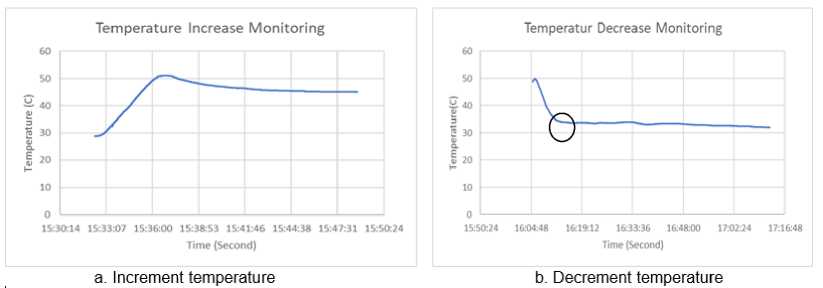
Figure 13. Movement LCD Projector Temperatur Measurement
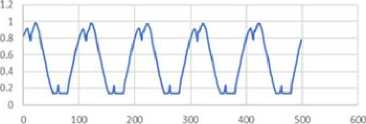
The results of the observation of current detection show a change in the value of the microcontroller ADC voltage reading. At the position of the system detects the peak to peak amplitude showing results from 0 volts to 1 volt. In the valley, there is a signal that is cut off as a result of the midpoint offset value being at a lower value. The peak value is at 1 Volt. When the LCD Projector is turned off, the LCD Projector current signal detection changes where the working current from the fan is controlled on-off by the system. From the results of the detection of temperature changes, it can be seen that the fan is active from off mode within 1 minute.
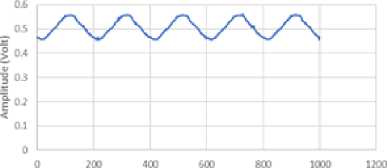
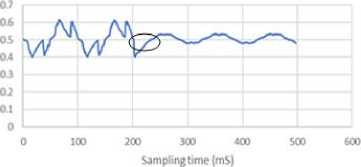
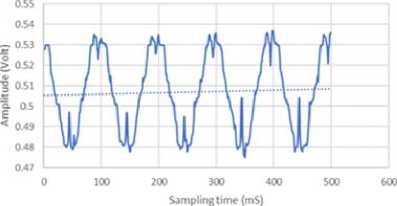
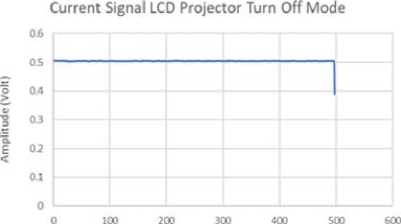
Figure 14.a shows the results of current detection when the LCD Projector is on. It appears that a signal with a frequency of 50 HZ is detected with a peak value of 1 Volt and a valley value of 0.1 volts. This is the offset of the maximum value of the current detected using the ADC reading. When the LCD Projector OFF status (Figure 14. b) it appears that there is a difference in wave amplitude. This is because the fan control on the LCD projector is still active to cool the bulb. This signal change is still well detected. After the LCD Projector Fan Off, the LCD Projector enters Stand-by status (Figure 14. c). In Stand-by condition, the LCD projector is detected to still consume current with peak wave amplitude at 0.53 Volt and 0.47 Volt at valley wave. In this condition the LCD Projector current can be safely disconnected from the voltage source using a relay (Figure 14. d).
Current Signal LCD ProjectorActive Mode
Current Signal LCD Projector Fan Active Mode
Sampling time (mS)
(a) LCD Turn On
(b) LCD Turn Off with active fan
Current Signal LCD Projector Standby Mode
(c) LCD Stand By
Figure 14. Current LCD Detection
Sampling time (mS)
,....(d) LCDTurnoff
In standby condition, the LCD still consumes power, so the source current needs to be disconnected. Current observations take about 1 hour 10 minutes to cool the LCD projector at room temperature.
The results of the system implementation have met the system design requirements. The LCD Projector Control System using embedded system devices can be carried out up to a distance of 2 meters. The remote controller and system can update data remotely within 3 seconds via the internet. The response time to changes in temperature and environmental light intensity looks very good in the test time duration of 500mS. Current detection to determine LCD
condition status can run optimally by showing 4 different values of current change detection results in LCD mode On, Off-Fan On, Standby and off mode.
References
-
[1] P.R. Temkar, M. Gupte, S. Kalgaonkar, Internet of things for smart classrooms.
International Research Journal of Engineering and Technology 3(7), 203–207 (2016)
-
[2] Maryam Bagheri ; Siavosh H. Movahed , in 2016 12th International Conference on
Signal-Image Technology & Internet-Based Systems, (2016). The Effect of the Internet of Things (IoT) on Education Business Model, pp. 435-441
-
[3] S. Song, X. Zhong, H. Li, J. Du, F. Nie, in 2014 International Conference on
Intelligent Environments, (2012). Smart classroom: From conceptualization to construction (2014), pp. 330–332
-
[4] Finch G. (2018). Classroom design then and now. Diakses pada 10 Februari 2020 <
https://www.viewsonic.com/library/education/classroom-design-trends-layout>
-
[5] R. Huang, Y. Hu, J. Yang, G. Xiao, The concept and characters of smart
classroom(in Chinese). Open Education Research 18(2), 22–27 (2012)
-
[6] B. Li, S.C. Kong, G. Chen, Development and validation of the smart classroom
inventory. Smart Learning Environments 2(1) (2015). Diakses pada 10 Februari 2020 <https://doi.org/10.1186/s40561-015-0012-0>
-
[7] J. MacLeod, H.H. Yang, S. Zhu, Y. Li, Understanding students’ preferences toward
the smart classroom learning environment: Development and validation of an instrument. Computers and Education 122(March), 80–91 (2018). ). Diakses pada
10 Februari 2020
<https://doi.org/10.1016/j.compedu.2018.03.015>
-
[8] Ratnasari, P.M. and Prasetya, A.Y.E., Simulasi Pengembangan Pengendali Lcd
Proyektor Berbasis Android Menggunakan Mikrokontroller Arduino di Universitas Kanjuruhan Malang.
brightness#:~:text=Projector%20brightness%20is%20measured%20in,of%202500% 20lumens%20is%20best. diakses tanggal 2 Agustus 2020.
tanggal 2 Agustus 2020.
dx140#ProductSpecificationsBlock-vpl-dx140 diakses tanggal 2 Agustus 2020.
The Impact Of Iklanku Shopee Feature Through Brand Awareness On Purchase Decisions Using SEMPLS, Naive Bayes and K-NN Method
Ni Putu Intan Waindika Dharmaa1, I Ketut
Gede Darma Putraa2, Ni Made Ika Marini Mandennia3, Yusliza Binti Mohd Yasinb4 aDepartment of Information Technology, Faculty of Engineering, Udayana University, Indonesia Jl.Raya Kampus Unud Bukit Jimbaran, Bali, Indonesia-803611
bDepartment of Business, Faculty of Economics, Finance and Business, Utara Malaysia University, Malaysia
Sintok, 06010 Bukit Kayu Hitam, Kedah, Malaysia
e-mail: 1iwaindika@gmail.com, 2ikgdarmaputra@unud.ac.id, 3made_ikamarini@unud.ac.id, 4yuslizayasin06@gmail.com
Abstrak
Tujuan dari penelitian ini adalah untuk menguji tiga variabel yaitu pengaruh Fitur Iklanku Shopee terhadap Keputusan Pembelian dan Brand Awareness. Penelitian ini dilatarbelakangi karena adanya fenomena yang terjadi pada kondisi perekonomian yang sedang melemah akibat covid-19, namun pembelian produk fashion justru meningkat. Data diperoleh dari penyebaran kuesioner adalah sebanyak 350 data. SmartPLS digunakan untuk menemukan outer model dan inner model. Hasil data tersebut diolah kembali untuk menentukan cluster dan klasifikasi dengan menggunakan K-Means, Naive Bayes dan K-NN pada aplikasi RapidMiner. Hasil dari pengujian menggunakan SmarPLS bahwa hipotesis yang dibangun berpengaruh positif. Hasil dari pengolahan data mining adalah algoritma Naive Bayes lebih akurat dalam klasifikasi menggunakan split data dan juga cross validation.
Kata Kunci: Brand Awareness, Fitur Iklanku Shopee, K-NN, Keputusan Pembelian, Naive Bayes.
Abstract
The purpose of this study was to examine the effect of my Shopee Advertising Feature on Purchase Decisions and Brand Awareness. This research is motivated by the phenomenon of inequality that occurs in economic conditions that are weakening due to COVID-19, but the purchase of fashion products has actually increased. Data obtained from the distribution of questionnaires is as much as 350 data. SmartPLS is used to find the outer model and inner model. The results of the data are reprocessed to determine clusters and classification using K-Means, Naive Bayes and K-NN in the RapidMiner. The results obtained from SmartPLS are that every hypothesis that is built is positive.The results obtained from data mining processing are that the Naive Bayes algorithm is more accurate in classification using split data and cross validation.
Keywords: Brand Awareness, Iklanku Shopee Feature, K-NN, Naive Bayes, Purchase
Decision.
The Impact Of Iklanku Shopee Feature Through Brand Awareness On Purchase Decisions 69
Using SEMPLS, Naive Bayes and K-NN Method (Ni Putu Intan Waindika Dharma)
Discussion and feedback