Design and Build Wireless Relay with Electricity Monitoring Based on Internet of Things
on
JURNAL ILMIAH MERPATI VOL. 10, NO. 1 APRIL 2022 p-ISSN: 2252-3006
e-ISSN: 2685-2411
Design and Build Wireless Relay with Electricity Monitoring Based on Internet of Things
Made Toby Sathya Pratikaa1, I Nyoman Piarsa, S.T., M.T.a2, A. A. Kt. Agung Cahyawan
Wiranatha, S.T., M.T.a3
aInformation Technology Study Program, Faculty of Engineering, Udayana University Jimbaran Hill, Bali
e-mail: 1tobysathya@gmail.com, 2manpits@unud.ac.id, 3agung.cahyawan@unud.ac.id
Abstrak
Energi listrik adalah sumber daya yang diperlukan untuk memberikan daya kepada perangkat elektronik. Saklar umum digunakan untuk memadamkan atau menyalakan perangkat elektronik, namun permasalahan yang terjadi yaitu pengguna lupa untuk memadamkan perangkat elektroniknya, begitupun sebaliknya. Permasalahan berikutnya pengguna tidak dapat melakukan pemantauan penggunaan energi listrik perangkat elektroniknya secara realtime. Permasalahan yang dirujuk pada pernyataan sebelumnya dapat diatasi dengan sistem IoT dengan prinsip kerja seperti saklar, tetapi didalam rancangan alat terdapat mikrokontroller, aktuator, sensor dan komponen lainnya. Pengguna dapat melakukan kontrol melalui saklar utama pada rancangan alat, tombol saklar dan timer pada aplikasi Android, selanjutnya pemantauan penggunaan daya, arus dan tegangan perangkat elektronik secara realtime dilakukan melalui aplikasi Android. Hasil pengujian menunjukkan bahwa aplikasi Android dan rancangan alat dapat melakukan kontrol dengan tingkat keberhasilan 100% di masing – masing jenis pengujian, kedepannya penyesuaian dari pemantauan arus perlu dilakukan agar hasil pemantauan daya lebih baik.
Kata kunci: Android, IoT, Kontrol, Listrik, Pemantauan
Abstract
Electrical energy is the power source needed to provide power to electronic devices. Switches are commonly used to control electronic devices, but the problem that occurs is that users forget to turn off their electronic devices, and vice versa. The next problem is that users can't monitor the electrical energy use of their electronic devices in realtime. The problems referred to in the previous statement can be overcome with an IoT system with a working principle like a switch, but inside the designed device has microcontrollers, actuators, sensors and other components. Users can control through main switch on the designed device, switch button and timer on Android application, realtime monitoring of the use of power, current and voltage of electronic devices is carried out through the Android application. The test results show that the Android application and tool design can control with a 100% success rate in each type of test, in the future adjustments of current monitoring need to be made so that the power monitoring results are better.
Keywords : Android, Control, Electricity, IoT, Monitor
Electrical energy is a resource needed to provide power to electronic devices, so electronic devices can’t work if they’re not get electrical energy. One of the ways used to turn off and turn on electronic devices is to use a switch. The problem that occurs when using a switch is forgetting to use it to turn off the electronic device, and vice versa so that electrical energy is not used efficiently and effectively. The next problem is that users cannot find out the use of electrical energy from their electronic devices in real time, where postpaid or prepaid electricity users can only see the numbers listed on the KWh Meter in their homes without being able to know the amount of power used by their electronic devices.
The problems referred to in the previous statement can be overcome by the existence of internet technology. IoT or internet of thing is a technology that is able to make a device
exchange data through the internet network, so the application of IoT is used to control and monitor electrical energy used by user electronic devices in real time. The working principle of the system built has similarities like a switch, but inside the designed device has microcontrollers, actuators, sensors and other components. Users able to control and monitor their electronic devices from anywhere through the Android application as long as the designed device and Android smartphone are connected to the internet.
Researchers found research that has been done before, such as designing a system that can control and also displays the usage of electrical power carried out by Trisiani Dewi Hendrawati, designed to be used by users in an effort to make savings [1]. The difference lies in the use of the ESP32 DevKit v1 microcontroller board, 2-channel relay module and a ZMPT101B voltage sensor. Dolly Handarly previously designed a system that can monitor internet-based electrical energy designed to obtain information related to electrical energy measurements, including real power (W), voltage (V) and current (A) in realtime that can be accessed from the Internet Network at any time [2]. The difference lies in the use of the ESP32 DevKit v1 microcontroller board, 2-channel relay module and ACS712 current sensor. The Cayenne platform is used by Afandi Amir in the manufacture of a server system from the use of technology so that the switch can be controlled automatically and the power readings on the load are recorded and stored on a computer [3]. The difference lies in the use of the ESP32 DevKit v1 microcontroller board, ZMPT101B voltage sensor, ACS712 current sensor, 2-channel relay module and an Android smartphone.
This research has several stages of research starting from literature review, design of tool and systems, implementation and testing, conclusions and suggestions. A series of tool and system design processes from this research can be seen in the following explanations.
System Overview is a discussion of the relationship of the designed device with supporting components outside the tool. The general description begins with the user's electronic devices connected directly to the designed device so that electronic device control and electrical power monitoring can be carried out, then the system is connected to the internet so that later controlling and monitoring data can be stored in Firebase Relatime Database and can also be displayed on the user's Android smartphone. Users can also control their electronic devices because the entire system gives and receives data to each other. System overview of this research can be seen at Figure 1.
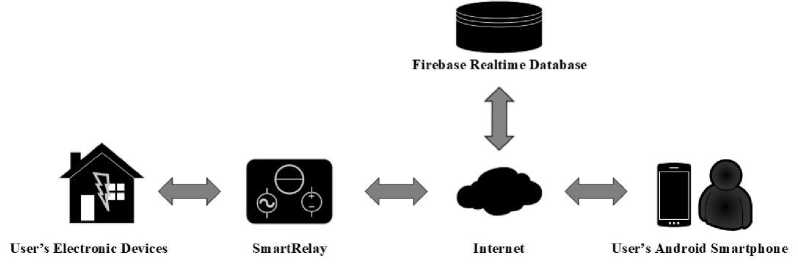
Figure 1. System Overview
Concatenation analysis is the determination of needs which is based from the results of the analysis of existing theories in the literature review used in research. All tools and materials listed in Table 1 are used to make only 1 designed device.
-
Table 1. Tools and Materials
No Tools and Materials Function
-
1 1 pc ESP32 DevKit v1 To control the system and for connecting the designed
device to the internet through the microcontroller in it.
|
2 |
1 pc AC 220V to DC 5V converter |
To provide power for components in the designed device. |
|
3 |
1 pc 2 channel relay module |
To disconnect / connect the electrical power of electronic devices A and B digitally. |
|
4 |
2 pcs ACS712 current sensor |
To read current (A) from electronic devices A and B. |
|
5 |
2 pcs ZMPT101B voltage sensor |
To read the voltage (V) from electronic devices A and B. |
|
6 |
10 pcs 2 pin terminal block |
To connect AC power supply, electronic devices A and B to the designed device. |
|
7 |
3 pcs 3 pin LED switch |
To disconnect / connect AC power, as well as an LED indicator for designed device, voltage A and B. |
|
8 |
2 pcs 3 pin hotel switch |
To disconnect / connect the electrical power of electronic devices A and B manually. |
|
9 |
1 pc 2A glass tube fuse 5x20mm |
To secure the designed device and electronic devices A and B from short circuits and overcurrents. |
|
10 |
1 pc glass tube fuse holder 5x20mm |
To place a 2A 5x20mm glass tube fuse. |
|
11 |
Pin header male |
To connect the components into the PCB board. |
|
12 |
Pin header female |
To connect the components into the PCB board. |
|
13 |
1 pc PCB board |
To be a container of all components. |
|
14 |
4 sets bolt housing |
For electronic component circuit holder. |
|
15 |
8 pcs bolts |
To mount the electronic component circuit with the designed device container and install the designed device container. |
|
16 |
Wire |
To connect the components. |
|
17 |
1 set Black Box X6 |
The designed device container. |
|
18 |
Tin |
To connect the components to PCB board. |
|
19 |
1 pc soldering iron |
To melt tin. |
Block diagram is the first step in tool design. The power from the AC power supply is connected first to a 2A glass tube fuse, then the electric power is divided into 3 lines to provide power to the designed device (SmartRelay), electronic devices A and B. The first line goes to the switch + 3 pin LED indicator which is used to disconnect, connect and the electric power indicator to the designed device, then the power from the AC power is converted first using an AC 220V to DC 5V converter in order to provide power to the designed device. The second line goes to the 3 pin hotel switch which functions as the main switch A (manual control) and continues to the 2 channel relay module (digital control), where these two components are used to disconnect / connect electrical power to electronic device A. Current sensor A ACS712 and voltage sensor A ZMPT101B are also connected on the second line so that the current (A) and voltage (V) data of electronic device A can be read and sent to the ESP32 DevKit v1. The switch + 3 pin LED indicator is used to disconnect, connect and AC voltage indicator is placed between the current sensor A and the voltage sensor A, then proceed to electronic device A. The third line goes to the 3 pin hotel switch which functions as the main switch B (manual control) and continues to the 2 channel relay module (digital control), where these two components are used to disconnect / connect electrical power to electronic device B. Current sensor B ACS712 and voltage sensor B ZMPT101B are also connected on the third line so that the current (A) and voltage (V) data of electronic device B can be read and sent to the ESP32 DevKit v1. The switch + 3 pin LED indicator is used to disconnect, connect and AC voltage indicator is placed between the current sensor B and the voltage sensor B, then proceed to electronic device B. ESP32 DevKit v1 used to process data sensor reading so it can be sent to Firebase Realtime Database via internet network. User can see the results of monitoring the current, voltage, power of electronic devices A and B through an Android smartphone. Users can also control their electronic devices manually using the main switch or digital control using an Android smartphone. Block diagram of this research can be seen at Figure 2.
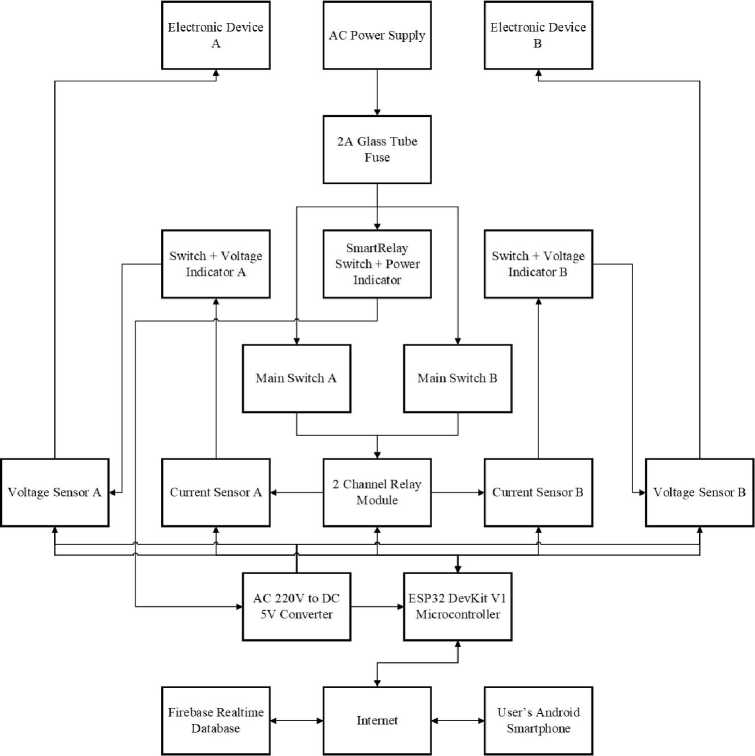
Figure 2. Block Diagram
The schematic is the result of a more detailed translation of the block diagram that connects the components. Figure 3 explains that the AC mains supply first enters the designed device through the terminal block. The incoming AC electricity is used to provide power to the designed device and electronic devices A and B. The electronic devices can be connected to the designed device by connecting them through the terminal blocks of electronic devices A and B.
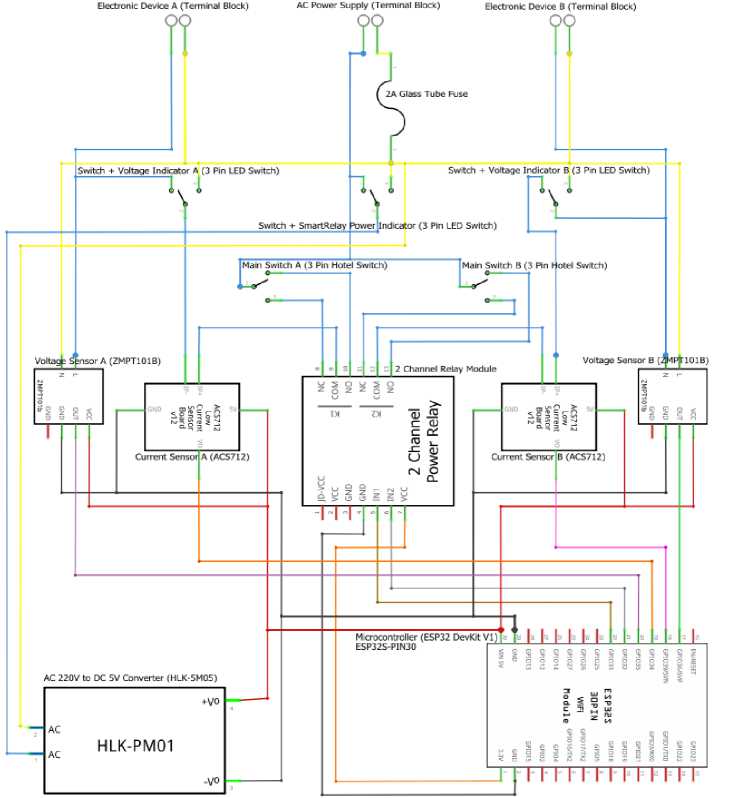
Figure 3. Schematic Design
Hardware design is the design stage of the container from the designed device so that later it can help protect all the components in it and add to the aesthetic value. The hardware design is in the form of a x6 project box and has 4 bolt holders to make it easier to install / remove the lid. The hardware design is made as concise as possible, but can accommodate all the components used. The researcher determines the size of this hardware design with a length of 18.5 cm, then a width of 11.5 cm and a height of 6 cm. The hardware design of this project can be seen at Figure 4.
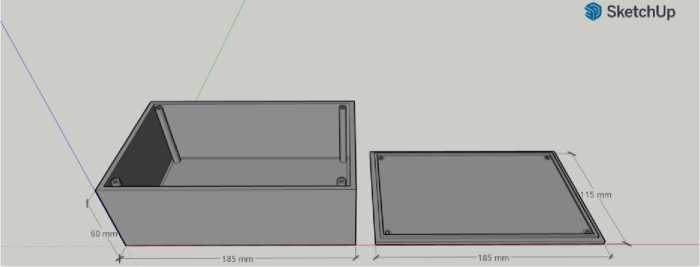
Figure 4. Hardware Design
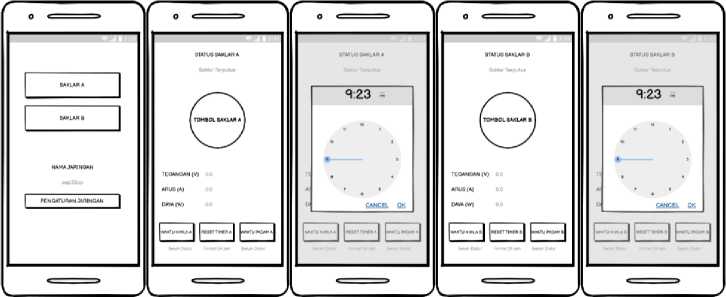
Mockup design is the creation of the initial design of the user interface in order to make it easier to read the information and control to the designed device. The user interface display is made simply by prioritizing the user's ergonomic value, which is basically divided into 5 displays that can be seen at Figure 5 (a) the main display, (b) the display of switch A, (c) the display of timer setting A, (d) the display of switch B, and (e) the display of timer setting B.
(a)
(b)
(c)
(d) (e)
Figure 5. Mockup Design
Literature study contains several supporting theories. The researcher cites some of the literature needed in this research. Excerpts of the literature contained are obtained from books and scientific journals.
Power is the amount of change in energy with time in quantity of voltage and current. Watts absorbed by load at any time is the product of the instantaneous voltage drop between the instantaneous current flowing in the load in amperes and the load in volts [4].
Active power is the power that used to do actual energy. The unit of active power is called Watt. For example heat energy, light, mechanical and others. The active power can calculate using the equation of P = V. I. cos φ [4]. Active power can calculate with the equation of P = V. I in 1 phase electricity because cos φ in 1 phase electricity is 1.
Reactive power is the amount of power required for the formation of a magnetic field. From the formation of a magnetic field, a magnetic field flux will be formed. The unit of reactive power is called Var. Reactive power can calculate with the equation of Q = V. I. sin φ [4].
Apparent power is electrical power through a transmission or distribution conductor. This power is the result of multiplying the rms voltage and rms current in a network or the power which is the result of the sum can calculate with the equation of S = V. I [4].
Internet of things (IoT) is a technology that uses the internet to control and communicate with various other devices. The purpose of IoT is to expand the benefits of continuously connected internet connectivity [5]. IoT has the main purpose of communicating with devices such as actuators, RFID and sensors through wireless communication such as NFC and Wi-Fi [6].
Android is one of the operating systems on Linux-based mobile devices consisting of an operating system, middleware, and applications. Android is an open source platform making it easier for developers to create an application. Google Inc. buy Android Inc. and is a newcomer to software development for smartphones. Android applications can be developed using the Android Studio IDE, where the programming language used is JAVA or Kotlin. Android is a mobile operating system that is increasingly popular and in demand by the general public [5].
Arduino IDE is software that is used to develop programs, compile them into binary code and upload them to the memory contained in the Arduino. Arduino IDE can program Arduino-compatible modules such as sensors, displays, drives, and so on [7]. Arduino IDE is usually used to program the memory in the microcontroller, one of which is Arduino. Arduino is an open source electronic kit specially designed to make it easier for everyone to develop electronic devices that can interact with various sensors and controllers [8].
ESP32 DevKit v1 is a wifi module and the tools are made by DOIT. The component of this system is an ESP32 microcontroller which supports bluetooth, ethernet and Wi-Fi in a single chip with low power [9].
The relay module is an electronic component such as a switch that is operated with an electric current. The relay module is used as an AC motor control with a DC control circuit with a different voltage source between the load voltage and the control circuit voltage. Relay modules are needed in electronic circuits as executors as well as interfaces between electronic control systems and loads with different power supply systems [10].
Current sensor is a module that detects an electric current (AC or DC) in a wire, and produces a signal proportional to it. ACS712 current sensor is a current sensor by utilizing the Hall effect made by a company called Allegro. This sensor is a current sensor that has a good level of precision for measuring AC or DC currents, for current readings in the industrial, automotive, commercial world and also in communication systems. The way this sensor works is that the current that is read flows through the copper cable contained in it which produces a magnetic field that is captured by the Hall Effect IC and converted into a proportional voltage [11].
The voltage sensor is a module that produces a voltage value (Volt) from a singlephase reading. Voltage sensor calibration is carried out to determine the value of a voltage, and one way is to use a voltage divider [2].
A breaker fuse is an overcurrent device with the fused part that can open the circuit (fuse link) which is heated and melted directly by the passage of overcurrent in the event of an overload condition or a short circuit. The purpose of the fuse is to eliminate permanent interference by disconnecting the disturbed part of the line or equipment from the system. The fuse is designed to fuse within the specified time for a given fault current rating [12].
The Firebase Realtime Database is a data store and syncs in realtime into every connected client app. The application receive automatically if there is the latest data update. The design of database is not used in addition to new data in each field. Every time there is a data change, the old data is updated with new data [13]. Firebase stores data in NoSQL and stores data in the form of paired keys. Firebase also allows developers to use the Firebase Cloud Messaging feature [14].
This section describes the implementation and testing of the system, as well as analyzing the test results obtained. Implementation is carried out on the hardware and software side, then proceeds to stages of control and monitor testing and analysis. The discussion in this section can be seen in the following explanations.
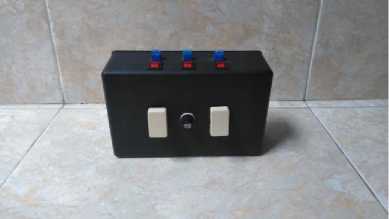
Hardware implementation is a detailed view of the designed device and installation to electronic devices, and this section also describes the flow. Explanation of hardware implementation can be seen at Figure 6.
(a)
(b)
(c) (d)
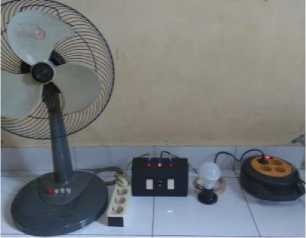
Figure 6. Hardware Implementation
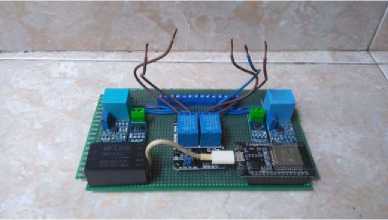
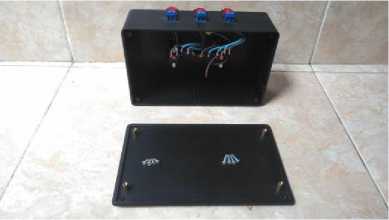
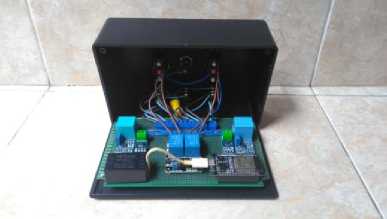
Hardware implementation includes (a) electronic component circuits which are assembled on the PCB board according to the schematic design, (b) designed device container with dimensions according to the hardware design, in this container there are also has 3 pcs 2 pin terminal blocks, 3 pcs LED switches, 2 pcs hotel switches, 1 pc 2A 5x20mm glass tube fuse with a 5x20mm glass tube fuse holder, 4 sets bolt housing, and some wires, (c) assembly of the designed device where the electronic component circuit is attached to bolt housing in the designed device container using 4 bolts, then the existing cables are connected according to the system schematic, followed by closing the container using 4 bolts, (d) the final result of the designed device, (e) implementation of the designed device where the designed device is connected to the AC power supply, electronic devices A (fan) and B (lamp) through the terminal block.
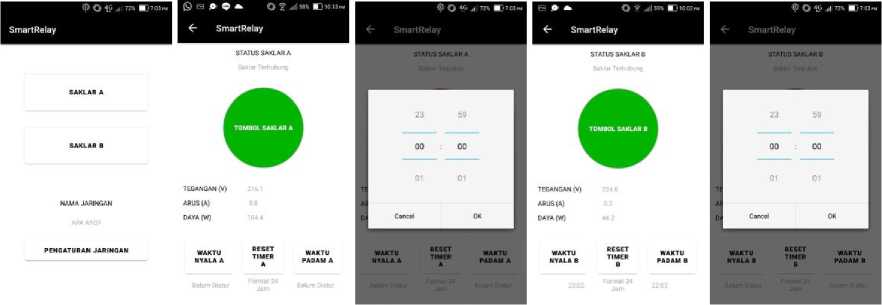
Software implementation is the display of the Android application that is used to control and monitor electronic devices A and B. Control and monitoring activities are carried out in realtime. Explanation of software implementation can be seen at Figure 7.
(a) (b) (c) (d) (e)
Figure 7. Software Implementation
Software implementation includes (a) the main display in this Android application has SAKLAR A button to enter the display of switch A, SAKLAR B button to enter the display of switch B, PENGATURAN JARINGAN button to display network information and configuration in the browser, and there is also the name of the network is connected to the designed device, (b) the display of switch A contains information on switch status, voltage, current, power, on time, and off time of electronic device A, in addition there is a TOMBOL SAKLAR A button which functions to turn on or turn off electronic device A, RESET TIMER A button to reset the on and off time of electronic device A, WAKTU NYALA A button and WAKTU PADAM A button to set the turn time on and time off of electronic device A automatically, (c) the display of timer setting A appears when selecting the WAKTU NYALA A or WAKTU PADAM A button, in this display there has hours and minutes that can be set in a 24-hour format, the Cancel button to cancel, and the OK button to save the electronic device A timer setting, (d) the display of switch B has a similar appearance to the display of switch A, the difference is used for controlling and monitoring electronic devices B, (e) the display of timer setting B has a similar appearance to the display of timer setting A, the difference is used to set the time on or off electronic devices B.
Controlling system result are obtained from testing by connecting the AC power supply, electronic devices A and B to the designed device, then the 2 channel relay module and 3 pin hotel switch function test were carried out. The component function test for controlling in this research can be seen at Table 2.
|
Table 2. Component Function Test for Controlling | |
|
No |
Function Description Result |
|
1 |
Relay A, main To turn off the electronic device A Succeed switch A (0, 0) |
|
2 |
Relay A, main To turn off the electronic device A Succeed switch A (1, 0) |
|
3 |
Relay A, main To turn on the electronic device A Succeed switch A (1, 1) |
|
4 |
Relay A, main To turn off the electronic device A Succeed switch A (0, 1) |
|
5 |
Relay B, main To turn off the electronic device B Succeed switch B (0, 0) |
|
6 |
Relay B, main To turn off the electronic device B Succeed switch B (1, 0) |
|
7 |
Relay B, main switch B (1, 1) |
To turn on the electronic device B |
Succeed |
|
8 |
Relay B, main switch B (0, 1) |
To turn off the electronic device B |
Succeed |
Monitoring system result are obtained from testing by connecting the AC power supply, electronic devices A and B to the designed device, then the ACS712 current sensor and the ZMPT101B voltage sensor function were tested via an Android smartphone. The component function test for monitoring in this research can be seen at Table 3.
Table 3. Component Function Test for Monitoring
|
No |
Function |
Description |
Result |
|
1 |
Current sensor A |
To check the current (A) of single phase AC power on electronic device A |
Succeed |
|
2 |
Voltage sensor A |
To check the voltage (V) of single phase AC power on electronic device A |
Succeed |
|
3 |
Current sensor B |
To check the current (A) of single phase AC power on electronic device B |
Succeed |
|
4 |
Voltage sensor B |
To check the voltage (V) of single phase AC power on electronic device B |
Succeed |
Analysis of controlling system result is applied to determine the success rate of the control method used. The analysis applied is controlling analysis using the main switch, controlling using the switch button, and controlling using the timer. The experiment was carried out 60 times in each test. Controlling analysis using the main switch in Table 4 is carried out with 4 stages of testing, the first is the test to turn off and turn on the fan, the second is the test to turn off and turn on the lamp, the third is the test to turn off and turn on the water pump, and the fourth is the test to turn off and turn on the drill. All tests got perfect results, from 60 trials none failed. The success rate of the four tests obtained results of 100% and 0% failure rate.
|
Table 4. Controlling Analysis Using The Main Switch | ||||
|
No |
Testing Type |
Number of Tests |
Succeed |
Failed |
|
1 |
Test of turning off and turning on the fan |
60 |
60 |
0 |
|
2 |
Testing of turning off and turning on the lamp |
60 |
60 |
0 |
|
3 |
Testing of turning off and turning on the water pump |
60 |
60 |
0 |
|
4 |
Testing of turning off and turning on the drill |
60 |
60 |
0 |
|
Percentage |
100% |
0% | ||
Controlling analysis using the switch button in Table 5 is carried out with 4 stages of testing, the first is the test to turn off and turn on the fan, the second is the test to turn off and turn on the lamp, the third is the test to turn off and turn on the water pump, and the fourth is the test to turn off and turn on the drill. All tests got perfect results, from 60 trials none failed. The success rate of the four tests obtained results of 100% and 0% failure rate.
Table 5. Controlling Analysis Using The Switch Button
|
No |
Testing Type |
Number of Tests |
Succeed |
Failed |
|
1 |
Test of turning off and turning on the fan |
60 |
60 |
0 |
|
2 |
Testing of turning off and turning on the lamp |
60 |
60 |
0 |
|
3 |
Testing of turning off and turning on the water pump |
60 |
60 |
0 |
|
4 Testing of turning off and turning on the drill |
60 |
60 |
0 |
|
Percentage |
100% |
0% |
Controlling analysis using the timer in Table 6 is carried out with 4 stages of testing, the first is the test to turn off and turn on the fan, the second is the test to turn off and turn on the lamp, the third is the test to turn off and turn on the water pump, and the fourth is the test to turn off and turn on the drill. All tests got perfect results, from 60 trials none failed. The success rate of the four tests obtained results of 100% and 0% failure rate.
Table 6. Controlling Analysis Using The Timer
|
No |
Testing Type |
Number of Tests |
Succeed |
Failed |
|
1 |
Test of turning off and turning on the fan |
60 |
60 |
0 |
|
2 |
Testing of turning off and turning on the lamp |
60 |
60 |
0 |
|
3 |
Testing of turning off and turning on the water pump |
60 |
60 |
0 |
|
4 |
Testing of turning off and turning on the drill |
60 |
60 |
0 |
|
Percentage |
100% |
0% | ||
Analysis of monitoring system result is applied to compare the results of the voltage, current, and power readings displayed on the Android application with a digital watt meter. The comparison of the readings was carried out on electronic devices A and B with 10 minutes of testing time. Monitoring analysis electronic device A (fan) in Table 7 is that the voltage readings (V) produced by the designed device with a digital watt meter are almost the same, but the current (A) and power (W) readings from the designed device are still not close to the digital watt meter.
|
Table 7. Monitoring Analysis Electronic Device A (Fan) | ||||||
|
Minuite |
Designed Device |
Digital Watt Meter | ||||
|
Voltage |
Current |
Power |
Voltage |
Current |
Power | |
|
1 |
223.3 |
0.8 |
169.9 |
224.3 |
0.203 |
42.2 |
|
2 |
222.9 |
1.5 |
335.8 |
224.2 |
0.199 |
41.6 |
|
3 |
222.5 |
1.0 |
212.1 |
223.6 |
0.197 |
41.7 |
|
4 |
222.3 |
0.9 |
190.5 |
223.9 |
0.196 |
41.7 |
|
5 |
223.4 |
1.2 |
272.0 |
224.8 |
0.192 |
41.6 |
|
6 |
223.2 |
0.9 |
196.6 |
224.6 |
0.193 |
41.0 |
|
7 |
223.0 |
1.0 |
234.0 |
224.2 |
0.189 |
40.7 |
|
8 |
223.1 |
1.1 |
255.6 |
224.1 |
0.189 |
40.5 |
|
9 |
223.2 |
0.9 |
191.2 |
224.2 |
0.190 |
40.3 |
|
10 |
222.2 |
1.4 |
302.6 |
223.1 |
0.187 |
40.0 |
Monitoring analysis electronic device B (lamp) in Table 8 is that the voltage reading (V) produced by the device design with a digital watt meter is close to, but the current (A) and power (W) readings from the device design are still not close to the digital watt meter.
|
Table 8. Monitoring Analysis Electronic Device B (Lamp) | ||||||
|
Minuite |
Designed Device |
Digital Watt Meter | ||||
|
Voltage |
Current |
Power |
Current |
Voltage |
Power | |
|
1 |
228.8 |
0.3 |
61.5 |
223.1 |
0.014 |
1.9 |
|
2 |
220.8 |
0.1 |
22.2 |
223.2 |
0.013 |
2.1 |
|
3 |
235.5 |
0.1 |
18.0 |
223.0 |
0.014 |
1.9 |
|
4 |
230.3 |
0.1 |
23.1 |
222.5 |
0.014 |
2.1 |
|
5 |
218.6 |
0.2 |
43.0 |
222.7 |
0.013 |
2.1 |
|
6 |
224.1 |
0.3 |
71.0 |
222.2 |
0.014 |
2.0 |
|
7 |
226.5 |
0.1 |
22.8 |
222.2 |
0.013 |
1.8 |
|
8 |
225.8 |
0.1 |
17.3 |
222.3 |
0.014 |
2.0 |
|
9 |
226.2 |
0.1 |
22.7 |
222.5 |
0.012 |
1.8 |
|
10 |
222.6 |
0.2 |
49.1 |
222.3 |
0.014 |
2.0 |
The conclusion of this research is the designed device and Android application that have been built has been able to control and monitor electronic devices A and B. Users can control electronic devices A and B through main switch on the designed device, switch button and timer on Android application, realtime monitoring of the use of power, current and voltage of electronic device A and B is carried out through the Android application. The test results show that the Android application and tool design can control with a 100% success rate in each type of test, in the future adjustments of current monitoring need to be made so that the power monitoring results are better.
References
-
[1] T. D. Hendrawati, Y. D. Wicaksono, and E. Andika, “Internet of Things: Sistem Kontrol-
Monitoring Daya Perangkat Elektronika,” JTERA (Jurnal Teknol. Rekayasa), 2018, doi: 10.31544/jtera.v3.i2.2018.177-184.
-
[2] D. Handarly and J. Lianda, “Sistem Monitoring Daya Listrik Berbasis IoT (Internet of
Thing),” JEECAE (Journal Electr. Electron. Control. Automot. Eng., 2018, doi:
10.32486/jeecae.v3i2.241.
-
[3] A. Amir, A. Marwanto, and D. Nugroho, “RANCANG BANGUN PURWARUPA ALAT
MONITORING DAN KONTROL BEBAN SATU FASA BERBASIS IOT (INTERNET OF THINGS),” Transmisi, 2018, doi: 10.14710/transmisi.20.1.29-33.
-
[4] M. A. Alipudin and et. al, “Rancang bangun alat monitoring biaya listrik terpakai berbasis
internet of things (iot),” pp. 1–11, 2019.
-
[5] I. W. Pande Agustiana Putra, I. N. Piarsa, and K. Suar Wibawa, “Sistem Pendeteksi
Kebakaran Menggunakan Raspberry Pi Berbasis Android,” J. Ilm. Merpati (Menara Penelit. Akad. Teknol. Informasi), 2018, doi: 10.24843/jim.2018.v06.i03.p03.
-
[6] D. Sasmoko and D. Bachtiar, “Intelligent Baby Box Based on IoT to Observe Room
Temperature and Baby Crying,” Lontar Komput. J. Ilm. Teknol. Inf., 2018, doi:
10.24843/lkjiti.2018.v09.i03.p01.
-
[7] F. Djuandi, “Pengenalan Arduino,” E-book. www. tobuku, pp. 1–24, 2011, [Online].
Available: http://www.tobuku.com/docs/Arduino-Pengenalan.pdf.
-
[8] W. Agung Cahyawan and A. Ketut, “Sistem Monitor Dan Kendali Ruang Server Dengan
Embedded Ethernet,” Lontar Komput. J. Ilm. Teknol. Inf., 2011.
-
[9] Suhanto, A. Setiyo Prabowo, R. Indrianto Sudjoko, and W. Suryono, “The electrical
energy usage of monitoring system at real-time using IoT as the primary policy of energy efficiency,” 2020, doi: 10.1088/1757-899X/909/1/012009.
-
[10] G. Widya Dharma, I. N. Piarsa, and I. M. Agus Dwi Suarjaya, “Kontrol Kunci Pintu Rumah Menggunakan Raspberry Pi Berbasis Android,” J. Ilm. Merpati (Menara Penelit. Akad. Teknol. Informasi), 2018, doi: 10.24843/jim.2018.v06.i03.p02.
-
[11] “Sistem Monitoring Konsumsi Energi Listrik Secara Real Time Berbasis Mikrokontroler,” E-JOURNAL Tek. ELEKTRO DAN Komput., 2015.
-
[12] B. B. Kusuma, “Studi Koordinasi Rele Arus Lebih Dan Sekring Pemutus Untuk
Mengamankan Sistem Akibat Gangguan Hubung Singkat,” Academia.Edu, 2017.
-
[13] K. S. Wibawa and P. Wirabuana, “Design and Implementation of Monitoring System
Automatic Water Level Reservoir Controller 2018 IJLERA – All Right Reserved,” no. June, 2019.
-
[14] A. Rahmi, I. Piarsa, and P. Buana, “FinDoctor-Interactive Android Clinic Geographical Information System Using Firebase and Google Maps API,” Int. J. New Technol. Res., 2017.
Design and Build Wireless Relay with Electricity Monitoring Based on Internet of Things
(Made Toby Sathya Pratika)
45
Discussion and feedback