Identification of Baby's Feet Using Principal Component Analysis (PCA) Method Character Extraction with K-Nearest Neighbor (KNN) Classification in Matlab Application
on
JURNAL ILMIAH MERPATI VOL. 9, NO. 3 DECEMBER 2021 p-ISSN: 2252-3006
e-ISSN: 2685-2411
Identification of Baby's Feet Using Principal Component Analysis (PCA) Method Character Extraction with K-Nearest Neighbor (KNN) Classification in Matlab Application
Gede Geyge Andika Lesmanaa1, I Nyoman Piarsaa2, I Made Suwija Putraa3 aInformation Technology Dapartment, Faculty of Engineering,
Udayana University Bukit Jimbaran, Bali, Indonesia, phone. (0361) 701806 e-mail: 1andika.dragneel@gmail.com, 2manpits@unud.ac.id, 3putrasuwija@unud.ac.id
Abstrak
Sistem pengenalan biometrik atau identifikasi manusia sangat penting dalam akses keamanan untuk sistem identifikasi dan verifikasi. Sistem pengenalan biometrik dapat digunakan sebagai sistem identifikasi berdasarkan ciri-ciri yang dimiliki oleh bagian tubuh setiap individu. Telapak kaki dapat digunakan untuk identifikasi karena telapak kaki memiliki karakteristik tertentu dan unik yang meliputi garis besar, tonjolan, titik-titik kecil, titik tunggal, dan tekstur. Pengenalan biometrik pada bayi masih bersifat konvensional yang merupakan standar operasional prosedur seperti pemasangan gelang pada kaki bayi dan pencantuman atau penintaan pada telapak kaki bayi yang ditempelkan pada kertas dan sangat rentan terhadap resiko kerusakan atau kehilangan data, maka diperlukan suatu sistem yang dapat menyimpan data secara otomatis digital dan mampu melakukan proses identifikasi bayi. Metode Principal Component Analysis digunakan untuk proses ekstraksi ciri-ciri kaki bayi. Klasifikasi menggunakan metode K-Nearest Neighbor (K-NN) dengan pendekatan jarak euclidean. Pengujian dilakukan dengan menggunakan 120 gambar kaki bayi, terdapat 20 kelas, masing-masing kelas berisi 3 gambar kaki kanan dan 3 gambar kaki kiri, dan dataset 280 gambar latih. Hasil akurasi tertinggi yang diperoleh pada pengujian sistem adalah 91% dengan waktu komputasi 5,63 detik menggunakan metode Principal Component Analysis dengan klasifikasi K-Nearest Neighbor (K-NN).
Kata kunci: Ekstraksi Fitur, K-Nearest Neighbor, Principal Component Analysis, Telapak Kaki,
Abstract
Biometric recognition systems or human identification are very important in security access for identification and verification systems. The biometric recognition system can be used as an identification system based on the characteristics possessed by the body part of each individual. The soles of the feet can be used for identification because the soles of the feet have certain and unique characteristics which include major lines, protrusions, small dots, single points, and textures. The introduction of biometrics in babies is still conventional, which is a standard operating procedure such as attaching bracelets on baby's feet and imprinting or inking on the soles of baby's feet which are affixed to paper and are very vulnerable to the risk of damage or loss of data, there is a need for a system that can store data automatically digital and able to do the baby identification process. The Principal Component Analysis method is used for the extraction process of the characteristics of the baby's feet. The classification uses the K-Nearest Neighbor (K-NN) method with the euclidean distance approach. Tests were carried using 120 images of baby feet, there are 20 classes, each class contains 3 images of the right foot and 3 images of the foot of the left foot, and a dataset of 280 training images. The highest accuracy result obtained in system testing is 91% with a computation time of 5.63 seconds using the Principal Component Analysis method with the K-Nearest Neighbor (K-NN) classification.
Keywords: Footprint, Feature Extraction, Principal Component Analysis, K-Nearest Neighbor.
The digital biometrics system is one of the important systems to be developed to help develop the introduction of digital biometrics, one of which is in the medical world in Indonesia. Hospitals or health centers in Indonesia still use conventional biometric identification which is standard operating procedures such as attaching bracelets on baby's feet and imposing stamps or ink on the soles of baby's feet which are affixed to paper and are very vulnerable to the risk of damage or loss of data.[1] The conventional identification system should be replaced by a more efficient biometric recognition system using computer vision technology.
The soles of the feet can be used as identification because the soles of the feet have certain and unique characteristics which include major lines, protrusions, small dots, single points, and textures. The pattern of the soles of the feet is unique to each person or individual. The key feature used in the identification of the sole is determining how the shape of the baby's foot is taken for identification purposes. The research aims to identify because the stages of the research carried out are the process of researching, looking for, finding, recording, and recognizing factual data or someone in the soles of the baby's feet.
The characteristics of Principal Component Analysis are the special characteristics of individuals that are obtained from the eigenvector and eigenvalues by calculating the matrix pixel images of the baby's feet.[2] The K-Nearest Neighbor method is a method that uses a supervised algorithm where the results of a new query instance are classified based on the majority of the categories on K-NN[3]. The purpose of the K-Nearest Neighbor algorithm is to classify new objects based on attributes and training samples. The classifier does not use any method to match and is based on memory only. The biometric recognition system is expected to be able to replace conventional systems and reduce the risk of data loss and damage so that the medical world can have a more competent and longer use recognition system.
K-Nearest Neighbor (K-NN) is a classification algorithm based on the similarity of its nearest neighbors, and is usually used for classification problems. The advantage of the K-NN method is that it is easy to use, effective and efficient, so it can provide good results. The classification of similarity results is obtained based on the closest distance between the data sample and the object. Classify objects according to their closest neighbors, where the k parameter indicates the number of closest neighbors.[4]
The research performed on the system introduction foot passage through the acquisition process using the smartphone's camera with the results obtained 20 classes each baby is different, the amount of image data of the right foot and left around 400 images divided into datasets image of train 280 fruit and datasets test images 120 pieces The preprocessing process carried out is the conversion of the image to grayscale, with the dimensional reduction of the Principal Component Analysis (PCA) method and cropping using the ROI measure which takes most of the baby's foot texture and normalizes the image size. The extraction of the features of the baby's feet uses the Principal Component Analysis (PCA) method and the method used to identify the sole of the baby's feet K-Nearest Neighbor (K-NN) with the parameter K = 1 gets an accuracy percentage of 91.00%, with a computation time of 5,63 seconds.
Another study conducted by Rizal Isnanto using the PCA method and Euclidean Distance classification describes the use of palms because palms have unique characteristics, are difficult to fake and tend to be stable. The best recognition rate is 93.33%. The time used in testing using the Euclidean distance gave better results, namely 17.09 seconds, when using the backpropagation neural network with 75 neurons, the time used was 425 seconds. The implementation of combined PCA recognition and Euclidean distance recognition is more precise than using a combination of PCA and backpropagation neural networks. [5]
Another research conducted by Koul using the PCA method and the Gabor Filter describes the use of palm feature basic pattern matching by combining original features and palm print features using PCA, Gabor Filter and K-NN for classification purposes. This proposed technique pre-processes the palm image using the center of the palm (palm region) discriminating for different people, then the ROI extract is used to remove other parts of the palm area and finally the feature extract is done with PCA for dimensional reduction. The system was tested on 40 records (from the CASIA palm print database) and observed that the system was simple and provided an average accuracy of 98%. Research on identification using Principal Component Analysis (PCA) with the K-Nearest Neighbor (K-NN) classification has
never been carried out on objects of baby feet based on exposure in case studies of human biometric systems.[6]
The importance of the biometrics recognition system in helping the development of digital technology in the medical world has made a study entitled "identification of baby feet using the feature extraction of the Principal Component Analysis (PCA) method with the K-Nearest Neighbor (K-NN) classification in the MatLab application". The biometric recognition system is expected to be able to replace conventional systems and reduce the risk of data loss and damage so that the medical world can have a more competent and longer use recognition system.
The research flow in making the system has several stages. In working on the research flow system is a reference so that the system work can be on time and schedule. Figure 1 is an illustration of the system flow
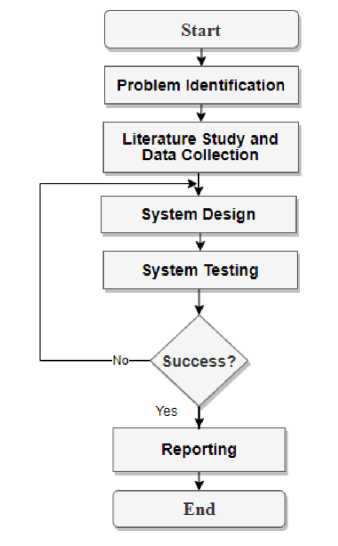
Figure 1. Research Flow
Figure 1 is some of the processes of recognizing the soles of the baby's feet as a system flow which is described as follows.
The study of the identification of baby feet using the feature extraction of the Principal Component Analysis (PCA) method with the K-Nearest Neighbor (K-NN) classification in the Matlab application is generally illustrated in Figure 2.
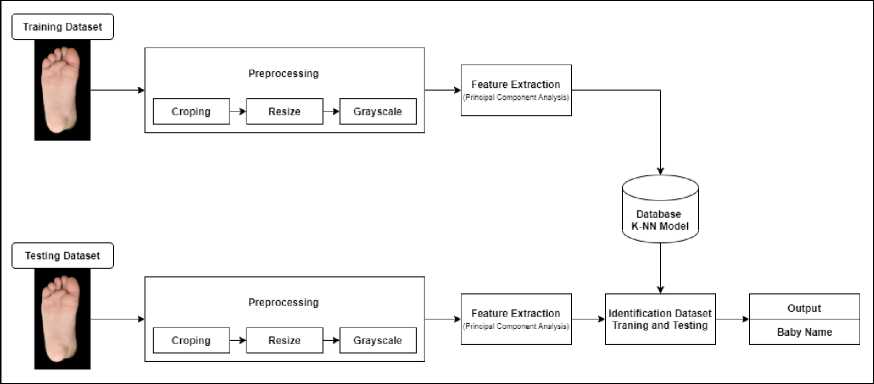
Figure 2. General Overview
Figure 2 is an overview of the baby's foot identification system. The baby's foot identification system has 2 modules, namely a training module and a testing module. The training module has 3 stages, namely image acquisition, preprocessing, feature extraction using the PCA method, and entering the feature extraction results into the system database. The testing module has 5 stages, namely image acquisition, preprocessing, feature extraction using the PCA method, recognition using the K-NN method which compares feature data in the database with feature data from feature extraction, and finally the recognition results. The training module describes training in an identification system that includes image acquisition, preprocessing, and feature extraction. The training data used in the training module are 14 pictures, 7 pictures of the baby's left foot, and 7 pictures of the baby's right foot. The preprocessing stage is carried out by removing the background image of the baby's feet using the image cropping technique so that the image of the baby's feet has been cleaned and the background is black to facilitate the identification process. The feature extraction stage uses the Principal Component Analysis (PCA) method by reducing the value of the input image so that the eigenvector and eigenvalues are used as features of each image stored in the database of the baby's feet. The testing module describes testing in the baby's foot identification system which includes image acquisition, preprocessing, feature extraction, recognition using the K-Nearest Neighbor (K-NN) method, and the results of the recognition in the form of the name of the owner of the baby's foot. The introduction phase with the K-Nearest Neighbor (K-NN) method is processed by entering the characteristics of the baby's feet that have been stored in the database into the K-NN Model, the features entered are in the form of eigenvectors and eigenvalues. The introduction stage produces output in the form of identifying the name of the baby who has the soles of the baby's feet using the K-NN method. The soles of the baby's feet are entered into the system in the form of test data compared to all the footprint data in the database, namely training data and from the characteristics of the eigenvectors and eigenvalues obtained from the results of feature extraction using the Principal Component Analysis method closest to the test data will be selected as the owner of the baby's feet and the name of the selected baby will appear in the system as the owner of the identified foot.
Problem identification is the stage of collecting the problems that form the basis of research and gathering evidence behind these problems so that it can be concluded that research is very necessary and important to do.
This stage is the stage of collecting theory and supporting data in conducting research. Theory obtained through journals, previous research, e-books, and others as a reference for problems that can be raised in the research, State of the Art designs from various journals from
previous research. Data can be obtained directly by looking for babies aged 3 months to take photos of the right and left feet using a smartphone.
system design is a stage for carrying out system design which includes designing the overall system work process flow such as data acquisition stages, data preprocessing stages, feature extraction, and matching, flowchart design, application interface design, and also making appropriate program code so that the application runs on the testing process.
System testing is the application testing stage so that results are obtained whether it is successful or not as expected. This stage also includes making repairs to any errors in the application that were encountered during testing.
Reporting is the stage of making a report of the entire research process and the results of application testing that has been carried out. The purpose of writing this report is to provide written evidence of all the processes that have been carried out so that later it can be used as a reference for further research.
The literature review discusses the theoretical basis obtained from the internet, books, and journals that are used as support and theory in the design and implementation of the application of identification of the sole of the baby's feet.
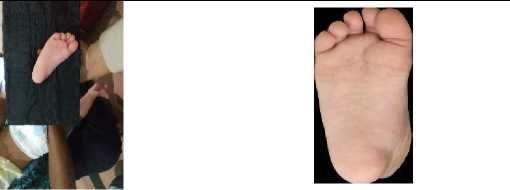
The sole of the foot is one of the most important parts of the human body and can be used for standing and walking. It consists of 26 bones, 33 joints and more than 100 muscles, tendons and ligaments. Generally, the sole of a person's feet is divided into three parts, namely the front legs, the middle feet and the back legs. The sole of the baby's feet can be used as an identification system, because the soles of the baby's feet are still pure and will not be scratched or injured when walking. Examples of baby feet used in the study are as follows.[7]
Table 1. Baby’s Footprint Image Documentation Data.
Final Result
Baby’s Name
Result of Documentation
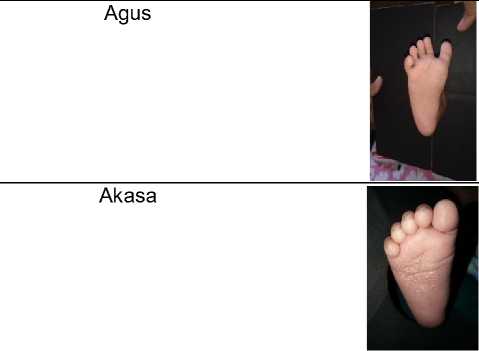
Alisa
The table is an example of the results of image acquisition that has been taken using a smartphone camera then the preprocessing process is carried out to remove the image background.
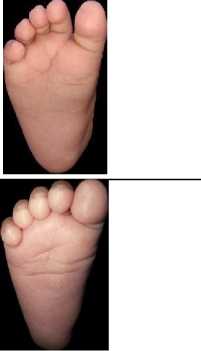
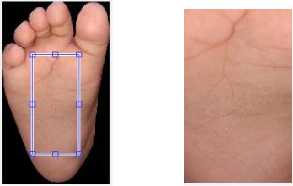
Cropping is the process of cutting an image at certain coordinates in an area of the image. The cropping process is very important before identifying the image, to get the parts of the image that are considered important and have a lot of information. The process of cutting the image part uses two coordinates, namely the initial coordinates of the cutting result and the final coordinates which are the endpoints of the cut. Coordinates form a rectangle where each pixel will be stored in a new image.[8] The cropped image can be seen in Figure 3.
(a) (b)
Figure 3 Result Cropping Image
Figure 3 is an example of an image resulting from the process cropping, image (a) is the original image of the baby’s feet before the process cropping, image (b) is the resulting image after the process cropping.
A grayscale image is a grayscale image with a maximum intensity value of 255 from white to color black with the smallest intensity value (0). A digital image with an 8-bit grayscale has 28 = 256 possible colors, namely 0 (minimum) to 255 (maximum). Changing the color image is to take the respective r, g, and b values into a grayscale image.[9] One good method to convert a color image to a gray image is to use the following equation.
Gray = (0.229 x R) + (0.587 x G) + (0.114 xB) (1)
Principal Component Analysis (PCA) method is a method that aims to simplify the observed variables by reducing their dimensions. Reducing dimensions is done by eliminating the correlation between the independent variables through the transformation of the original independent variable into a new variable that is not correlated at all without losing important information in it or what is commonly called the principal component.[10] The process of reducing dimensions can reduce the computation time and complexity of the foot image that does not need to be eliminated. Principal Component Analysis uses vectors called eigenvectors and values called eigenvalues to get the most significant features in the training data.[2]
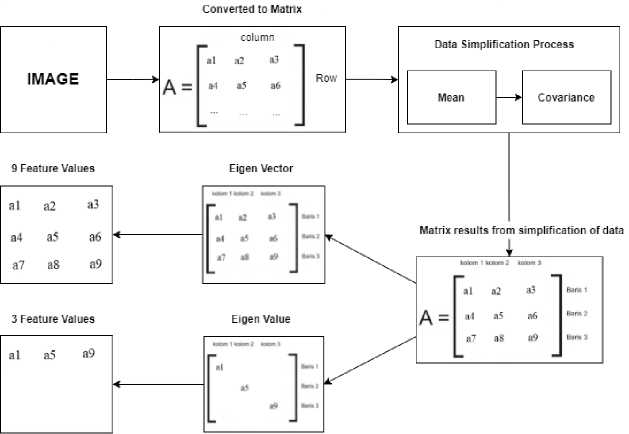
Figure 4 Principal Component Analysis Stage Process
Figure 4 is a picture of the stage of the Principal Component Analysis process which produces eigenvector and eigenvalue.
The process of forming the eigenvector and eigenvalue feature values in the Principal Component Analysis goes through several stages, namely an image that is input into the system is converted into an infinite matrix, and a process of simplifying the matrix data is carried out by performing the mean and covariance process so that a 3x3 matrix is obtained. Then broken down into a characteristic eigenvector in the form of a column matrix value and an eigenvalue which is a diagonal matrix value and obtained 12 characteristics of the Principal Component Analysis.
The principal component is a representation of a linear combination of all the training images that have been reduced by the mean image, the combination of these images is called the eigen vector and the eigen value. Calculation and testing with PCA can be explained as follows.
-
3.4.1 Represent pixel values into vectors by reading the image pixel values from top left to bottom right. This vector is referred to as the original data vector. The original data vector X represents the true value of the acquired face image.
-
3.4.2 Calculate the average vector by subtracting the average image (µ) of each vector image (φi). Finding the average image can be done by dividing each image value by the total number of images.
subtracting the average image from each image vector is done as follows.
-
3.4.3 Calculate the PCA covariance matrix by multiplying the data matrix by the data matrix that has been transposed and divided by the number of image pixels.
-
3.4.4 Determining eigen value (λi) and eigen vector (νi) because of the large covariance matrix dimensions, a numerical method is needed to decompose eigenvectors and eigenvalues. φ is a matrix consisting of column vectors φi placed side-by-side. The size of the covariance matrix (C) is N × N which has a very large value, for example a 100 × 100 pixel image makes a covariance matrix of 10000 × 10000
size. It is impractical to solve the eigenvector of C directly. A common theorem in linear algebra explains that the vector vi and the scalar λi can be obtained by solving for the eigenvectors and eigenvalues of the covariance matrices. [11]
The data simplification process in Principal Component Analysis which can be seen in Figure 5
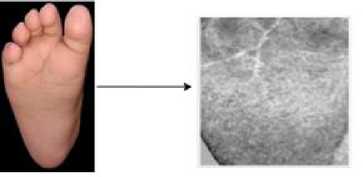
Figure 5 Dimensional Reduction of PCA
Figure 5 is a dimensional reduction process from the Principal Component Analysis method, the function of this dimensional reduction is to get the characteristics of the baby's feet and lighten the computational burden without losing important information contained in the baby's foot data.
The system is developed using the K-nearest neighbor (K-NN) algorithm. This method was chosen because the K-NN method is simple and is a decision support model that can classify data based on the closest distance. The formula used to calculate K-NN is the Euclidean distance formula. The distance measurement will be calculated based on the Euclidean distance in formula 2 below. [12]
D (a, b ) = √∑O¾→37 (5)
Note:
D(a,b) = Euclidean Distance
n = Dimension of data
ak = Test Data
bk = Training data
Results and discussion describe the appearance of the application trial and test analysis that produces the best level of accuracy in the Infant Foot Recognition System.
The trial of the application for the identification of the baby's feet was carried out after completing the system design. The application interface has several main buttons such as select image, ROI detection, dimension reduction, feature extraction, image identification, and probability.
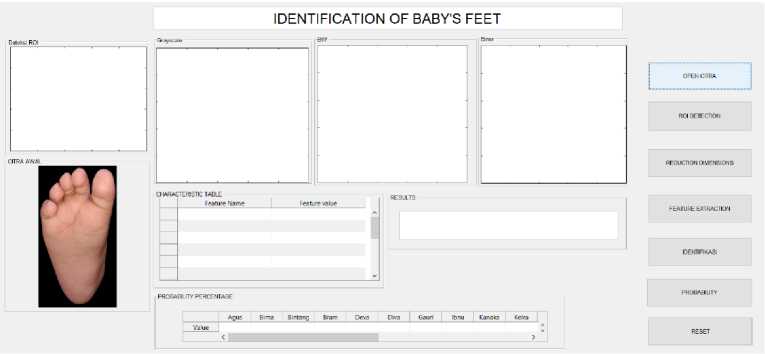
Figure 6 View Open Image
Figure 6 is an image display of the results of the open push button where the image data of the baby's feet in the .png format that has been selected to be opened in the system is displayed. Open image is a push button that functions to display the selected photos in the application so that the next process of the application can run properly
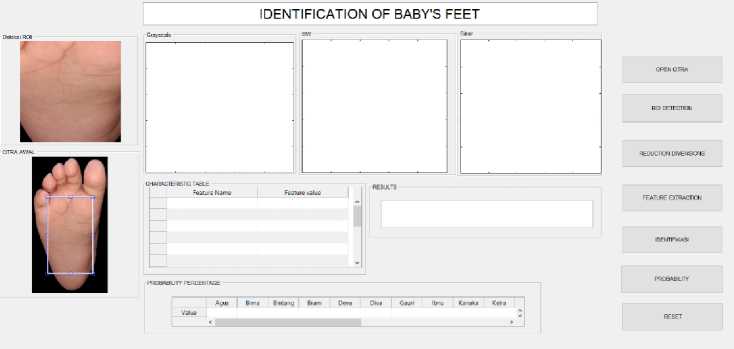
Figure 7 Display Preprocessing Image
Figure 7 is an image display of the detection results of the ROI (Region of Interest) push-button is used and produces a bounding box that displays the cropping result data on the GUI before the dimensional reduction process is carried out. ROI (Region of Interest) Detection is a push button that functions to display the bounding box in the area of the baby's feet to automatically determine the area of the foot that is cropped to simplify the dimensional reduction process.
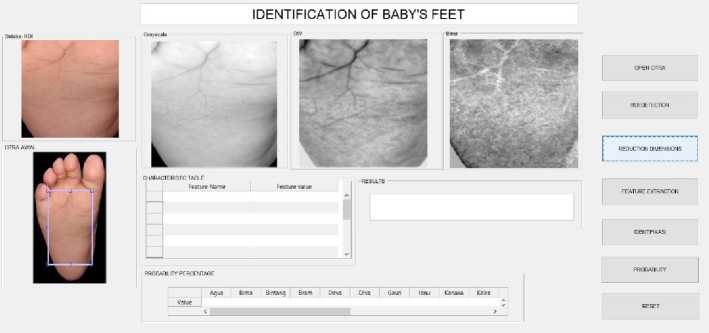
Figure 8 Image Reduction Results
Figure 8 is the final result of the image reduction process where the reduction process is made to produce eigenvector values and eigenvalues in the form of numbers to be processed using the K-NN method in the classification system because the K-NN method can only be used by entering numeric images. Reduction aims to partition the image into main parts that contain important information, for example on the separation of objects and backgrounds used as information or characteristics. The application of identification of baby's feet uses a reduction method, namely by using the PCA method on the image preprocessing results. The result of the reduction in the application of identification of baby's feet is an image that has been reduced in dimensions which contains important characteristic data in the form of eigenvectors and eigenvalues which will be used as values to compare the test data with training data.
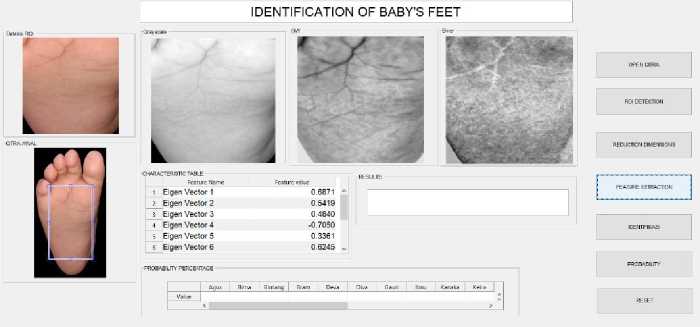
Figure 9 Extraction Results of Image Features
Figure 9 is an illustration of the results of the push button image feature extraction process, the image feature extraction button functions to display the results of the image feature extraction process, which is applied to the test image of the baby's feet which produces 12 image features, 9 eigenvectors, and 3 eigenvalues.
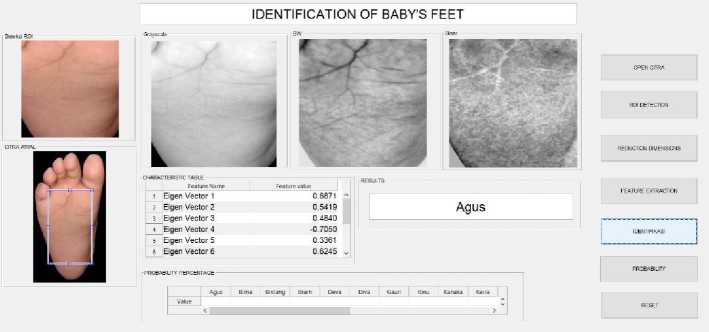
Figure 10 Image Identification
Figure 10 is the result of the identification process of the baby's foot image. The system gets results with the owner of the name of the sole is Raskha, to get the probability of Raskha class and other classes a probability test is carried out at a later stage.
Image recognition using the K-NN parameter is a test that produces an accuracy value based on the k value used in possible classifications. The test is carried out until the parameter value k = 10. A total of 20 data samples (10 right and 10 left legs) and 14 training data were used in the training and 6 test data were used in the following tests. can be seen in Table 2. Calculated FAR by formula:
r∣ λt> _ Th-e number of events that were incorrectly receivedγ1∩∩θ∕n
(6)
(7)
= 100%
The total number of events
And the FRR value can be calculated by the formula:
„ d d _ The number of events that were incorrectly rejected . v1 ∩∩0∕n
= 100%
The total number of events
Calculations using FAR and FRR are presented in a table containing information on the value of k, ratio, FAR and FFR. The results of the FAR and FFR calculations that have been made can be seen in Table 2.
Table 2. Results of K-NN Parameter Image Recognition
|
K Value |
Accuracy |
FAR |
FRR |
|
K=1 |
91.00% |
8,4% |
0% |
|
K=5 |
85.00% |
15% |
0% |
|
K=10 |
72.00% |
27,5% |
0% |
The results of the comparison test between the 3 parameters K (K = 1, K = 5, K = 10) using 120 right and left baby feet, resulted in the highest recognition accuracy obtained by parameter K = 1 as much as 91% where the soles of the baby's feet 10 are recognized by different owners and 110 are recognized by their owners correctly. The test results using the K = 5 parameter resulted in recognition accuracy of 85% and the test results using the K = 10 parameters resulted in recognition accuracy of 72%. The conclusion is that using the k value that is closest to its neighbor, namely K = 1, makes the recognition accuracy higher and the greater the K value used makes the resulting recognition accuracy smaller.
Image recognition using ratio parameters is a test that produces an accuracy value based on the number of training data ratios used in possible classifications. Tests were carried out until the ratio of training data used was 14 samples. A total of 20 data samples (10 right and 10 left legs) and 6 test data were used in the following tests. can be seen in Table 3.
Table 3. Ratio Test Results
|
Ratio |
Accuracy |
FAR |
FRR |
|
4 Sample |
66.00% |
33,40% |
0% |
|
8 Sample |
76,00% |
23,40% |
0% |
|
14 Sampel |
91,00% |
8,40% |
0% |
The results of the comparison test between the 3 parameters of the ratio of the training data used, namely 4 samples, 8 samples, and 14 samples, resulted in the highest recognition accuracy obtained by the ratio using training data of 14 samples, namely 91% where the soles of baby feet recognized by different owners amounted to 10 pieces and the owner correctly recognized 110 pieces. The test results using the training data ratio of 4 samples resulted in recognition accuracy of 66% and the test results using the training data ratio of 8 samples resulted in recognition accuracy of 76%. far and frr are used to get the best percentage of k values that are appropriate for use
The final results of the research conducted on the application of baby foot recognition through the acquisition process using a smartphone camera, with the results obtained by 20 different classes of babies, with 400 images of the right and left foot then divided into 280 pieces of training. image dataset and image dataset. test 120 pieces. The pre-processing process that is carried out is converting the image to grayscale, cropping it using the ROI size which takes most of the baby's foot texture and normalizes the image size. The best test results were obtained by using an ROI of 200x500 size by taking the texture of the baby's feet which then performed the feature extraction using the Principal Component Analysis (PCA) method. Identifying baby feet using K-Nearest Neighbor (K-NN) with the parameter K = 1 gets an accuracy percentage of 91.00% with a testing computation time of 5.63 seconds.
References
-
[1] E. A. Wirasasmita, “Pertanggung Jawaban Pidana terhadap Perawat Maternitas yang
Menghilangkan Identitas Seorang Bayi di Rumah Sakit,” J. Magister Huk. Udayana (Udayana Master Law Journal), vol. 7, no. 2, p. 177, 2018, doi:
10.24843/jmhu.2018.v07.i02.p04.
-
[2] R. Vivekanandam and M. Madheswaran, “Principal Component Analysis based
Palmprint Recognition with Center of Mass Moments,” Int. J. Sci. Eng. Res., vol. 3, no. 10, pp. 1–6, 2012.
-
[3] G. Angga, N. Piarsa, and M. Suwija, “Comparison of Support Vector Machine and K-
Nearest Neighbor for Baby Foot Identification based on Image Geometric Characteristics,” vol. 9, no. 1, pp. 84–95, 2021.
-
[4] A. Husin, O. Mahmod, and L. Afrinanda, “Poisonous Shrimp Detection System for
Litopenaeus Vannamei using k-Nearest Neighbor Method,” Lontar Komput. J. Ilm. Teknol. Inf., vol. 9, no. 1, p. 20, 2018, doi: 10.24843/lkjiti.2018.v09.i01.p03.
-
[5] R. Rizal Isnanto, A. A. Zahra, A. K. Haq, and F. Rozy, “Palmprint recognition systems
based-on backpropagation neural network and euclidean distance using principal components analysis (PCA) feature extraction,” Int. J. Softw. Eng. its Appl., vol. 10, no. 11, pp. 131–142, 2016, doi: 10.14257/ijseia.2016.10.11.11.
-
[6] S. K. Koul, D., & Alaria, “A New Palm Print Recognition Approach by Using PCA &
Gabor Filter,” Int. J. Futur. Comput. Sci. Commun. Eng., vol. 4, no. 4, pp. 38–45, 2018.
-
[7] D. B. Wibowo, “Efektifitas Menaikkan Area Kontak Telapak Kaki Pada Pengurangan
Tekanan Di Daerah Tumit Bagi Penderita Inferior Calcanea Spur,” pp. 19–25, 2018.
-
[8] F. Muwardi and A. Fadlil, “Sistem Pengenalan Bunga Berbasis Pengolahan Citra dan
Pengklasifikasi Jarak,” J. Ilm. Tek. Elektro Komput. dan Inform., vol. 3, no. 2, p. 124, 2018, doi: 10.26555/jiteki.v3i2.7470.
-
[9] E. Wahyudi, D. Triyanti, and I. Ruslianto, “Identifikasi Teks Dokumen Menggunakan
Metode Profile Projection Dan Template Matching,” J. Coding Sist. Komput. Untan, vol. 03, no. 2, pp. 1–10, 2015.
-
[10] W. Agus et al., “ILMU KOMPUTER Universitas Udayana PREDIKSI KESUBURAN ( FERTILITY ) DENGAN MENGGUNAKAN PRINCIPAL COMPONENT ANALYSIS DAN KLASIFIKASI NAIVE BAYES,” vol. X, no. 2, pp. 10–14, 2017.
-
[11] S. Wijaya et al., “EKSTRAKSI CIRI WAJAH MANUSIA MENGGUNAKAN ALGORITMA PRINCIPAL COMPONENT ANALYSIS ( PCA ) UNTUK SISTEM PENGENALAN WAJAH,” vol. 1, no. 1, pp. 16–23, 2014.
-
[12] D. C. Khrisne and D. Putra, “Automatic Image Annotation Menggunakan Metode Block Truncation Dan K-Nearest Neighbor,” Lontar Komput. J. Ilm. Teknol. Inf., vol. 0, no. 0, pp. 224–230, 2015, doi: 10.24843/LKJITI.
Identification of Baby’s Feet Using Principal Component Analysis (PCA) Method Character 212
Extraction with K-Nearest Neighbor (KNN) Classification in Matlab Application (Gede Geyge
Andika Lesmana)
Discussion and feedback