Implementation Drought Area Identifier Application Of East Bali Based On Remote Sensing
on
JURNAL ILMIAH MERPATI VOL. 8, NO. 1 APRIL 2020
p-ISSN: 2252-3006
e-ISSN: 2685-2411
Implementation Drought Area Identifier Application Of East Bali Based On Remote Sensing
Ngurah Padang Adnyana, I Dewa Nyoman Nurweda Putra, I Ketut Adi Purnawan Information Technology, Faculty of Engineering, Udayana University e-mail: npadnyana@gmail.com, nurweda14@unud.ac.id, dosenadi@yahoo.com,
Abstract
Drought is a natural disaster whose frequency is quite high and occurs almost every year. According to the radarbali.jawapos.com page on June 15, 2019, rice fields in Karangasem are threatened by drought. 2000 hectares of agricultural land threatened with drought or did not get irrigation supply because during the dry season the water source used to irrigate the land was drastically reduced and even partly dried up. From the observations of the UPTD of the Horticultural Agricultural Plant Protection Agency (BPTPH) of the Bali Provincial Agriculture Office, until June 2019 there was damage to rice fields due to drought where observations were made since the start of the planting season in May. Drought area information is used to map and calculate the area of drought areas, so that areas with drought potential can be identified. One way to get drought area data is by remote sensing technology. Identification of potential drought areas is the basic idea for the formation of drought identification applications in East Bali. The remote sensing application uses the NDDI (Normalized Difference Drought Index) method. NDDI is the result of calculation of the Normalized Difference Vegetation Index (NDVI) which is an index of vegetation parameters and Normalized Difference Water Index (NDWI) which is the value of wetness of vegetation. The images used in this study are Landsat 8 imagery with OLI (Onboard Operational Land Imager) sensor and TIRS (Thermal Infrared Sensor) sensor. The result of the application of drought area identification is the visualization of drought area and the extent of drought area based on the category of very dry, dry, mild dry, normal and non-classification using hectare units.
Keywords: Remote Sensing, Drought, Landsat 8, NDDI
Natural disasters are phenomena that can threaten the survival of life. The negative effects of natural disasters can directly affect the activities of living things. Drought is a natural disaster whose frequency is quite high and occurs almost every year [1]. Most natural disasters that occur in Indonesia are disasters related to climate change such as floods, droughts and forest fires. Data that contains information on potential areas of drought which slightly plays a role as one of the factors that hamper in solving drought problems, so drought area data is needed considering drought is a problem that has a serious impact on all sectors of life [2].
Remote sensing technology is developing rapidly along with the changing times. Remote sensing technology produces a variety of data both aerial photographs and satellite imagery that can describe the surface of the earth. Satellite technology plays an important role in remote sensing because it is able to analyze the state of the Earth's vegetation without direct contact with the object of research. One of the Remote sensing research in the field of environment and disaster mitigation is about drought that is discussed in this research.
Previous research as a reference for this paper was conducted by Fadli Rahman with an analysis of agricultural land drought in Kendal Regency in 2015 with the Normalized Difference Drought Index (NDDI) algorithm [3] and using the Head of National Disaster Management Agency (Perka BNPB) No. 2 of 2012 about general guidelines for assessing disaster risk. Normalized Difference Drought Index (NDDI) is a new method for drought delineation using MODIS surface reflectance data which was first presented in a paper by Yingxin Gu in 2007 [4]. The experimental results of both methods, obtained an NDDI method accuracy of 82% and BNPB Perka of 70%. The NDDI method can be concluded more accurately than Perka BNPB in identifying the drought of agricultural land in Kendal Regency in 2015.
Drought identification research utilizes Landsat 8 imagery as research data and NDVI (Normalized Difference Vegetation Index) algorithm, NDWI (Normalized Difference Water Index), and then combined in NDDI (Normalized Difference Drought Index) method. Research into the drought identification of the East Bali region developed software. In contrast to previous studies using existing software, this study developed applications using Landsat 8 OLI / TIRS imagery, with test data on old data on March 27, 2014 and new data on March 16, 2016 with methods similar to previous research. The developed application can identify areas of drought and analyze the extent of drought areas based on the categories of very dry, dry, mild dry, normal and non-classification using units of hectares.
The research methodology is a description of the entire process carried out on the system and modules that will later be applied into the application. General description of application Identification of drought areas in East Bali is explained in Figure 1.
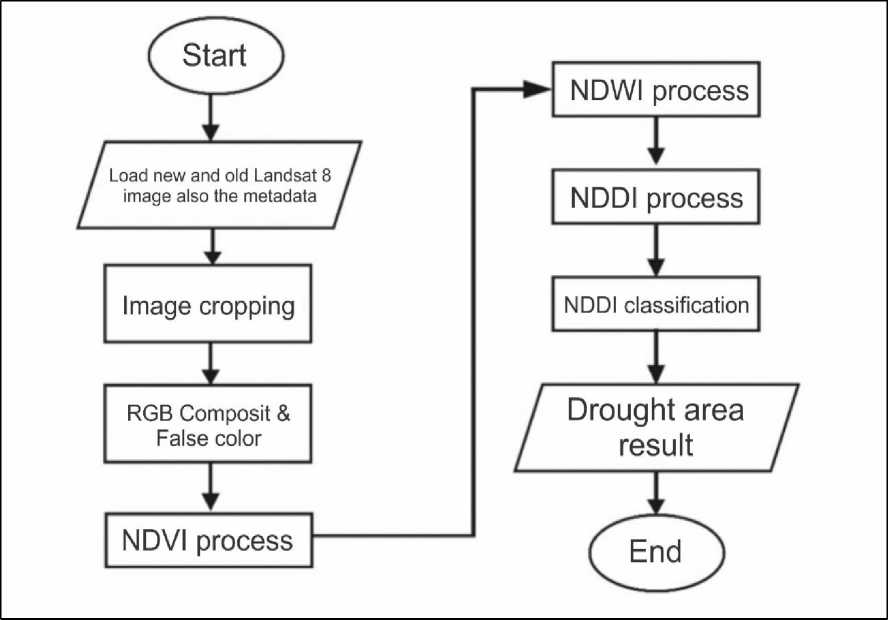
Figure 1. General Description of the System
The drought identification phase begins by loading the two images required with the red, green and blue bands in each image and loading the metadata in the image. The second stage is image cutting to get the area that you want to study. The third stage is the composite RGB and False Color which is used to distinguish objects in the image. The fourth stage is the NDVI process to determine the vegetation index contained in the image. The vegetation object is an object
with a high water absorption capacity, vice versa objects other than vegetation are waterproof objects. The high NDVI value indicates the areawith high vegetation density, ability high water absorption. Instead the NDVI value is Low indicates the area with density low vegetation, water absorption ability low identified drought. The fifth stage is the NDWI process which is used to determine the index of water content in vegetation. The assumption used is increasingly low transformation spectral value the wetness index of an object then the object is drier, conversely the higher the grade level spectral transformation of the index the wetness of an object, then the object getting wetter. The sixth stage is the NDDI process to display potentially drought areas. The seventh stage is the classification of the NDDI process. NDDI process that will produce
output in the form of images that contain areas that are having drought. Drought is categorized into five categories, there are is very dry, dry, mild dry, normal and non-classification categories.
Literature study is a set of basic theories that are used in developing applications of identification of drought areas in East Bali based on remote sensing. Literature review is obtained from journals or books or the internet that supports making applications.
Since 1972, Landsat satellites have been continuously receiving surface images of the Earth's land surface, shallow beaches and space-based coral reefs. The Landsat Program is the result of collaboration from the US Geological Survey (USGS) and the National Aeronautics and Space Administration (NASA), which was established to collect soil images from space regularly. NASA developed remote sensing instruments and spacecraft, which then launched and validated the performance of instruments and satellites. The USGS then assumes satellite ownership and operation, while also managing all land image reception, data archiving, product generation, and distribution. The outcome of this program is a long-term record of changes caused by nature and humans globally [7].
Remote sensing imagery is obtained from a satellite, aircraft or other device. Remote sensing images come from sensor recordings that have different characteristics at each height level which ultimately determine the difference from the remote sensing data generated. The Landsat satellite is one of the remote sensing satellites that was first launched in 1972 [8]. The use of Landsat imagery for land use mapping is especially popular in developing countries to speed up the acquisition of the data needed or to update old data.
Landsat 8 satellites have sensors with different ranges, each of which has characteristics that are determined by the frequency of the electromagnetic spectrum. Each range in Landsat 8 imagery is known as a band. In total Landsat 8 has 11 bands [8]. Pixel values in commercial satellite imagery indicate exposure from the earth's surface in the form of Digital Numbers (DN) calibrated to a range of values. Conversion of DN into real exposure needs to be done for comparative analysis of several images taken by different sensors. Landsat 8 image needed to conduct oil spill detection research. There are three bands namely Band 4- Visible Red Band which is useful for discriminating vegetation slopes, Band 3- Visible Green Band which is useful for emphasizing peak vegetation which is useful for assessing plant strength and Band 3- Visible Blue is a useful band for mapping bathymetry and distinguishing land, Band 5- Visible NIR is a useful band to emphasize biomass and coastline content. Utilization of Landsat imagery has been numerous used for several survey activities as well as research, including geology, mining, geomorphology, hydrology and forestry. Monitoring the drought based remote sensing information becomes popular and widely used because of cost the cheaper, data availability continuous and data reliability which high.
NDVI is a method that is often used to utilize the Spectral Vegetation Index (SVI) spectral data from remote sensing. Spectral vegetation index from remote sensing data is formed due to differences in reflection of waves from the leaves of living plants with other objects on the surface of the earth at green wavelengths (visible) and near infrared (invisible) [4]. NDVI equation is the result of reducing the pixel value of the near infrared band to the visible red band. The input band used must be radiometrically corrected first [5]. The NDVI equation is mathematically described in equation (1).
( b an d NI R-b an d R e d) ( b nd d NR R+b an d R e d')
(1)
where :
NDVI = Normalized Difference Vegetation Index
BandNIR = Band Near Infra Red.
BandVisibleRed = Band Red
NDWI is a remote sensing based indicator that is sensitive to changes in leaf moisture content. One of them is used to monitor changes in leaf water content, using near-infrared (NIR) and shortwave-infrared (SWIR) wavelengths. The NDWI equation is mathematically described in equation (2).
(b an d NIR - bandSWIR)
NDWI = 1------------------ (2)
(bnnNNRR+bnsSSWIR)
where : NDWI bandNIR bandSWIR
= Normalized Difference Water Index
= Band Near Infra Red.
= Band Shortwave Infra Red
The results of the NDWI which is an index, has a range of values of -1 for non-bodies of water and 1 for appearance of bodies of water, so a treshold is needed to separate the bodies of water and non-bodies of water. Other uses are to monitor changes related to water content in water bodies such as rivers, lakes, swamps, oceans and oceans using green wavelengths (band green) and NIR (near-infrared band) described in equation 3.
(bnsdGre e n - bnsNNIR)
(3)
NDWI = -----------------
(b ns d G r e e n+b ns dN IR)
The NDWI algorithm is used to monitor vegetation in areas affected by drought, it is recommended to use NIR and SWIR. SWIR reflections reflect changes in the moisture content of vegetation and mesophyll structures such as flowers in the vegetation canopy. NIR reflection is influenced by the internal structure of the leaf and the leaf dry matter content, but not by the moisture content. The combination of NIR and SWIR eliminates variations caused by the leaf's internal structure and leaf dry matter content, increasing accuracy in taking vegetation water content. Spectral green and NIR bands are recommended if looking for water levels or changes in water levels, such as floods.
The Normalized Difference Drought Index (NDDI) developed by Yinxin Gu and friends can be used as well as the Normalized Difference Water Index (NDWI). This index is relatively new and was originally applied to grasslands in central Great Plains in the United States by Gu et al. . in 2007 using MODIS imagery, they found MODIS-based NDDI was a superior indicator of drought than using only the NDVI, NDWI method, or by applying the difference between NDVI and NDWI. The NDDI algorithm is described in equation 4.
(ND VI-ND WI)
(4)
NDDI = -----------
(ND VI +DD WI)
The application designed is a desktop based application. The GUI or Graphical User Interface application is made simple so that it is easy to use by the user shown in Figure 2.
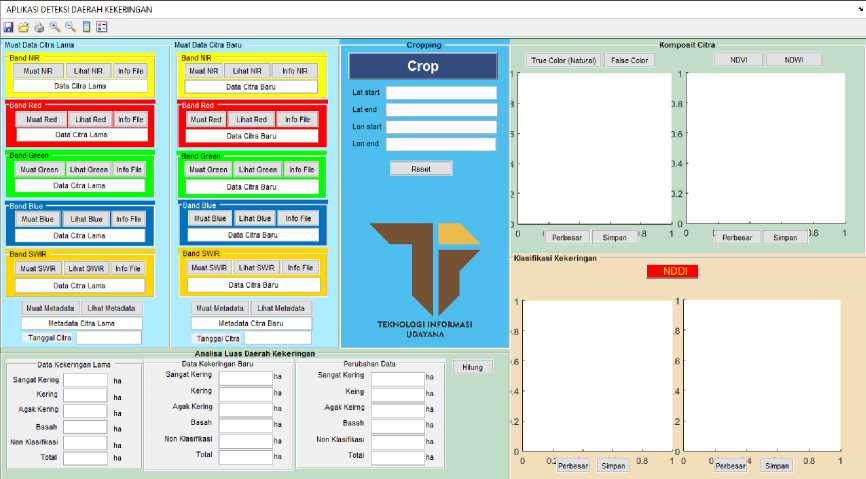
Figure 2. Main View of Application
The main page of the application for the identification of drought areas in East Bali, consists of four main menus which are processes that can be run within the application. Cropping panel there is a menu to open the cropping window. The Image Composite Panel consists of the true color, false color menu and there are NDVI and NDWI buttons used to open the NDVI and NDWI algorithm calculation window. The drought classification panel has an NDDI button which determines the drought area in the image and the results are directly displayed in the image box contained in the drought classification panel. The Drought Area Analysis Panel displays the extent of the drought area in hectares.
NDVI (Normal Difference Vegetation Index) is an algorithm used to detect vegetation density. NDVI can show parameters related to vegetation parameters, among others, green leaf biomass, green leaf area which is a value that can be estimated for the distribution of vegetation. The results obtained in the NDVI process are as follows:
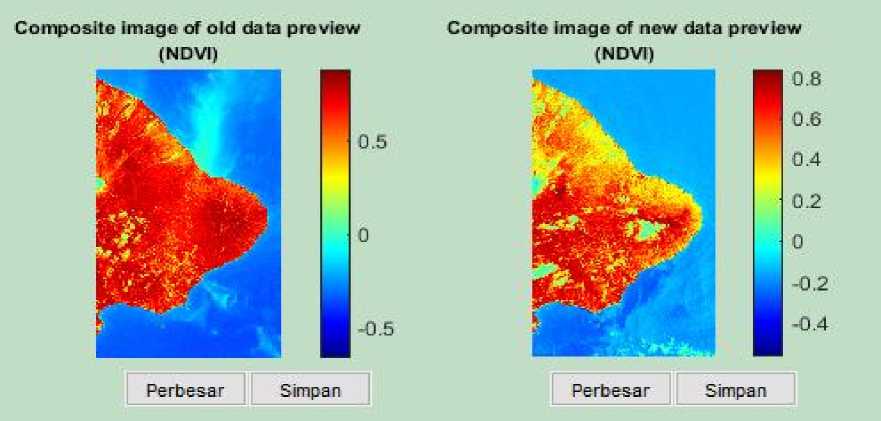
Figure 3. Display of NDVI Process Results
The results of the image after processing with the Normalized Difference Vegetation Index (NDVI) using the band 5 image (NIR band) and band 4 (band red) Landsat 8. The colorbar located on the right of the image shows a graph related to the vegetation value in the research image. The higher the value on the colorbar, the higher the vegetation index in the study image. NDVI has a range of values from -1.0 to 1.0. Clouds, water, and non-vegetation objects have NDVI values less than zero. Values representing vegetation are in the range of 0.1 to 0.7. The classification of NDVI levels can be seen in Table 1.
Table 1. NDVI Classification
|
Classification |
Rate |
|
Very High |
0,4<NDVI≤0.45 |
|
High |
0,45<NDVI≤0.5 |
|
Medium |
0,5<NDVI≤0.55 |
|
Full |
0,55<NDVI≤0.8 |
Calculation of Normalized Difference Wetness Index (NDWI) is an index that shows the level of wetness of an area. NDWI calculations use band 5 (near infra red) and band 6 (short wavelength infra red) (SWIR). The NIR band is used to identify vegetation and also the biomass content, the SWIR band is used to identify vegetation humidity and soil moisture.
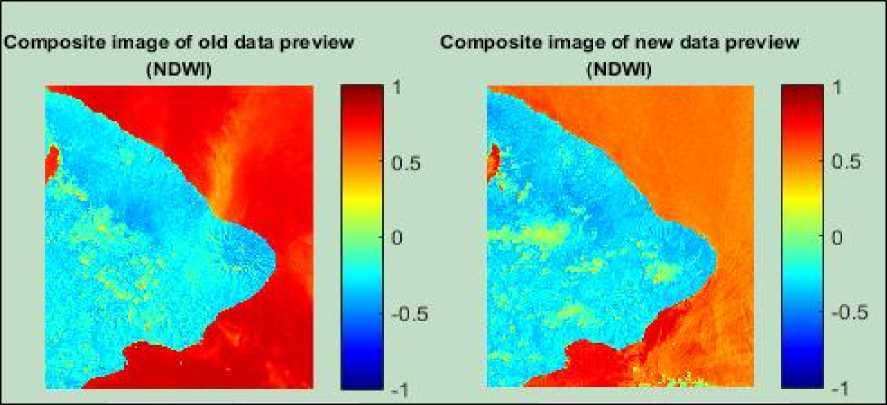
Figure 4. Display of NDWI Process Results
The NDWI calculation process in Figure 4 shows the results of the NDWI calculation trial in the drought identification application. The results shown in Figure 4 show that the higher the colobar value, the higher the vegetation or soil moisture index. Logically shows that if the NDWI value is high on a soil, the vegetation in the selection area is very dense, and vice versa, if the NDWI value is low, then the vegetation is rare or low in a study area.
The results of the NDDI process in Figure 5 in the drought classification panel shows the image results that show the NDDI calculation results to identify the drought after pressing the 'NDDI' button. On the right side of the resulting image there is a colorbar consisting of numbers 1 to 5, where each number indicates that there are five categories of drought based on their color. For 'Very Dry' classes are shown in red, 'Dry' classes are shown in orange, 'Mild Dry' classes are shown in green, 'Normal' classes are shown in light blue where the areas categorized as normal are soil conditions and balanced vegetation . The 'Non Classification' class is shown in dark blue. Non-Classification category is the area of water or clouds. The drought classification panel has a zoom button and a save button. The zoom button functions to
enlarge the appearance of the processed image. The save button is used to save images from the NDDI process to computer storage in the form of .jpeg or .tiff files.
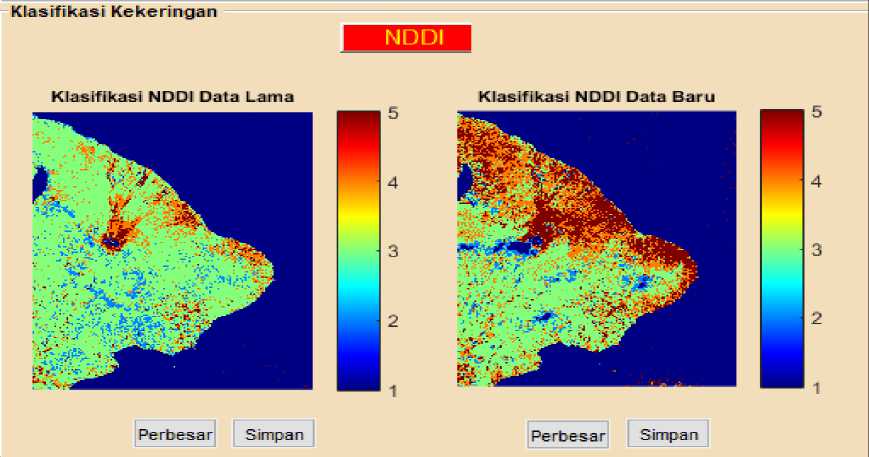
Figure 5. Display of NDDI Process Results
The drought area analysis process using the NDDI algorithm is shown in Figure 6 where when the user presses the 'NDDI' button, it will automatically display the drought area information in each of the drought categories of the old and new images and their changes. Extensive data changes with positive values indicate an increase in land changes, conversely negative or negative values indicate a decrease in the distribution of drought areas. The analysis data will appear in the 'Drought Area Analysis' panel as shown in Figure 6.
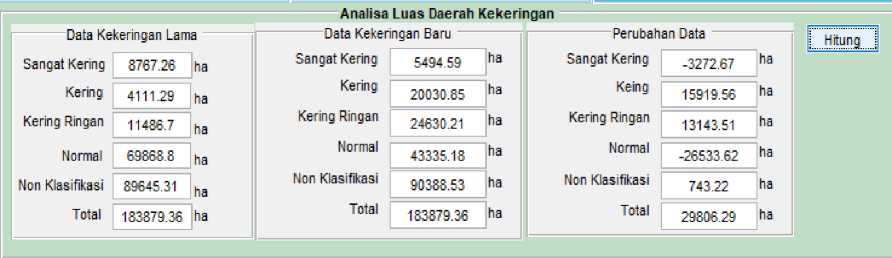
Figure 6. Drought Area Analysis Area
Drought area analysis process in Figure 6 shows the total area of the image obtained a total area of 183879.26 hectares in each of the old images and new images. In the old image drought data there were 8767.26 hectares in the very dry category, 4111.29 hectares in the dry category, 11486.7 hectares in the mild dry category, 69868.8 hectares in the normal category, and non-classification covering 89545.31 hectares. Whereas in the drought of the new image there were 5494.59 hectares in the very dry category, 20030.85 hectares in the dry category, 24630.21 hectares in the mild dry category, 43335.18 hectares in the normal category, and nonclassification in the area of 90388.53 hectares. And changes in data that occurred from the old image with a new image of -3272.67 hectares in the very dry category, 15919.56 hectares in the Dry category, 13143.51 hectares in the mild dry category, -26533.62 hectares in the normal category, and non-classification covering an area of 743, 22 hectares. Drought area analysis calculation uses the 1 pixel equation in the Landsat 8 image measuring 900 m2 so as to get the overall value by multiplying 900 by the number of pixels per class then divided by 10,000 to get the unit of hectares.
Application of Drought Area Identification in East Bali Based on Remote Sensing using the NDDI (Normalized Difference Drought Index) method is able to identify drought areas. The process of calculating drought area identification applications in East Bali based on remote sensing is carried out with several stages, namely loading test images, composite image processes, NDVI and NDWI calculation processes, NDDI calculation processes, and analysis of drought area areas. The first stage required in the application is the process of cropping carried out on the loaded image to determine the area under study. Image composite process to obtain true color and false color. The NDVI calculation process is carried out to get the value of vegetation density, and the NDWI calculation process to get the value of vegetation wetness. The next process carried out the NDDI process to identify drought areas in East Bali. The cropping process gained a total area of 213,838.64 hectares in each of the old images and new images. The results of calculations on the old image drought data contained 9,919.17 hectares of Very Dry, 4,725.45 hectares of Dry, 12,619.98 hectares of Light Dry, 81,381.78 hectares of Normal, and 106,192.26 hectares of non-classification. The new image drought data shows there are 6,315.39 hectares of Very Dry, 23,348.52 hectares of Dry, 28,480.5 hectares of Light Dry, 50,325.48 hectares of Normal, and 106,368.75 hectares of Non-Classification. Changes in data that occur from the old image with the new image are -3,603.78 hectares Very Dry 18,623.07 hectares Dry, 15,860.52 hectares Lightly Dry, -31,056.3 hectares Normal, and 176.49 hectares for non-classification.
Reference
-
[1] A. Nertan, G. Stancalie, and F. Serban, “Agricultural Drought Monitoring Using Satellite -
Based Products in Romania,” no. Ictrs, pp. 100–106, 2014.
-
[2] L. F. Amalo, U. Ma’Rufah, and P. A. Permatasari, “Monitoring 2015 drought in West Java
using Normalized Difference Water Index (NDWI),” IOP Conf. Ser. Earth Environ. Sci., vol. 149, no. 1, 2018.
-
[3] F. Rahman, A. Sukmono, and B. D. Yuwono, “ANALISIS KEKERINGAN PADA LAHAN
PERTANIAN MENGGUNAKAN METODE NDDI DAN PERKA BNPB NOMOR 02 TAHUN 2012 (Studi Kasus : Kabupaten Kendal Tahun 2015),” J. Geod. Undip, vol. 6, no. 4, pp. 274–284, 2017.
-
[4] J. Serrano, S. Shahidian, and J. M. da Silva, “Evaluation of normalized difference water
index as a tool for monitoring pasture seasonal and inter-annual variability in a Mediterranean agro-silvo-pastoral system,” Water (Switzerland), vol. 11, no. 1, 2019.
-
[5] T. M. Octarina, I. D. Nyoman, N. Putra, N. Kadek, and A. Wirdiani, “Penginderaan Jauh
Pemrosesan Data Satelit Landsat 8 untuk Deteksi Genangan,” J. Ilm. Merpati Univ. Udayana, vol. 7, no. 1, pp. 77–85, 2019.
-
[6] A. Gulácsi and F. Kovács, “Drought monitoring of forest vegetation using MODIS-based
normalized difference drought index in Hungary,” Hungarian Geogr. Bull., vol. 67, no. 1, pp. 29–42, 2018.
-
[7] T. D. Acharya and I. Yang, “Exploring Landsat 8,” Int. J. IT, Eng. Appl. Sci. Res., vol. 4,
no. 4, pp. 4–10, 2015.
-
[8] I. P. W. Sanjaya Putra, I. K. G. Darma Putra, I. P. A. Bayupati, A. A. K. Oka Sudana, I.
-
D. N. Nurweda Putra, and N. K. D. Rusjayanthi, “Application of Mangrove Forest Coverage Detection In Ngurah Rai Grand Forest Park Using Ndvi Transformation Method,” J. Theor. Appl. Inf. Technol., vol. 80, no. 3, pp. 521–527, 2015.
-
[9] V. L. Sihombing, I. D. Nyoman, N. Putra, G. Made, and A. Sasmita, “Aplikasi Deteksi
Tumpahan Minyak dengan Interpretasi Citra Satelit Landsat 8,” J. Ilm. Merpati Univ. Udayana, vol. 6, no. 3, pp. 244–251, 2018.
-
[10] S. Rahayu, I. N. Piarsa, and P. W. Buana, “Sistem Informasi Geografis Pemetaan
Daerah Aliran Sungai Berbasis Web,” Lontar Komput. J. Ilm. Teknol. Inf., vol. 7, no. 2, p. 71, 2016.
-
[11] K. G. Kurniadi, I. P. A. Bayupati, and I. D. N. N. Putra, “Aplikasi Penghitungan Gross Primary Production dari Data Penginderaan Jauh,” Lontar Komput. J. Ilm. Teknol. Inf., vol. 7, no. 1, p. 31, 2017.
-
[12] S. H. Kusumo, N. Kadek, A. Wirdiani, I. G. Made, and A. Sasmita, “Aplikasi Analisa Perubahan Penggunaan Lahan di Provinsi Bali,” J. Ilm. Merpati Univ. Udayana, vol. 4, no. 3, pp. 225–236, 2016.
Implementation Drought Area Identifier Application Of East Bali
Based On Remote Sensing (Ngurah Padang Adnyana)
53
Discussion and feedback