Forecasting New Student Candidates Using the Random Forest Method
on
LONTAR KOMPUTER VOL. 11, NO. 1 APRIL 2020
DOI : 10.24843/LKJITI.2020.v11.i01.p05
Accredited B by RISTEKDIKTI Decree No. 51/E/KPT/2017
p-ISSN 2088-1541
e-ISSN 2541-5832
Forecasting New Student Candidates Using the Random Forest Method
Rahmat Robi Waliyansyaha1, Nugroho Dwi Saputroa2
aInformatics, Universitas PGRI Semarang
Jl. Sidodadi Timur No.24, Dr. Cipto, Semarang
1)rahmat.robi.waliyansyah@upgris.ac.id
Abstract
College education institutions regularly hold new student admissions activities, and the number of new students can increase and can also decrease. University of PGRI Semarang (UPGRIS) on the development of new student admissions for the 2014/2015 academic year up to 2018/2019 with so many admissions selection stages. To meet the minimum comparison requirements between the number of students with the development of human resources, facilities, and infrastructure, it is necessary to predict how much the number of students increases each year. To make a prediction system or forecasting, the number of prospective new students required a good forecasting method and sufficiently precise calculations to predict the number of prospective students who register. In this study, the method to be taken is the Random Forest method. For the evaluation of forecasting models used Random Sampling and Cross-validation. The parameter used is Mean Absolute Error (MAE), Mean Squared Error (MSE), Root Mean Squared Error (RMSE), and Coefficient of Determination (R2). The results of this study obtained the five highest and lowest study programs in the admission of new students. Therefore, UPGRIS will make a new strategy for the five lowest study programs so that the desired number of new students is achieved.
Keywords: Random Forest, Forecasting, Admission of new students, Promotion Strategy
quota in each department or faculty has been determined and the population level of people is different.
Several studies related to the prediction of the number of prospective students include artificial neural networks with a backpropagation method to predict the number of new students. The results of this study indicate that backpropagation has a good level of accuracy in the predictions of new students with a 5-1 neuron structure with 1 (one) hidden layer, learning rate (lr) used 0.1, and MSE value 0.001 [4]. Furthermore, related to the prediction of the number of prospective new students using fuzzy time series-time invariant. Based on this study, the results of the prediction obtained by using three intervals six comparisons with the MAE value of the prediction error of 0.54, interval 9 with the MAE value, the prediction error was 0.32 and interval 12 with the MAE value of the prediction error of 0.29 [5]. From some of these studies, results obtained are good, but researchers conducted a different approach using Random Forest because that method can be used for incomplete attributes & can be applied to a large sample.
Some related studies that use the Random Forest Method are Assessment of the relationship of environmental factors with populations with different genetics using the Random Forest Method. The object used is Mytilus sea shells. The results obtained from novel machine learning can show the relationship of environmental factors with populations with different genetic functions [6] classification of medical data using the Random Forest Method. The results obtained from the experiment were able to produce good predictions of 10 diseases [7]. Use of the Random Forest Method in the analysis of genetic data. The results obtained are that the Random Forest Method is not only good for analysis but also good for prediction and classification, variable selection, path analysis, genetic association and epistasis detection, and unsupervised learning [8]. They are determining the location of Malonation using the Random Forest approach. LAMP is a development of LSTM and Random Forest. Overall, LEMP is very good at identifying the location of Malonation [9]. Random Forest and Stochastic Gradient approach to predict noise levels in car body design. The parameters used in building the model are using cross-validation and repeated ten times in the dataset. The built model shows better accuracy results than the previous model [10]. Use of the Random Forest Method in predicting air pollution. The data used comes from the Central Pollution Control Board for two cities (Delhi and Patna). The seven parameters used are C6H6, NO2, O3, SO2, CO, PM2.5, and PM10. The prediction results obtained are far better than before [11]. Predict protein structure using the Random Forest approach. The results of this study are compared with the AMIDE dataset, which shows good results [12]. Detection of DNS DDoS attacks using the Forest Random Algorithm. In this study, the level of detection accuracy reached 99.2% [13]. Investigate the use of software with the Random Forest detector. The evaluation process was done by Random Sampling with training data as much as 70%. The dataset used in this study is ISBSG R8, Tukutuku, and COCOMO. The results obtained in the evaluation were that Random Forest outperformed Regression Trees on all criteria [14]. Use of the Random Forest Method in predicting Alzheimer's disease. The dataset used is ADNI (AD / HC) The results obtained in this study are the sensitivity of the dataset in predicting an increase of 79.5% / 75% to 83.3% / 81.3% [15]. The Random Forest algorithm is used to predict rainfall. Random forest accuracy using the 10-fold cross validation technique is 71.09% while the technique uses all data at 99.45%. The level of accuracy generated from the use of the technique of all data as training data and testing data is a substitution estimate, where the estimated results are often very good which is useful for diagnostic purposes [16].
To make a prediction system or forecasting, the number of prospective new students required a good forecasting method and sufficiently precise calculations to predict the number of prospective students who register. In this study, the method to be taken is the Random Forest method.
Prediction of prospective new students at PGRI University Semarang by using five stages. These stages are (1) problem analysis; (2) data collection; (3) data processing; (4) random forest implementation; (5) analysis phase. The research method carried out in this study can be seen in Figure 1.

Figure 1. Research Method Flowchart
The analysis is done so that it can be a reference for making a system that will be made, namely, forecasting the number of prospective students who register. At this time, UPGRIS does not yet have a system for forecasting the number of prospective student applicants, so there are problems that occur because the university does not have a forecasting system, as explained in the previous background. To find out the forecasting of the number of prospective new students who register for the following year, then a forecasting application design system is created for the number of prospective students who register using the Random Forest method.
The data used is the data on the number of new student registrants is the new UPGRIS student data for the 2014/2015 academic year up to 2018/2019. UPGRIS has eight faculties and 23 study programs. From the data obtained, not all new students registered, do a re-registration. That are various reasons, for example, accepted at state universities, not enough money, being a police or army officer, etc. The data used in this study can be seen in Table 1.
Table 1. Data on the Number of New Students at the University of PGRI Semarang Year Study Program Registrant New students
|
2018 |
BK |
259 |
144 |
|
2018 |
PGSD |
735 |
323 |
|
2018 |
PAUD |
46 |
162 |
|
2018 |
PPKn |
66 |
34 |
|
2018 |
MTK |
241 |
133 |
|
2018 |
Biologi |
110 |
54 |
|
2018 |
FIS |
43 |
24 |
|
2018 |
PBSI |
264 |
158 |
|
2018 |
PBI |
259 |
147 |
|
2018 |
PBJ |
44 |
28 |
|
2018 |
MP |
98 |
74 |
|
2018 |
PTI |
57 |
29 |
|
2018 |
Ekonomi |
93 |
50 |
|
2018 |
PB |
24 |
11 |
|
2018 |
PJKR |
499 |
315 |
|
2018 |
T-Sipil |
122 |
69 |
|
2018 |
T-Mesin |
190 |
116 |
|
2018 |
T-Elektro |
31 |
17 |
|
2018 |
Informatika |
132 |
95 |
|
2018 |
T-Pangan |
59 |
32 |
|
2018 |
Arsitektur |
60 |
40 |
|
2018 |
Hukum |
99 |
49 |
|
2018 |
Manajemen |
314 |
195 |
|
2017 |
BK |
250 |
158 |
|
2017 |
PGSD |
780 |
407 |
|
2017 |
PAUD |
77 |
55 |
|
2017 |
PPKn |
87 |
48 |
|
2017 |
MTK |
259 |
175 |
|
2017 |
Biologi |
164 |
109 |
|
2017 |
FIS |
49 |
32 |
|
2017 |
PBSI |
249 |
183 |
|
2017 |
PBI |
272 |
178 |
|
2017 |
PBJ |
49 |
19 |
|
Year |
Study Program |
Registrant |
New students |
|
2017 |
MP |
169 |
116 |
|
2017 |
PTI |
73 |
42 |
|
2017 |
Ekonomi |
121 |
93 |
|
2017 |
PB |
45 |
21 |
|
2017 |
PJKR |
488 |
308 |
|
2017 |
T-Sipil |
96 |
68 |
|
2017 |
T-Mesin |
167 |
125 |
|
2017 |
T-Elektro |
34 |
14 |
|
2017 |
Informatika |
111 |
71 |
|
2017 |
T-Pangan |
47 |
26 |
|
2017 |
Arsitektur |
50 |
21 |
|
2017 |
Hukum |
66 |
40 |
|
2017 |
Manajemen |
276 |
177 |
|
2016 |
BK |
289 |
135 |
|
2016 |
PGSD |
1076 |
491 |
|
2016 |
PAUD |
109 |
63 |
|
2016 |
PPKn |
68 |
36 |
|
2016 |
MTK |
385 |
194 |
|
2016 |
Biologi |
191 |
97 |
|
2016 |
FIS |
71 |
33 |
|
2016 |
PBSI |
305 |
179 |
|
2016 |
PBI |
359 |
179 |
|
2016 |
PBJ |
48 |
27 |
|
2016 |
MP |
191 |
130 |
|
2016 |
PTI |
77 |
48 |
|
2016 |
Ekonomi |
204 |
101 |
|
2016 |
PB |
56 |
20 |
|
2016 |
PJKR |
557 |
320 |
|
2016 |
T-Sipil |
154 |
77 |
|
2016 |
T-Mesin |
188 |
112 |
|
2016 |
T-Elektro |
47 |
13 |
|
2016 |
Informatika |
181 |
99 |
|
2016 |
T-Pangan |
62 |
24 |
|
2016 |
Arsitektur |
66 |
25 |
|
2016 |
Hukum |
62 |
27 |
|
2016 |
Manajemen |
203 |
91 |
|
2015 |
BK |
292 |
157 |
|
2015 |
PGSD |
1499 |
497 |
|
2015 |
PAUD |
106 |
72 |
|
2015 |
PPKn |
83 |
61 |
|
2015 |
MTK |
350 |
195 |
|
2015 |
Biologi |
230 |
135 |
|
2015 |
FIS |
90 |
53 |
|
2015 |
PBSI |
439 |
275 |
|
2015 |
PBI |
364 |
197 |
|
2015 |
PBJ |
41 |
25 |
|
2015 |
MP |
56 |
0 |
|
2015 |
PTI |
70 |
44 |
|
2015 |
Ekonomi |
302 |
166 |
|
2015 |
PB |
13 |
0 |
|
2015 |
PJKR |
554 |
308 |
|
2015 |
T-Sipil |
147 |
69 |
|
2015 |
T-Mesin |
192 |
122 |
|
2015 |
T-Elektro |
41 |
20 |
|
2015 |
Informatika |
131 |
69 |
|
2015 |
T-Pangan |
52 |
28 |
|
2015 |
Arsitektur |
70 |
29 |
|
Year |
Study Program |
Registrant |
New students |
|
2015 |
Hukum |
0 |
0 |
|
2015 |
Manajemen |
0 |
0 |
|
2014 |
BK |
492 |
173 |
|
2014 |
PGSD |
2572 |
501 |
|
2014 |
PAUD |
161 |
77 |
|
2014 |
PPKn |
137 |
59 |
|
2014 |
MTK |
622 |
226 |
|
2014 |
Biologi |
330 |
132 |
|
2014 |
FIS |
202 |
77 |
|
2014 |
PBSI |
559 |
213 |
|
2014 |
PBI |
515 |
169 |
|
2014 |
PBJ |
50 |
7 |
|
2014 |
MP |
0 |
0 |
|
2014 |
PTI |
106 |
44 |
|
2014 |
Ekonomi |
368 |
131 |
|
2014 |
PB |
0 |
0 |
|
2014 |
PJKR |
648 |
230 |
|
2014 |
T-Sipil |
143 |
41 |
|
2014 |
T-Mesin |
251 |
90 |
|
2014 |
T-Elektro |
83 |
21 |
|
2014 |
Informatika |
133 |
43 |
|
2014 |
T-Pangan |
66 |
22 |
|
2014 |
Arsitektur |
45 |
14 |
|
2014 |
Hukum |
0 |
0 |
|
2014 |
Manajemen |
0 |
0 |
Data from this study were taken at the UPGRIS Information and Technology Development Agency in May 2019. The data is a recapitulation of the number of new students applying to UPGRIS to become new students, namely from 2014 to 2018. Figure 2 is explained that the amount of data used is 37,648 with details: 115 lines and three attributes used (Study Program, Registrant & Year of applicants), and the target used is New Students. Figure 3 explains the amount of training data used by 70% of 115 rows contained in the dataset.
D File — □ X
® File: PMB 2014-2018.x⅛x v [ ... 0 Reload
O URL: I v∣
Infb 115 instance (s)
-
4 feature(s) (no missing values) Data has no target variable. 0 meta attribute(s)
Columns (Double dick to edit) Name Type Role
Values
-
1 Year O numeric feature
Arsitektur, BK, Biologi, Ekonomi, FIS, Hukum, Informatika, MP, MTK, Manajemen, PAUD, P...
-
^ Study Program S categorical feature
-
3 Registrant GJ numeric feature
-
4 New Students d numeric target
Figure 2. Data Type used

Figure 3. Sample Data
Random forest is one method used for classification and regression. This method is an ensemble of learning methods using a decision tree as a base classifier that is built and combined [17]. There are three important aspects in the Random Forest method, which are: (1) do bootstrap sampling to build predictive trees; (2) each decision tree predicts a random predictor; (3) then the forest random predicts by combining the results of each decision tree by means of a majority vote for classification or the average for regression.
The process of combining the estimated values of many trees is similar to that done in the bagging method. Note that every time the tree is formed, the explanatory change candidate used to do the separation is not all the change involved, but only a portion of the election results are random. This process produces a single tree with different sizes and shapes. The expected result is that a single tree collection has a small correlation between the trees. This small correlation results in a small variety of randomized results [18] and smaller than the alleged variety of bagging results [19].
Further [19] explain that in Breiman [20] it has been proven that the limit of the magnitude of the prediction error by Random Forest is :
εRF ≤ ̅ (⅛) (1)
Where ̅ is the average correlation between pairs the conjecture of two single trees and s is average strength measurement for tree accuracy single. The greater s value indicates that the prediction accuracy is getting better. If you want to have a good Random Forest, then many single trees must be obtained with ̅ smaller and s bigger.
In Figure 4, information is provided regarding the steps to implement the Random Forest algorithm to predict the number of new students. The first step is to input data from the data transformation, which consists of explanatory attributes and target attributes. After that, the data is divided into two types (training data and testing data) with a percentage of 70% and 30%. In addition, the determination of training and testing data was also carried out using 95% training data. Later results will be compared between the two types of methods for determining the training data and testing the data. The Random Forest algorithm in this study uses 100 decision
trees that are randomly generated. Training data is used as input data for the Random Forest algorithm, while testing data is used to test or evaluate the output or model generated from the Random Forest algorithm.
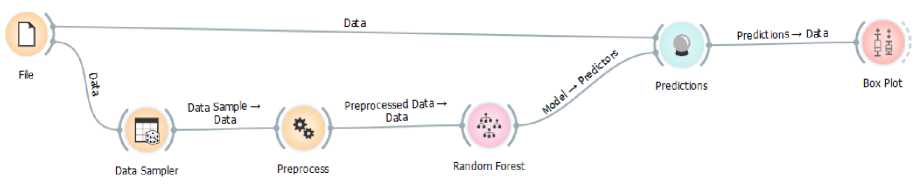
Figure 4. Random Forest Implementation
Evaluation of the performance of Random Forest is done by using several measurement parameters, namely, Mean Squared Error (MSE), Root Mean Squared Error (RMSE), Mean Absolute Error (MAE), and Determination Coefficient (R2). Accuracy is the most common and simple parameter for evaluating the performance of predictive algorithms, namely by showing the level or percentage of predictive truth. MAE shows how many prediction deviations from the truth. RMSE is referred to as a brier score that measures related prediction deviations from the truth. MSE is very good at providing an overview of how consistently the model is built. R2 is useful for predicting and seeing how much the influence of variables given simultaneously. The Random Forest performance evaluation is shown in Figure 5.
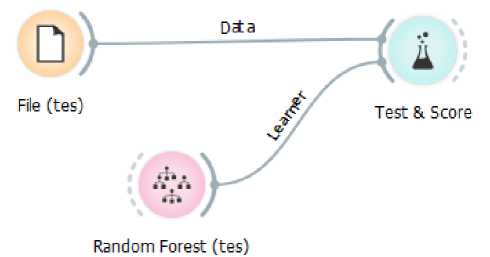
Figure 5. Random Forest Performance Evaluation
The forecasting models carried out are then validated using a number of indicators (MSE, RMSE, MAE & R2).
Mean Absolute Error is a measure of the difference between two continuous variables. Assume X and Y are paired observation variables that express the same phenomenon. Mathematically MAE is defined as follows :
(2)
MAE = ∑ i=n | fl - yt
Where fi is the value of the forecast, Vi is the true value, and n is the amount of data. Based on formula 2, MAE intuitively calculates the average error by giving equal weight to all data ( =
1.....n).
Mean Squared Error (MSE) is another method for evaluating forecasting methods. Each error or remainder is squared. Then added up and added to the number of observations. This approach regulates large forecasting errors because they are squared. The method produces moderate errors, which are probably better for small errors, but sometimes make a big difference. Mathematically MSE is defined as follows :
MSE = ∑ ⅛ =∑(*i f i )-
(3)
Based on formula 3, MSE gives greater weight compared to MAE, which is the quadratic value of error. As a consequence, small error value will be smaller and large error will be greater.
Root Mean Squared Error (RMSE) is an alternative method for evaluating forecasting techniques that are used to measure the accuracy of the forecast results of a model. RMSE is the average value of the number of squared errors. It can also state the size of the error produced by an approximate model. The low RMSE value indicates that the variation in the value produced by an approximate model is close to the variation in the value of its observations. Mathematically RMSE is defined as follows :
RMSE = ∑l=i ^i -⏞D (4)
Based on formula 4, y is the value of observations, ⏞ is predictive value, j is a sequence of data in the database, and n is the amount of data.
The coefficient of determination (R2) is often interpreted as how much the ability of all independent variables to explain the variance of the dependent variable. In general, R2 for cross-data is relatively low because of the large variations between each observation, while data for time series data usually has a higher coefficient of determination. In simple terms, the coefficient of determination is calculated by squaring the Correlation Coefficient (R). Mathematically R2 is defined as follows:
R2 = × 100% (5)
Coefficient of determination with symbol r2 is the proportion of variability in a calculated data based on a statistical model. Another interpretation that r2 is defined as the proportion of variation responses by the regressor (independent variable / X) in the model. Thus, if r2 = 1 it will mean that the corresponding model explains all the variability in the Y variable. If r2 = 0 will mean that there is no relationship between the regressor (X) and the Y variable.
In the analysis phase, an analysis of the model produced in connection with a case study predicts the number of new students applying to UPGRIS. In addition, the results of testing based on testing parameters were also analyzed to determine the quality of the model produced.
Figure 6 is a presentation of the evaluation of output from a random forest algorithm with data sharing techniques using 70% random sampling of data and iterations 100 times.
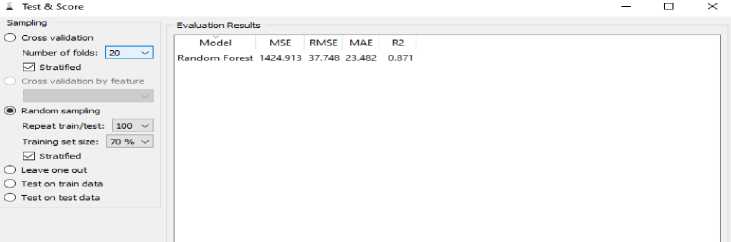
Figure 6. Evaluation of Random Forest Performance on Model Results from Random Sampling 70%
a Test & Score
Sampling
-
@ Cross validation
Number of folds: ∣20 v] 0 Stratified
O Cross validation by feature
^^H
O Random sampling
Repeat train/test: 100 v
Training set size: 70 ⅝ v ∣ 0 Stratified
O Leave one out
O Test on train data
O Test on test data
□
Evaluation Results
Model MSE RMSE MAE RZ
Random Forest 874.127 29.566 18.985 0.921
Figure 7. Evaluation of Random Forest Performance on Model Results from Cross-Validation
Figure 7 is the result of an evaluation of the model produced by the random forest algorithm with Cross-Validation.
Based on the results of the evaluation of the resulting model, it can be analyzed that the random forest implementation uses 70% for training data. If seen from MSE, RMSE, MAE, and R2. Random forest accuracy uses random sampling technique for MSE = 1424.913, RMSE =
-
37.748, MAE = 23.482 and R2 = 0.871 then results random forest evaluation use crossvalidation, if seen from MSE, RMSE, MAE and R2. Random forest accuracy uses random sampling technique for MSE = 874.127, RMSE = 29.566, MAE = 18.985 and R2 = 0.921. Forecasting results using the Random Forest Method are shown in Table 2.
Table 2. The Results of Forecasting the Number of New Students with Random Forest
|
New Students |
Random Forest |
Year |
Study Program |
Registrant |
|
144 |
148.295 |
2018 |
BK |
259 |
|
323 |
355.117 |
2018 |
PGSD |
735 |
|
162 |
24.960 |
2018 |
PAUD |
46 |
|
34 |
28.554 |
2018 |
PPKn |
66 |
|
133 |
139.277 |
2018 |
MTK |
241 |
|
54 |
59.359 |
2018 |
Biologi |
110 |
|
24 |
24.378 |
2018 |
FIS |
43 |
|
158 |
160.948 |
2018 |
PBSI |
264 |
|
147 |
155.691 |
2018 |
PBI |
259 |
|
28 |
25.474 |
2018 |
PBJ |
44 |
|
74 |
56.391 |
2018 |
MP |
98 |
|
29 |
33.309 |
2018 |
PTI |
57 |
|
50 |
54.821 |
2018 |
Ekonomi |
93 |
|
11 |
15.457 |
2018 |
PB |
24 |
|
315 |
303.180 |
2018 |
PJKR |
499 |
|
69 |
74.829 |
2018 |
T-Sipil |
122 |
|
116 |
117.175 |
2018 |
T-Mesin |
190 |
|
17 |
15.105 |
2018 |
T-Elektro |
31 |
|
95 |
81.079 |
2018 |
Informatika |
132 |
|
32 |
26.223 |
2018 |
T-Pangan |
59 |
|
40 |
26.476 |
2018 |
Arsitektur |
60 |
|
49 |
56.947 |
2018 |
Hukum |
99 |
|
195 |
182.278 |
2018 |
Manajemen |
314 |
|
158 |
142.247 |
2017 |
BK |
250 |
|
407 |
417.175 |
2017 |
PGSD |
780 |
|
55 |
49.823 |
2017 |
PAUD |
77 |
|
48 |
56.533 |
2017 |
PPKn |
87 |
|
LONTAR KOMPUTER VOL. 11, NO. 1 APRIL 2020 DOI : 10.24843/LKJITI.2020.v11.i01.p05 Accredited B by RISTEKDIKTI Decree No. 51/E/KPT/2017 |
p-ISSN 2088-1541 e-ISSN 2541-5832 | |||
|
New Students |
Random Forest |
Year |
Study Program |
Registrant |
|
175 |
168.138 |
2017 |
MTK |
259 |
|
109 |
100.942 |
2017 |
Biologi |
164 |
|
32 |
25.181 |
2017 |
FIS |
49 |
|
183 |
163.855 |
2017 |
PBSI |
249 |
|
178 |
167.764 |
2017 |
PBI |
272 |
|
19 |
25.749 |
2017 |
PBJ |
49 |
|
116 |
113.646 |
2017 |
MP |
169 |
|
42 |
41.914 |
2017 |
PTI |
73 |
|
93 |
82.053 |
2017 |
Ekonomi |
121 |
|
21 |
22.338 |
2017 |
PB |
45 |
|
308 |
295.671 |
2017 |
PJKR |
488 |
|
68 |
62.258 |
2017 |
T-Sipil |
96 |
|
125 |
110.830 |
2017 |
T-Mesin |
167 |
|
14 |
15.376 |
2017 |
T-Elektro |
34 |
|
71 |
70.335 |
2017 |
Informatika |
111 |
|
26 |
25.163 |
2017 |
T-Pangan |
47 |
|
21 |
25.370 |
2017 |
Arsitektur |
50 |
|
40 |
53.600 |
2017 |
Hukum |
66 |
|
177 |
167.875 |
2017 |
Manajemen |
276 |
|
135 |
153.314 |
2016 |
BK |
289 |
|
491 |
457.772 |
2016 |
PGSD |
1076 |
|
63 |
64.438 |
2016 |
PAUD |
109 |
|
36 |
29.092 |
2016 |
PPKn |
68 |
|
194 |
185.185 |
2016 |
MTK |
385 |
|
97 |
115.228 |
2016 |
Biologi |
191 |
|
33 |
33.354 |
2016 |
FIS |
71 |
|
179 |
180.793 |
2016 |
PBSI |
305 |
|
179 |
185.774 |
2016 |
PBI |
359 |
|
27 |
25.565 |
2016 |
PBJ |
48 |
|
130 |
119.624 |
2016 |
MP |
191 |
|
48 |
51.128 |
2016 |
PTI |
77 |
|
101 |
108.596 |
2016 |
Ekonomi |
204 |
|
20 |
23.304 |
2016 |
PB |
56 |
|
320 |
310.339 |
2016 |
PJKR |
557 |
|
77 |
77.728 |
2016 |
T-Sipil |
154 |
|
112 |
115.691 |
2016 |
T-Mesin |
188 |
|
13 |
18.272 |
2016 |
T-Elektro |
47 |
|
99 |
107.120 |
2016 |
Informatika |
181 |
|
24 |
26.083 |
2016 |
T-Pangan |
62 |
|
25 |
27.995 |
2016 |
Arsitektur |
66 |
|
27 |
54.022 |
2016 |
Hukum |
62 |
|
91 |
111.642 |
2016 |
Manajemen |
203 |
|
157 |
154.161 |
2015 |
BK |
292 |
|
497 |
463.477 |
2015 |
PGSD |
1499 |
|
72 |
63.870 |
2015 |
PAUD |
106 |
|
61 |
56.687 |
2015 |
PPKn |
83 |
|
195 |
188.799 |
2015 |
MTK |
350 |
|
135 |
132.376 |
2015 |
Biologi |
230 |
|
53 |
56.373 |
2015 |
FIS |
90 |
|
275 |
262.299 |
2015 |
PBSI |
439 |
|
197 |
185.603 |
2015 |
PBI |
364 |
|
25 |
24.110 |
2015 |
PBJ |
41 |
|
0 |
25.237 |
2015 |
MP |
56 |
|
44 |
39.433 |
2015 |
PTI |
70 |
|
166 |
164.016 |
2015 |
Ekonomi |
302 |
|
0 |
9.322 |
2015 |
PB |
13 |
|
308 |
307.548 |
2015 |
PJKR |
554 |
|
LONTAR KOMPUTER VOL. 11, NO. 1 APRIL 2020 DOI : 10.24843/LKJITI.2020.v11.i01.p05 Accredited B by RISTEKDIKTI Decree No. 51/E/KPT/2017 |
p-ISSN 2088-1541 e-ISSN 2541-5832 | |||
|
New Students |
Random Forest |
Year |
Study Program |
Registrant |
|
69 |
75.773 |
2015 |
T-Sipil |
147 |
|
122 |
116.110 |
2015 |
T-Mesin |
192 |
|
20 |
17.651 |
2015 |
T-Elektro |
41 |
|
69 |
75.619 |
2015 |
Informatika |
131 |
|
28 |
26.218 |
2015 |
T-Pangan |
52 |
|
29 |
33.116 |
2015 |
Arsitektur |
70 |
|
83 |
59.507 |
2015 |
Hukum |
0 |
|
0 |
18.088 |
2015 |
Manajemen |
0 |
|
173 |
208.222 |
2014 |
BK |
492 |
|
501 |
463.046 |
2014 |
PGSD |
2572 |
|
77 |
82.459 |
2014 |
PAUD |
161 |
|
59 |
75.657 |
2014 |
PPKn |
137 |
|
226 |
238.067 |
2014 |
MTK |
622 |
|
132 |
168.270 |
2014 |
Biologi |
330 |
|
77 |
92.868 |
2014 |
FIS |
202 |
|
213 |
242.909 |
2014 |
PBSI |
559 |
|
169 |
209.330 |
2014 |
PBI |
515 |
|
7 |
15.701 |
2014 |
PBJ |
50 |
|
0 |
12.772 |
2014 |
MP |
0 |
|
44 |
62.214 |
2014 |
PTI |
106 |
|
131 |
154.416 |
2014 |
Ekonomi |
368 |
|
0 |
12.654 |
2014 |
PB |
0 |
|
230 |
256.458 |
2014 |
PJKR |
648 |
|
41 |
75.027 |
2014 |
T-Sipil |
143 |
|
90 |
115.037 |
2014 |
T-Mesin |
251 |
|
21 |
55.027 |
2014 |
T-Elektro |
83 |
|
43 |
77.268 |
2014 |
Informatika |
133 |
|
22 |
19.932 |
2014 |
T-Pangan |
66 |
|
14 |
15.618 |
2014 |
Arsitektur |
45 |
|
89 |
58.161 |
2014 |
Hukum |
0 |
|
0 |
14.088 |
2014 |
Manajemen |
0 |
The results of testing using Random Forest obtained 5 study programs with a significant increase in the number of new students and 5 study programs with the lowest number of new students. Study Program with an increase in the number of students, which are: Management Study Program (75%), PBSI / Indonesian Language and Literature Study Program (52%), Mathematics Education (50%), Economic Education (46%), MP / Masters in Education Management (43%). Five study programs with the lowest number of new students, which are: Master of Education and Indonesian Language (2.6%), Law (2.7%), Early Childhood Education (PAUD) (3.4%), Food Technology (3,7%), Javanese Language and Literature Education / PBJ (4.5%). Therefore, UPGRIS will focus more on the five lowest study programs in accepting new students to make a promotion strategy that is more effective and efficient, so that it is expected to get the number of new students according to the target set.
Forecasting is forecasting or estimation of something that has not happened. Forecasts carried out, in general, will be based on data contained in the past that are analyzed using certain methods. Forecasting is attempted to be made to minimize the influence of uncertainty, in other words aiming to get a forecast that can minimize forecast errors that are usually measured by MAE, MSE, RMSE, and R2. Forecasting is a very important tool in effective and efficient planning.
Demand forecasting has certain characteristics that apply in general. These characteristics must be considered to assess the results of a demand forecasting process and the forecasting method used. Forecasting characteristics, namely the causal factors that apply in the past, are assumed to be valid in the future, and forecasting is never perfect, actual demand is always different from the forecast demand. The use of various forecasting models will provide different forecast values and degrees of different forecast errors. The art of forecasting is to choose the best forecasting model that is able to identify and respond to historical activity patterns from the
data. For the evaluation of forecasting models, MAE is more intuitive in providing error averages for all data. Whereas MSE is very sensitive to outliers. Because the square value is calculated, the outlier error will be given a very large weight and make the MSE value even greater. MSE is very good at providing an overview of how consistently the model is built. By minimizing the value of MSE, it means minimizing model variants. Models that have small variants can provide relatively more consistent results for all input data compared to models with large variants. RMSE is a more intuitive alternative than MSE because it has the same measurement scale as the data being evaluated. For example, twice the value of RMSE means that the model has twice the error than before. Whereas twice the value of MSE does not mean that. If MSE is analogous to a variant, then RMSE can be analogous to the standard deviation.
The amount of this R2 ranges between 0-1. The smaller the value of R2, then the effect of the independent variable (x) on the dependent variable (y) is getting weaker. Conversely, if the value of R2 gets closer to number 1, then the effect will be stronger.
For the evaluation of forecasting models, MAE is more intuitive in giving the average error of the entire data, whereas MSE is very sensitive to outliers. Because the square value is calculated, the outlier error will be given a very large weight and make the MSE value even greater. RMSE is a more intuitive alternative than MSE because it has the same measurement scale as the data being evaluated. The fundamental weakness of R2 is the blank towards the number of independent variables, and then the R2 value must increase no matter whether the variable affects the dependent variable or not. Therefore it is recommended to use the "adjusted R2" value when evaluating the model.
From the results of forecasting new students using Random Forest, the highest and lowest 5 study programs were obtained in the admission of new students. Therefore, UPGRIS will make a new strategy for the five lowest study programs so that the desired number of new students is achieved.
References
-
[1] A. Purba, “Perancangan Aplikasi Peramalan Jumlah Calon Mahasiswa Baru yang mendaftar menggunakan Metode Single Exponential Smoothing (Studi Kasus: Fakultas Agama Islam UISU),” Jurnal Riset Komputer, vol. 2, no. 6, pp. 8–12, 2015.
-
[2] M. Irfan, L. P. Ayuningtias, and J. Jumadi, “Analisa Perbandingan Logic Fuzzy Metode Tsukamoto, Sugeno, Dan Mamdani (Studi Kasus: Prediksi Jumlah Pendaftar Mahasiswa Baru Fakultas Sains Dan Teknologi Uin Sunan Gunung Djati Bandung),” Jurnal Teknik Informatika, vol. 10, no. 1, pp. 9–16, 2018.
-
[3] A. S. Ritonga and S. Atmojo, “Pengembangan Model Jaringan Syaraf Tiruan untuk Memprediksi Jumlah Mahasiswa Baru di PTS Surabaya (Studi Kasus Universitas Wijaya Putra),” Jurnal Ilmiah Teknologi Informasi Asia, vol. 12, no. 1, p. 15, 2018.
-
[4] L. Nurhani, A. Gunaryati, S. Andryana, and I. Fitri, “Jaringan Syaraf Tiruan Dengan Metode Backpropagation,” in Seminar Nasional Teknologi Informasi dan Multimedia, 2018, pp. 25– 30.
-
[5] S. Karmita, A. Bramanto, O. Gaffar, and A. S. Wiguna, “Prediksi Jumlah Calon Mahasiswa Baru Menggunakan Fuzzy Time Series-Time Invariant,” in Prosiding Seminar Ilmu Komputer dan Teknologi Informasi, 2018, vol. 3, no. 1, pp. 208–214.
-
[6] T. Kijewski et al., “Random forest assessment of correlation between environmental factors and genetic differentiation of populations: Case of marine mussels Mytilus,” Oceanologia, vol. 61, no. 1, pp. 131–142, 2019.
-
[7] M. Z. Alam, M. S. Rahman, and M. S. Rahman, “A Random Forest based predictor for medical data classification using feature ranking,” Informatics in Medicine Unlocked, vol. 15, no. January, pp. 1–12, 2019.
-
[8] X. Chen and H. Ishwaran, “Random forests for genomic data analysis,” Genomics, vol. 99, no. 6, pp. 323–329, 2012.
-
[9] Z. Chen, N. He, Y. Huang, W. T. Qin, X. Liu, and L. Li, “Integration of A Deep Learning Classifier with A Random Forest Approach for Predicting Malonylation Sites,” Genomics, Proteomics Bioinforma., vol. 16, no. 6, pp. 451–459, 2018.
-
[10] A. Patri and Y. Patnaik, “Random forest and stochastic gradient tree boosting based approach for the prediction of airfoil self-noise,” in International Conference on Information and Communication Technologies (ICICT 2014), 2015, vol. 46, pp. 109–121.
-
[11] Rubal and D. Kumar, “Evolving Differential evolution method with random forest for prediction of Air Pollution,” in International Conference on Computational Intelligence and Data Science (ICCIDS 2018), 2018, vol. 132, pp. 824–833.
-
[12] C. Kathuria, D. Mehrotra, and N. K. Misra, “Predicting the protein structure using random forest approach,” in International Conference on Computational Intelligence and Data Science (ICCIDS 2018), 2018, vol. 132, pp. 1654–1662.
-
[13] L. Chen, Y. Zhang, Q. Zhao, G. Geng, and Z. Yan, “Detection of DNS DDoS Attacks with Random Forest Algorithm on Spark,” in The 2nd International Workshop on Big Data and Networks Technologies (BDNT 2018), 2018, vol. 134, pp. 310–315.
-
[14] Z. Abdelali, H. Mustapha, and N. Abdelwahed, “Investigating the use of random forest in software effort estimation,” International Conference on Intelligent Computing in Data Science, vol. 148, no. 2, pp. 343–352, 2018.
-
[15] A. V. Lebedev et al., “Random Forest ensembles for detection and prediction of Alzheimer’s disease with a good between-cohort robustness,” NeuroImage: Clinical, vol. 6, pp. 115–125, 2014.
-
[16] A. Primajaya et al., “Random Forest Algorithm for Prediction of Precipitation,” Indonesian Journal of Artificial Intelligence and Data Mining, vol. 1, no. 1, pp. 27–31, 2018.
-
[17] V. Y. Kulkarni and P. K. Sinha, “Effective Learning and Classification using Random Forest Algorithm,” International Journal of Engineering and Innovative Technology, vol. 3, no. 11, pp. 267–273, 2014.
-
[18] K. Hastuti, “Analisis Komparasi Algoritma Klasifikasi Data Mining Untuk Prediksi Mahasiswa Non Aktif,” Seminar Nasional Teknologi Informasi & Komunikasi Terapan 2012, vol. 14, no. 1, pp. 241–249, 2012.
-
[19] M. Zhu, “Kernels and Ensembles,” Journal The American Statistician, vol. 62, no. 2, pp. 97–109, 2008.
-
[20] L. Breiman, Random Forest, Second Edition, California: Statistics Department University of California Berkeley, 2001.
56
Discussion and feedback