Dempster Shafer Algorithm For Expert System Early Detection of Anxiety Disorders
on
LONTAR KOMPUTER VOL. 12, NO. 2 AUGUST 2021
DOI : 10.24843/LKJITI.2021.v12.i02.p05
Accredited Sinta 2 by RISTEKDIKTI Decree No. 30/E/KPT/2018
p-ISSN 2088-1541
e-ISSN 2541-5832
Dempster Shafer Algorithm For Expert System Early Detection of Anxiety Disorders
Finanta Okmayuraa1, Vitriania2, Melly Novaliaa3
aInformatics Education, University of Muhammadiyah Riau Pekanbaru, Indonesia
1finantaokmayura@umri.ac.id (corresponding author)
Abstract
Anxiety is an excessive anxiety disorder that is often found in psychology. Some people generally do not realize that they may have symptoms of this anxiety disorder. If ignored and continued continuously, it can interfere with one's activities, reduce academic achievement, and disrupt psychological conditions that affect their lives. This expert system for early detection of anxiety disorders is carried out using forward chaining tracing techniques to explore the knowledge base, and the inference motor is the Dempster Shafer algorithm. Dempster Shafer calculation is done by combining symptom pieces to calculate the possibility of the anxiety disorder. This anxiety disorder detection system is built on the web. Then the test is carried out by comparing the value generated by the system with the value generated by two experts. The test results prove that the value generated by the system has a similarity of 85% to the value produced by the two experts. It can be concluded that implementing the Dempster Shafer algorithm for this expert system in the early detection of anxiety disorders is feasible.
Keywords: Anxiety Disorders, Expert System, Dempster-Shafer, Foward Chaining
At this time, so many people, in general, do not realize that they may have symptoms of anxiety disorders so that if ignored and sustained continuously, can interfere with one's activities [1], can reduce academic achievement, and disrupt psychological conditions that result in a standard of living that person [2].
To overcome the various problems that occur, it takes a diagnosis of anxiety disorders to solve the disorder. Diagnosing anxiety disorders requires a person's expertise. A psychologist can only have this expertise. This diagnosis is carried out by transferring the knowledge possessed by a psychologist, which is realized into an Expert System. This is not to replace the role of humans as experts but to transfer human knowledge into a system form so that it can be used by other people who need it as a tool to check whether the person has an anxiety disorder or not, without having to see a psychologist again.
Artificial intelligence is one part of computer science that makes machines (computers) able to do work as well as humans [3]. An expert system application is one component of artificial intelligence that has a knowledge base in a particular field and uses inference reasoning to solve problems initiated on a computer device. The expert system can be used in several fields such as health, government, and any field that utilizes decision-making to obtain the desired results [4].
One of the expert systems that can perform early detection of anxiety disorders is the Dempster-Shafer algorithm. The name of this algorithm is taken from its inventors, namely Arthur P. Dempster and Glenn Shafer. This algorithm serves to find evidence-based belief and thought functions, then combines pieces of information to calculate the probability of an anxiety symptom. The symptoms used are derived from the information provided in the form of symptoms of anxiety disorders [5].
Several cases that have applied the Dempster-Shafer method, among others, prove that the contribution of the Dempster Shafer theory has proven to be a good decision-making tool for early diagnosis of gastric disease [6] and can diagnose disease in toddlers aged 0-60 months [7]. In addition, the Dempster-Shafer method has succeeded in providing disease information on chili plants [8]. Then the damage to the motorcycle can also be diagnosed early with this expert system of the Dempster Shafer algorithm [9].
Dempster Shafer Algorithm is a mathematical theory to find proofs based on belief functions and rational thinking. This algorithm serves to unite separate pieces of information by calculating all the possibilities of a phenomenon. In general, this algorithm is stated as follows [10]:
[Belief, Plausibility]
Belief (Bel) is the possibility of information supporting a set of propositions. If it is 0, it shows no evidence, and if it is 1, it shows certainty. Plausibility (Pl) is stated as follows : [11]:
Pl(S) = 1 - Bel (~S)
(1)
Explanation :
Pl : plausibility
Bel : belief
Plausibility can also be worth 0 to 1. In this Dempster Shafer algorithm, there is a frame of discrement, namely the universe of conversation from a set of hypotheses. This frame is denoted by θ (theta). Furthermore, m3, which is a combined function of m1 and m2, can be expressed as follows [12]:
_ Σ X ∩Y = Zm1(X).m2(Y) m3 = 1 - Σ X ∩Y = Θm1 (X). m2(Y)
(2)
Explanation :
m1 m2 m3 X∩Y θ
probability density 1
probability density 2
probability density 3 disease X slice disease Y frame of discrement
Anxiety is a state of tension which is an impulse like hunger, only it does not arise from tissue conditions in the body but is originally caused by external causes. When anxiety arises, it will motivate the person to do something [13]. Anxiety is a human character in the form of tension or shock to something that threatens accompanied by physiological changes [14]. There are several anxiety disorders, namely [15] :
-
a. Panic Attack (R1)
-
b. Agoraphobia (R2)
-
c. Specific Phobia (R3)
-
d. Social Phobia (R4)
-
e. Obsessive-Compulsive Disorder (R5)
-
f. Post Traumatic Stress Disorder (R6)
-
g. Acute Stress Disorder (R7)
-
h. Generalized Anxiety Disorder (R8)
Before implementing, we must first design the rules in this Expert System [16]; one of them is with a decision tree. The design of the decision tree in this Expert System is shown in Figure 1 below.
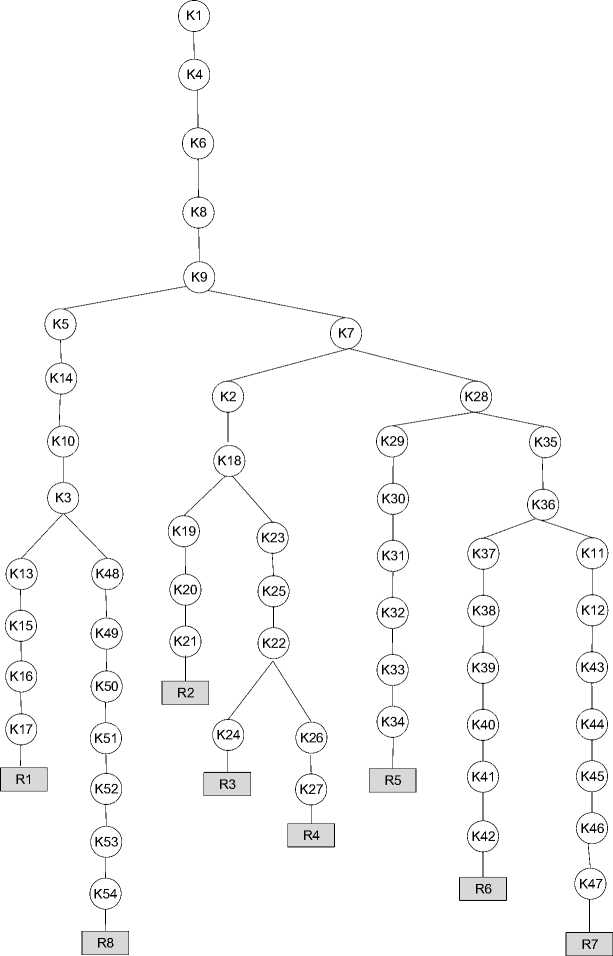
Figure 1. Decision tree
In Figure 1, the decision tree shows that there are 54 symptoms with eight types of anxiety disorders. Each symptom has its density value obtained from the expert. After designing the decision tree, the next step is to design an inference engine. The preparation of the inference motor in this Expert System uses the Forward Chaining tracing technique. The reasoning starts from the facts to test the truth of the hypothesis and the Dempster Shafer algorithm, namely by matching the facts in the knowledge base with the accumulation of probability density symptoms. The inference engine design is shown in Figure 2 below.
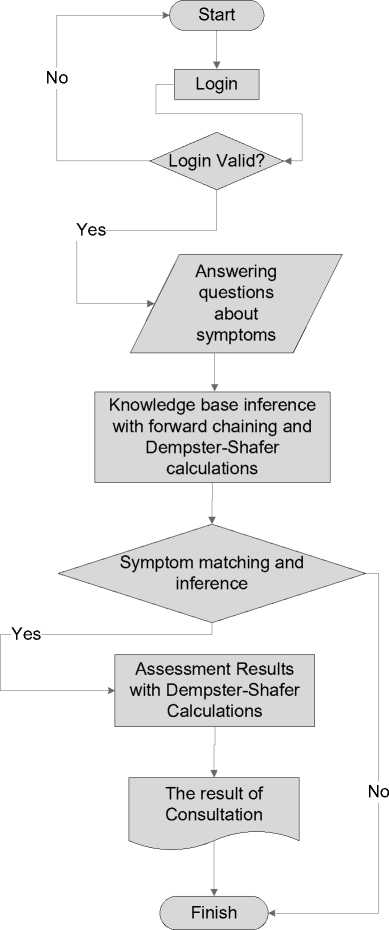
Figure 2. Inference Engine Design
To further analyze the Dempster Shafer Algorithm, manual calculations with the following symptoms of anxiety disorders can be done. The following symptoms are taken by one of the sufferers :
|
K1 K4 K6 K8 K7 K2 K23 K25 K22 |
Excessive anxiety (R1, R2, R3, R4, R5, R6, R7, R8) Heart pounding (R1, R2, R3, R4, R5, R6, R7, R8) Difficult to concentrate (R1, R2, R3, R4, R5, R6, R7, R8) Often feel worried and uncomfortable (R1, R2, R3, R4, R5, R6, R7, R8) Excessive sweating (R2, R3, R4) Fear of losing control (R2, R3, R4) Have you ever admitted that your fear is unwarranted (R3, R4) Experiencing fear for more than six months (R3, R4) Fear of particular objects (R3) |
The following will calculate the Dempster Shafer algorithm based on formula (1) to determine the user's probability of an anxiety disorder. The method is as follows.
-
a. Determine the plausibility value of the first and second symptoms
K1 : Excessive anxiety
m1 {R1, R2, R3, R4, R5, R6, R7, R8} = 0,2 and m1 { θ } = 1 - 0,2 = 0,8
K4 : Heart pounding
m2 {R1,R2,R3,R4,R5,R6,R7,R8} =0,4 and m2 { θ } = 1 - 0,4 = 0,6
-
b. Finding the intersection of the plausibility values and the density values of K1 and K4
After knowing the density values of K1 and K4, the next step is to find the intersection (m3) of the plausibility and density values of K1 and K4. The slice intersection table for m3 can be seen in Table 1 below.
Table 1. Intersection for m3
|
Belief |
Plausibility | |
|
{R1,R2,R3,R4,R5,R6,R7,R8} (0,4) |
θ (0,6) | |
|
{R1,R2,R3,R4,R5,R6,R7,R8} (0,2) |
{R1,R2,R3,R4,R5,R6,R7,R8} (0,08) |
{R1,R2,R3,R4,R5,R6,R7,R8} (0,12) |
|
θ (0,8) |
{R1,R2,R3,R4,R5,R6,R7,R8} (0,32) |
θ (0,48) |
Based on table 1, the new m3 value can be calculated based on formula (2). The m3 value is as follows.
m3 {R1, R2, R3, R4, R5, R6, R7, R8}
(0,2 x 0,4) + (0,2 x 0,6) + (0,8 x 0,4) 1 — 0
0,08 + 0,12 + 0,32 1—0
0,52
1-0
0,52
m3 { θ }
0,8 x 0,6ype equation here.
1-0
0,48
1—0
0,48
-
c. Find the value of plausibility and density of K6 and then slice it with m3
K6 : Difficult to concentrate
m4 {R1,R2,R3,R4,R5,R6,R7,R8} = 0,4 dan m4 { θ } = 1 - 0,4 = 0,6
After the new m3 value is obtained, then the m3 value is then subtracted by m4. The results of the m3 and m4 the intersection is shown in table 2.
Table 2. Intersection for m5
|
Belief |
Plausibility | |
|
{R1,R2,R3,R4,R5,R6,R7,R8} (0,52) θ (0,48) |
{R1,R2,R3,R4,R5,R6,R7,R8} (0,4) {R1,R2,R3,R4,R5,R6,R7,R8} (0,208) {R1,R2,R3,R4,R5,R6,R7,R8} (0,192) |
θ (0,6) {R1,R2,R3,R4,R5,R6,R7,R8} (0,312) θ (0,288) |
Based on table 2, the results of the intersection of m3 and m4 produce m5, so the new m5 value can be calculated. The m5 value is as follows.
m5 {R1, R2, R3, R4, R5, R6, R7, R8}
(0,52 x 0,4) + (0,52 x 0,6) + (0,48 x 0,4) 1—0
0,208 + 0,312 + 0,192 1-0
0,712
m5 { θ }
0,48 x 0,6
1-0
0,288
1-0
0,288
d. Look for the plausibility and density values of K8 and then slice them with m5
K8 : Often feel worried and uncomfortable
m6 {R1,R2,R3,R4,R5,R6,R7,R8} = 0,4 dan m6 { θ } = 1 - 0,4 = 0,6
After obtaining the new m5 value, then the m5 value is intersection by m6. The results of the intersection produce m7 as shown in table 3 below.
|
Table 3. Intersection for m7 | ||||
|
Belief |
Plausibility | |||
|
{R1,R2,R3,R4,R5,R6,R7,R8} |
{R1,R2,R3,R4,R5,R6,R7,R8} (0,4) {R1,R2,R3,R4,R5,R6,R7,R8} |
θ (0,6) {R1,R2,R3,R4,R5,R6,R7,R8} | ||
|
θ |
(0,712) (0,288) |
(0,284) {R1,R2,R3,R4,R5,R6,R7,R8} (0,115) |
θ |
(0,427) (0,172) |
Based on table 3. above, the results of the intersection of m5 and m6 produce m7, so the
new m7 value can be calculated. The m7 value is as follows.
m7 {R1,R2,R3,R4,R5,R6,R7,R8}
(0,712 x 0,4) + (0,712 x 0,6) + (0,288 x 0,4)
1 — 0
0,284 + 0,427 + 0,115 1—0
0,826
m7 { θ }
0,288 x 0,6 1—0
0,172 1-0
0,172
After the m9 value is obtained, the next step is to do the same for K7, K2, K23, K25, and K22,
so that the results of the Dempster Shafer calculation way can be obtained as follows.
Table 4. Density Value
New Density Value
No. Symptoms (m)
|
(m) New |
Value |
|
1 K1 dan K4 ™3 {R1,R2,R3,R4,R5,R6,R7,R8} m3 { θ } O m5 {R1,R2,R3,R4,R5,R6,R7,R8}
m≡ {θ} o m7 {R1,R2,R3,R4,R5,R6,R7,R8}
«7 {θ} |
0,520 0,480 0,712 0,288 0,826 0,172 |
|
No. |
Symptoms |
New Density Value (m) | |
|
(m) New |
Value | ||
|
m9 {R1,R2,R3,R4,R5,R6,R7,R8} |
0,580 | ||
|
4 |
K7 |
m9 {R2,R3,R4} |
0,300 |
|
m9 {θ} |
0,120 | ||
|
m11 {R1,R2,R3,R4,R5,R6,R7,R8} |
0,464 | ||
|
5 |
K2 |
m11 {R2,R3,R4} |
0,440 |
|
m11 {θ} |
0,096 | ||
|
m13 {R1,R2,R3,R4,R5,R6,R7,R8} |
0,186 | ||
|
6 |
K23 |
m13 {R2,R3,R4} |
0,176 |
|
m13 {R3,R4} |
0,600 | ||
|
mu {θ} |
0,038 | ||
|
m15 {R1,R2,R3,R4,R5,R6,R7,R8} |
0,075 | ||
|
7 |
K25 |
m15 {R2,R3,R4} |
0,070 |
|
m15 {R3,R4} |
0,840 | ||
|
m1s {θ} |
0,015 | ||
|
m17 {R1,R2,R3,R4,R5,R6,R7,R8} |
0,014 | ||
|
m17 {R2,R3,R4} |
0,014 | ||
|
8 |
K22 |
m17 {R3,R4} |
0,168 |
|
m17 {R3} |
0,800 | ||
|
ml7 {θ} |
0,004 | ||
Based on table 4. above, the calculation results of the calculation of the highest probability density value are owned by m17 (R3) with a value of 0.800. So the results of the assessment concluded that the user tends to have an anxiety disorder, namely a specific phobia (R3) with a percentage of 80.00%, and can be seen in Figure 5.
The application of the Dempster Shafer algorithm for the Expert System in diagnosing anxiety disorders will result in an assessment that shows the sufferer tends to have an anxiety disorder or not. It is based on “yes” answers to symptom questions provided by the system.
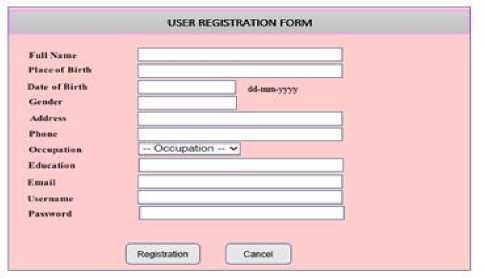
Figure 3. Inference Data
Figures 3, 4, and 5 are the page when the user accesses the expert system. The display of the user registration page before consulting the expert system is shown in Figure 3.
In Figure 3. users can register by filling in their data. After that, the user logs in using the username and password. Then the user can use the consultation menu, such as consulting and expert, in this case, a psychologist. Every user who wants to do early detection of anxiety disorders against himself can choose this menu. Then, the system gives some questions to get the detection results here. In Figure 4. the following is the initial view after the consultation menu is selected.
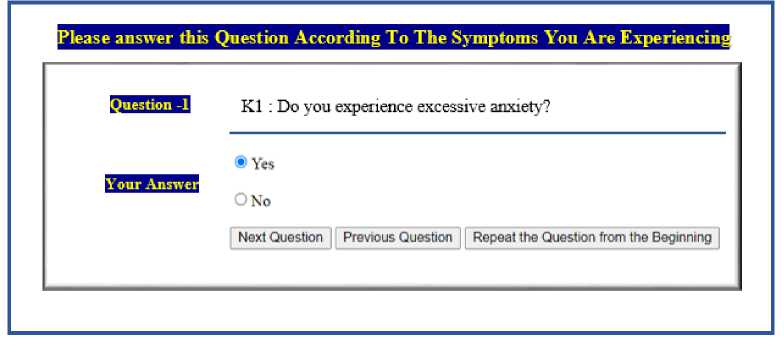
Figure 4. The first question when the user selects the consultation menu
If all questions have been answered, the system will automatically display the early detection results of anxiety disorders and the Dempster Shafer calculation to determine the probability that the patient tends to have anxiety disorders. Then the system will also display the solution, as shown in Figure 5. below.
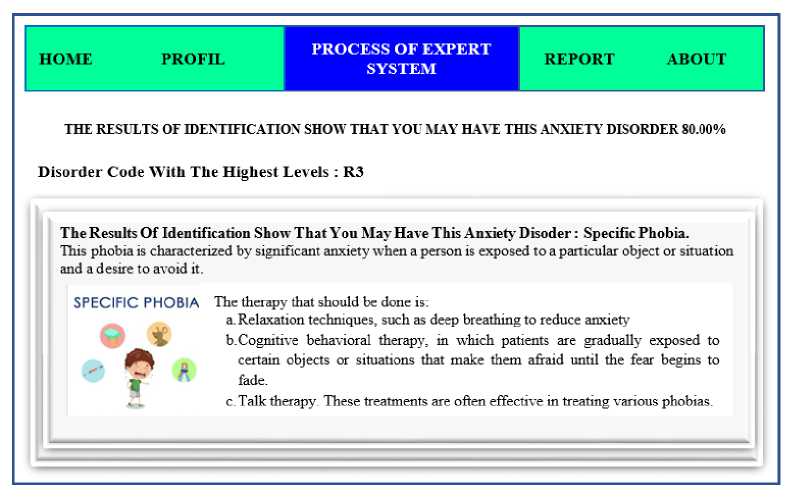
Figure 5. The Results of Expert System Consultation
In Figure 5, the system displays the results of the Dempster Shafer calculation, which concludes that the patient has a specific phobic anxiety disorder (F3) of 80.00%.
After implementation, the two experts tested the results of the expert system as performed in table 5 and table 6 below.
Tabel 5. Comparison of the Test Results of First Expert with the Expert System
|
Patient |
Symptoms |
Results with Expert 1 |
Results with Expert System |
Conclusion |
|
1 |
K8, K9, K5, K14, K10, K3, K13, K15, K16 |
R1 |
R1 |
suitable |
|
2 |
K8, K9, K5, K14, K10, K3, K48, K49 |
R8 |
R8 |
suitable |
|
3 |
K8, K9, K7, K2, K18, K23, K25, K22, K24 |
R3 |
R3 |
suitable |
|
4 |
K8, K9, K5, K14, K10, K3, K48, K49, K50, K51 |
R8 |
R8 |
suitable |
|
5 |
K8, K9, K7, K28, K29, K30, K31, K32 |
R5 |
R5 |
suitable |
|
6 |
K8, K9, K5, K14, K10, K3 |
R1 |
R8 |
not suitable |
|
7 |
K8, K9, K7, K2, K18, K23, K25, K22, K26 |
R4 |
R4 |
suitable |
|
8 |
K8, K9, K7, K2, K18, K23, K25, K22 |
R3 |
R4 |
not suitable |
|
9 |
K8, K9, K5, K14, K10, K3, K48, K49, K50, K51, K52, K53 |
R8 |
R8 |
suitable |
|
10 |
K8, K9, K7, K2, K18, K19, K20 |
R2 |
R2 |
suitable |
Based on the tests carried out ten times by the system on the first expert, there are differences in the detection results in the 6th and 8th patients, so it is necessary to calculate the accuracy value, namely the suitability of the system value with the expert. This is because experts understand the patient's typical condition better than the system. The first calculation of the accuracy value is the suitability of the system results with the first expert as follows: (3) [17].
∑suitable result analysis Accuracy value 1 = —--------------:-----x 100 %
(3)
∑number of patient
8
Accuracy value 1 = — x 100 %
= 80,00 %
|
Table 6. Comparison of the Test Results of Second Expert with the Expert System | ||||
|
Patient |
Symptoms |
Results with Expert 2 |
Results with Expert System |
Conclusion |
|
1 |
K8, K9, K5, K14, K10, K3, K13, K15, K16 |
R1 |
R1 |
suitable |
|
2 |
K8, K9, K5, K14, K10, K3, K48, K49 |
R8 |
R8 |
suitable |
|
3 |
K8, K9, K7, K2, K18, K23, K25, K22, K24 |
R3 |
R3 |
suitable |
|
4 |
K8, K9, K5, K14, K10, K3, K48, K49, K50, K51 |
R8 |
R8 |
suitable |
|
5 |
K8, K9, K7, K28, K29, K30, K31, K32 |
R5 |
R5 |
suitable |
|
6 |
K8, K9, K5, K14, K10, K3 |
R1 |
R1 |
suitable |
|
7 |
K8, K9, K7, K2, K18, K23, K25, K22, K26 |
R3 |
R4 |
not suitable |
|
8 |
K8, K9, K7, K2, K18, K23, K25, K22 K8, K9, K5, K14, K10, K3, |
R4 |
R4 |
suitable |
|
9 |
K48, K49, K50, K51, K52, K53 |
R8 |
R8 |
suitable |
|
10 |
K8, K9, K7, K2, K18, K19, K20 |
R2 |
R2 |
suitable |
Based on table 6. there are differences in the results of the system's detection of the expert on the 7th patient. This is because the expert understands the specifics of the symptoms experienced by the patient more than the system. The second accuracy value calculation results from comparing the values obtained by the system with the second expert. The system accuracy value is obtained by using equation (3) as follows.
9 Accuracy value 1 = — x 100 %
= 90,00 %
Setelah didapat perbandingan hasil sistem dengan pakar pertama dan pakar kedua, maka dilakukan perhitungan rerata nilai akurasi kedua pakar tersebut dengan rumus (4) berikut.
Accuracy value 1 + Accuracy value 2
Average accuracy value =--------------------------------- (4)
80,00 + 90,00
Average accuracy value =-------------
= 85 %
Based on the average value of accuracy made by the two experts on the Expert System, which showed a result of 85%, it can be concluded that this expert system is acceptable and feasible to use for the early detection of anxiety disorders.
After analyzing and testing the implementation of the web-based Dempster Shafer Algorithm for the Expert System for Early Detection of Anxiety Disorders, several inferences can be obtained; namely, Dempster Shafer Algorithm provides the latest breakthroughs in the world of psychology or psychiatry and can assist psychologists in diagnosing anxiety disorders based on the symptoms faced by the patient and can provide solutions to the problems experienced. Then based on the average value of accuracy carried out by the two experts on the Expert System, the result was 85%, which means that this expert system is acceptable and feasible to use for early detection of anxiety disorders.
References
-
[1] N. Sevani and S. Silvia, “Web Deteksi Gangguan Kecemasan dan Depresi,” Ultimatics: Jurnal Teknik Informatika, vol. 7, no. 1, 2015.
-
[2] A. Asrori, “Terapi Kognitif Perilaku Untuk Mengatasi Gangguan Kecemasan Sosial,” Jurnal Ilmiah Psikologi Terapan (JIPT), vol. 03, no. Vol 3, No 1 (2015), 2015.
-
[3] M. D. Sinaga and N. S. B. Sembiring, “Penerapan Metode Dempster Shafer Untuk Mendiagnosa Penyakit Dari Akibat Bakteri Salmonella,” CogITo Smart Journal, vol. 2, no. 2, 2016.
-
[4] R. Pratiwi, S. Andryana, and A. Gunaryati, “Diagnosa Hepatitis A Menggunakan Metode
Dempster - Shafer,” Jurnal ELTIKOM, vol. 4, no. 1, 2020.
-
[5] M. Hafizh and T. A. Putra, “Implementasi Metode Dempster Shafer Pada Sistem Pakar
Diagnosis Penyakit Ginjal Berbasis Web Dengan Menggunakan Php Dan Mysql,” Indonesian Journal of Computer Science, vol. 7, no. 2, 2018.
-
[6] R. Ardiansyah, F. Fauziah, and A. Ningsih, “Sistem Pakar Untuk Diagnosa Awal Penyakit Lambung Menggunakan Metode Dempster-Shafer Berbasis Web,” Jurnal Ilmiah Teknologi Dan Rekayasa, vol. 24, no. 3, 2019.
-
[7] S. 2019, “Sistem pakar mendiagnosa penyakit pada balita usia 0 – 60 bulan menggunakan metode Dempster-Shafer,” Jurnal Komputer Dan Informatika, vol. 8, no. 1, pp. 45–52, Mar. 2020.
-
[8] M. Muliadi, I. Budiman, M. A. Pratama, and A. Sofyan, “Fuzzy Dan Dempster-Shafer Pada Sistem Pakar Diagnosa Penyakit Tanaman Cabai,” KLIK - Kumpulan Jurnal Ilmu Komputer, vol. 4, no. 2, 2017.
-
[9] S. Iswanti and R. N. Anggraeny, “Implementasi Metode Dempster-Shafer Pada Sistem Pakar Pendiagnosa Kerusakan Sepeda Motor,” Informatika Mulawarman: Jurnal Ilmiah Ilmu Komputer, vol. 14, no. 1, 2019.
-
[10] M. H. Basri, A. Mahmudi, and N. Vendyansyah, “Perbandingan Metode Dempster Shafer Dan Certainty Factor Untuk Diagnosis Penyakit Tanaman Terong (Studi Kasus Dusun Kejoren, Desa Gerbo, Kec. Purwodadi),” JATI (Jurnal Mahasiswa Teknik Informatika), vol. 4, no. 1, 2020.
-
[11] F. Okmayura and N. Effendi, “Design of Expert System for Early Identification for Suspect Bullying On Vocational Students by Using Dempster Shafer Theory,” CIRCUIT: Jurnal Ilmiah Pendidikan Teknik Elektro, vol. 3, no. 1, 2019.
-
[12] E. Astuti, N. E. Saragih, N. Sribina, and R. Ramadhani, “Dempster-Shafer Method for Diagnose Diseases on Vegetable,” in 2018 6th International Conference on Cyber and IT Service Management, CITSM 2018, 2019.
-
[13] Calvin S. Hall & Gardner Lindzey, Teori-Teori Psikodinamik. Yogyakarta: Kanius, 2009.
-
[14] N. Asma, “Pengaruh Konseling Terhadap Kecemasan Menghadapi Persalinan Pada Primigravida Di Wilayah Kerja Puskesmas Buket Hagu Kecamatan Lhoksukon Kabupaten Aceh Utara.,” Universitas Sumatra Utara., 2014.
-
[15] A. P. Association, Diagnostic And Statistical Manual of Mental Disorders. Arlington, 2004.
-
[16] J. Kanggeraldo, R. P. Sari, and M. I. Zul, “Sistem Pakar Untuk Mendiagnosis Penyakit Stroke Hemoragik dan Iskemik Menggunakan Metode Dempster Shafer,” Jurnal RESTI (Rekayasa Sistem Dan Teknologi Informasi), vol. 2, no. 2, 2018.
-
[17] D. T. Yuwono, “Implementasi Pakar Diagnosa Gangguan Kepribadian Menggunakan Metode Dempster Shafer,” Jurnal Sistem Informasi Bisnis, vol. 9, no. 1, 2019.
122
Discussion and feedback