Offline Signature Identification Using Deep Learning and Euclidean Distance
on
LONTAR KOMPUTER VOL. 12, NO. 2 AUGUST 2021
DOI : 10.24843/LKJITI.2021.v12.i02.p04
Accredited Sinta 2 by RISTEKDIKTI Decree No. 30/E/KPT/2018
p-ISSN 2088-1541
e-ISSN 2541-5832
Offline Signature Identification Using Deep Learning and Euclidean Distance
Made Prastha Nugrahaa1, Adi Nurhadiyatnab1, Dewa Made Sri Arsaa2
aDepartment of Information Technology, Udayana University
Badung, Indonesia
bFaculty of Electrical Engineering and Computing, University of Zagreb
Zagreb, Croatia
1nmadeprastha@gmail.com (corresponding author) 2adi.nurhadiyatna@fer.hr
Abstract
Hand signature is one of the human characteristics that humans have since birth, which can be used for identity recognition. A high accuracy signature recognition is needed to identify the correct owner of the signature. This study presents signature identification using a combination method between Deep Learning and Euclidean Distance. This study uses three different signature datasets are used in this study which consists of SigComp2009, SigComp2011, and private dataset. First, signature images are preprocessed using binary image conversion, Region of Interest, and thinning. The preprocessed image then has its feature extracted using DenseNet201 and further identified using Euclidean Distance. Several testing scenarios are also applied to measure proposed method robustness, such as using various Pretrained Deep Learning, dataset augmentation, and dataset split ratio modifiers. The best accuracy achieved is 99.44%, with a high precision rate.
Keywords: Hand Signature, SigComp2009, SigComp2011, Thinning, Region of Interest, Identification, Deep Learning, Euclidean Distance
Signature is human identifier biometrics that is well known and recognized as a tool for identifying a person [1]. A signature is a handwriting or hand stroke with a unique writing style, such as a line of stroke that resembles the name of the signature owner or symbol used as proof of an individual's identity. The signature was recognized as a biometric feature after UNCITRAL established the first digital signature law in the early 90s.
Signature Recognition can be classified into two main groups, which consist of online signature and offline signature. Online signature recorded by using touch screens panels like smartphones or tablets. The recorded signature then has its feature extracted, such as pressure points and the path or steps taken while creating the signature. Offline signature only needs scanning process on the signature image and remove the needed feature based on the scanned image [2].
Offline Signature identification is considered more difficult than online signature since offline signature does not have a dynamic feature that is present on online signature [1]. Offline signatures depend only on the capture signature shape available from the signature image, while online signatures can use various features such as pressure points and velocity of the drawn signature [3].
Signature is used as identity when making a transaction on an online market or e-commerce. Signature is also used as an attendance mark on the high amount of workspace, which is why research on signature identification has recently gotten a lot of attention. Various methods are used to identify a signature, such as research [3] conducted using binary image conversion and image morphology which consist of erosion and dilation as image preprocessing. Convolutional
Neural Network is used as both training and identification methods. This study offers a 92% accuracy average as the final result using the dataset from SigComp2011.
This study used Convolutional Neural networks as feature extraction and identification methods. Convolutional Neural Network is also used in this study [4], where the study used median filter, extracted signature line, and centering as image preprocessing. The highest result achieved in this study is 73% accuracy in predicting grayscale signature by using 7:3 training data and testing split data ratio.
Study [5] conducted a study using a random forest classifier to identify handwritten signature and binary image conversion as image preprocessing. This study also implemented various classification methods by using the SigComp2009 Dataset. The highest accuracy obtained is 60%. The problem in this study is that the proposed method is too flexible and has a high chance of false results.
Study [6] used combination methods for signature recognition, such as Principal Components Analysis (PCA) as feature extraction and Euclidean Distance as classification methods. Image preprocessed by using Gray Level Thresholding. Study [6] achieved a 95% accurate result. This is achieved by using a private dataset that consists of two writer classes. The dataset used is too small and need more writer classes
Six years later, Study [7] continued the previous study [6] and conducted a similar study using different methods and datasets. This study used ten writer classes as its dataset and used gray scaling as image preprocessing. The preprocessed image then has its dimension changed into 100x100 px and 50x50px, which further has its feature extracted using Gray Level Co-Occurrence (GLCM). The extracted feature is used as an identification process with Euclidean Distance. Study [7] obtained 67.5% accuracy as the study's highest result by splitting the dataset by 3:2 ratio of training and testing data. This study still needs further improvement for a better result, both on the feature extraction process and the amount of dataset used.
The proposed study used the combined method from previous studies, starting from image preprocessing consisting of image conversion, Region of Interest area, and image thinning. One of the signature dataset used is SigComp2011 that is also used in the study [3], while feature extraction is done by using Pretrained Deep Learning, and image classifier using Euclidean Distance similar to study [6] and [7]. The result of this study is a better performance signature identification system using the combined method from a previous study and its performance in several testing scenarios.
This study focused on improving system performance by combining several methods mentioned or tested in the previous study. These methods include using DenseNet201 as a feature extraction method while using Euclidean Distance as an identification method, with various image preprocessing steps to increase the system's final performance further. The general process of the proposed methods is shown in Figure 1.
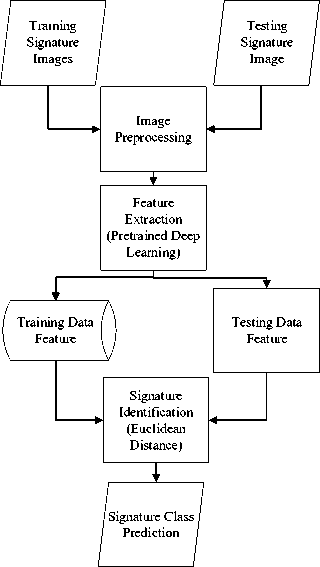
Figure 1. General Process
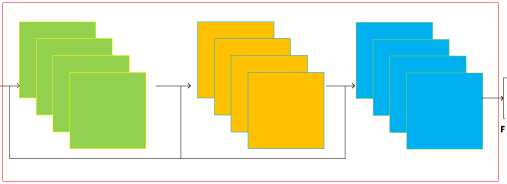
Signature Identification was done by doing two separate processes, such as making a training signature feature database and the actual identification process. Both training signatures and testing signatures went through the same image preprocessing and feature extraction. Feature extraction is done by using DenseNet201. Input picture is set into 100x120 pixels, while extracted feature is adjusted into 17280 rows.

Preprocessed Image
Reshape 100x120
Feature Adjustment
DenseNet201
Figure 2. Feature Extraction using DenseNet201
Flatten 17280 Feature

Extracted Feature
Extracted training signatures feature saved as feature database and as comparison with test signature features for signature identification. The final result will show the predicted signature class or owner.
This study used three different datasets that were also used by the previous research, which consist of ICDAR 2009 Signature Verification Competition (SigComp2009) [8], ICDAR 2011 Signature Verification Competition (SigComp2011) [9], and private dataset. Details of used datasets are shown in Table 1.
Table 1. Dataset Details
|
Dataset |
Total Image |
Writer Classes |
|
SigComp2009 |
936 |
78 |
|
SigComp2011 |
480 |
20 |
|
Private |
750 |
50 |
Datasets will be divided into training signatures dataset and testing signatures dataset. The private dataset is divided into ten training signature images and five testing signature images per class. SigComp2009 consists of 4 training signature images and eight testing signature images on each class, while SigComp2011 consists of 15 training signature images and nine testing signature images. Different proportion on the dataset is applied to find out the impact of modified dataset total to system performance.
Both training and testing signature images will go through various image preprocessing methods. Image preprocessing needed to be done since original signature images are affected by the different conditions when captured, such as different lighting and noises from the scanning device [10]. Image preprocessing steps are shown in Figure 3.
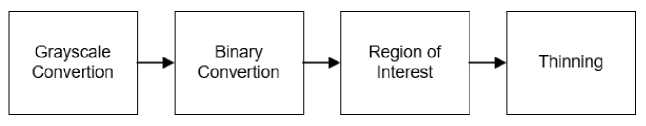
Figure 3. Preprocessing Steps
The result of image preprocessing is shown in Figure 4. Original signature image (a) will be converted into grayscale image (b), then further converted into a binary image (c). The region of interest (ROI) method is applied to the binary signature image to reduce the background image (d). ROI can remove unused background from the image for the system to do better and faster processing [11].
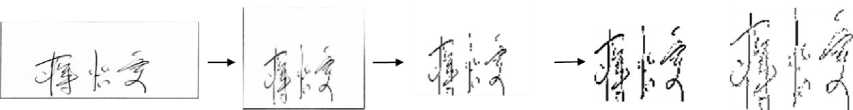
Original Image Grayscale Image Binary Image ROI Image Thinned Image
(a) (b) (c) (d) (e)
Figure 4. Image Preprocessing Process
Image preprocessing then continued into thinning (e). Thinning is one of the morphological image operations used to remove foreground pixels from the binary image. Thinning can also be defined as reducing the image to some extend and preserved the points needed for image processing [12].
The preprocessed image gets its feature extracted using Pretrained Deep Learning. Pretrained Deep Learning is a series of neural networks used to classify the object. Pretrained Deep Learning is also called Transfer Learning and can save time since researchers do not need to train the models from scratch like traditional Convolutional Neural networks (CNN) [13]. CNN consists of neural networks with untrained weights and bias, which makes CNN take longer time to do the identification process [14]. There are various Pretrained Deep Learning architecture model, such as Inception [15], Xception [16], VGG [17], ResNet [18], MobileNet [19], and DenseNet [20]. The numbers behind Pretrained Deep Learning architecture said behind the model used to show the
value of layers used, as, in DenseNet201, the model architecture used is DenseNet [20]. It has 201 layers of deep Convolutional Neural Network.
Preferred Pretrained Deep Learning model must be loaded first so the model can extract the feature within images. Feature Extraction steps are shown in Figure 5.
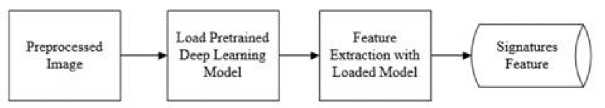
Figure 5. Feature Extraction Steps
The output of feature extraction is a difference based on the initial input. Training signature images will get their feature extracted and saved on a single folder as a csv file, which will be used in the identification process. Testing signature images will get their feature extracted and directly compared with saved training signature features.
Testing signature image feature will be compared to training signature feature that has been saved. Euclidean Distance will be used to calculate the similarity between both features. The identification process will be shown in Figure 6.
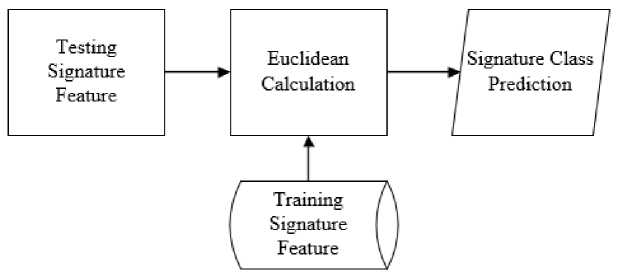
Figure 6. Identification Process
Euclidean Distance is a method to calculate distance between 2 points. Euclidean Distance draws a straight line between these 2 points [7] Euclidean Distance equation used in this study is shown below.
(1)
d - √ (^ι- ^1)2 + (^∑- ^2)2+∙ ■ ■ ■ +(^n- ^n)2
Equation (1) is a multidimensional Euclidean Distance calculation. The equation is used if two compared points have an n-dimension vector. D is the value of Euclidean Distance, while X and Y represent the vector value of two points being compared respectively. Lower Euclidean Distance value means the compared points or data have high similarity. The predicted signature class will be shown as the lowest distance of the respective training signature feature class.
Proposed methods performance is also measured by using Receiver Operation Characteristic (ROC). ROC shows the value of False Acceptance Rate (FAR) and False Rejection Rate (FRR) on a graph.
FAR -
Total value of signature image identified as wrong writer class
(2)
Total value of rejected signature image total test images
(3)
False Rejection Rate (FRR) is calculated by dividing the rejected signature image (false negative) value by total test images. Image is rejected if the result value is not within the threshold.
GAR = 1- FRR
(4)
FRR is used to calculate the Genuine Acceptance Rate value (GAR). Genuine Acceptance Rate (GAR) is the percentage value of a signature that is identified correctly [21].
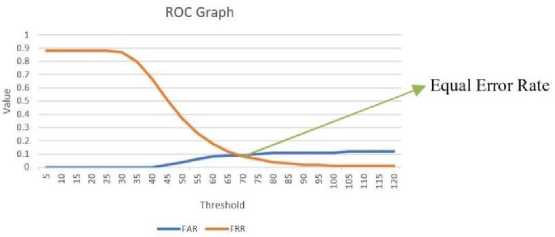
Figure 7. ROC Graph
Figure 6 shows the Receiver Operation Characteristic (ROC) Graph. Intersections of FAR and FRR is called Equal Error Rate (EER).
This study conducts several tests on different scenarios to measure the robustness and real case problems. The proposed method is tested using augmented training images, different ratio applications on the used dataset, and comparing three datasets mentioned in section 2.1.
The first test is conducted using the SigComp2011 [9] dataset to evaluate each Pretrained Deep Learning model. There are 11 Pretrained Deep Learning used on this test, which is shown in Table 2.
Table 2. Pretrained Deep Learning Trial Result
|
Pretrained Deep Learning |
Feature Extraction Time Used (s) |
Identification Time Used (s) |
Accuracy |
|
Xception |
21.84 |
79.64 |
73.68% |
|
VGG19 |
15.16 |
22.59 |
96.59% |
|
VGG16 |
15.00 |
22.19 |
66.48% |
|
ResNet50 |
24.71 |
106.15 |
96.59% |
|
MobileNetV2 |
19.19 |
46.57 |
93.75% |
|
MobileNet |
15.72 |
36.75 |
98.86% |
|
InceptionV3 |
28.89 |
34.02 |
76.14% |
|
InceptionResNetV2 |
46.69 |
48.36 |
78.41% |
|
DenseNet201 |
57.59 |
90.26 |
99.43% |
|
DenseNet169 |
39.52 |
72.4 |
92.05% |
|
DenseNet121 |
31.92 |
51.76 |
96.02% |
Based on Table 2, VGG16, VGG19, and MobileNet offer a much shorter time used on feature extraction and identification steps. Both VGG only needs 38 seconds to finish the identification process, while MobileNet is not far behind, with the time required is 51 seconds. This result varies from each Pretrained Deep Learning architecture because the value of networks on those models differs.
For accuracy, the best Pretrained Deep Learning to use for this study is DenseNet201, which has 99.43% accuracy. MobileNet and VGG are not far behind, with 98.86% and 96.59% accuracy values, respectively. DenseNet201 provides the best result as DenseNet architecture has additional inputs from all preceding layers, making the network compact and thinner. This is beneficial since the signature dataset used is not a high-resolution image.
The next test is to add several distance-based measurements to compare with DenseNet201 as a feature extraction method. The distance method used are Manhattan Distance, Minkowski Distance, and Cosine Distance.
Table 3. Augmented Image Result
|
Distance Method |
Accuracy |
|
Euclidean |
99.43% |
|
Manhattan |
97.73% |
|
Minkowski |
99.43% |
|
Cosine |
99.43% |
The test result shows that only Manhattan Distance has a different result. This result is because Manhattan Distance is only optimized for integer calculation, while the extracted feature has a float number.
The third test is using the Augmentation Dataset, which consists of brightness and rotation modification. These augmentations are used because these are the most relevant on signature real case problems. Brightness modifications have five values between the range of 0.5 to 0.9 of the original image brightness, while rotation modifications have ten values between the range of -10 to 10. The original dataset used on this test is SigComp2011 [9].
Table 4. Augmented Image Result
|
Augmentation |
Total Training Image |
Accuracy |
|
Brightness |
298 |
99.43% |
|
Rotation |
1800 |
86.93% |
|
Brightness + Rotation |
37800 |
85.23% |
The test result on augmented training signature image is underwhelming since its lower than the normal test result, not to mention the amount of time consumed to augment the images and extract its feature. The highest accuracy was achieved by brightness augmentation, which gives a 99.43% accuracy value, the same as the highest accuracy achieved on the normal dataset.
The fourth test is to modify the split data ratio. Ratio split is used on all signature images of the used datasets to divide signature images into training data and testing data. The range of ratio split starts from 0.1 to 0.9, with a 0.1 increase value on each iteration. The dataset used on this test is a private dataset consisting of 400 images in 50 writer classes, while the Pretrained Deep Learning model used DenseNet201. This test is carried to find out the effect of different value data training and data testing used on system performance.
Table 5. Data Split Result
|
Split Ratio |
Total Training Image |
Total Testing Image |
Accuracy |
|
0.7 |
280 |
120 |
99.17% |
|
0.8 |
320 |
80 |
100.00% |
|
0.9 |
360 |
40 |
100.00% |
As Table 5 shown, the higher the training signature image ratio is used, the higher accuracy grows. But the accuracy results do not prove that higher training images offer higher accuracy. In this test, the incorrectly identified signature testing images are moved into training images as the ratio increases, affecting the accurate result.
The final test is a comparison to the various dataset, which mentioned in section 2.1. This test evaluates the proposed method's performance on different datasets with different intraclass and interclass signatures values.
Table 6. Datasets Detail
|
Dataset |
Writer Classes |
Total Training Image |
Total Testing Image |
|
SigComp2009 |
78 |
4 |
8 |
|
SigComp2011 |
20 |
15 |
4 |
|
Private |
50 |
10 |
5 |
Table 6 show the detail of multiple datasets that used in this study. SigComp2009 has 78 writer classes which consist of 4 training signature images and eight testing signature images, while SigComp2011 has 20 writer classes which consist of 10 training signature images and four testing images. The private dataset has 50 classes and consists of 10 training signature images and five testing signature images.
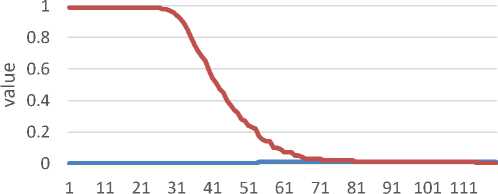
threshold
^^^^^M FAR ^^^^^» FRR
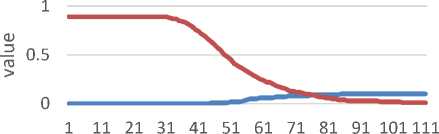
Figure 8 SigComp2009 ROC
Figure 8 represent SigComp2009 Receiver Operation Characteristic (ROC) graph. ROC shows False Acceptance Rate (FAR) and False Rejection Rate (FRR), and the intersections point of FAR and FRR, which is called Equal Error Rate (EER). EER from SigComp2009 dataset is obtained on threshold 76 with 0,089 value and Genuine Acceptance Rate acquired is 91%.
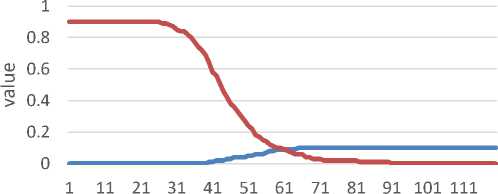
threshold
^^^^^^ FAR ^^^^^^ FRR
Figure 9 SigComp2011 ROC
Figure 9 represents the SigComp2011 ROC graph. Equal Error Rate is obtained on threshold 90 with 0,0057 value, and Genuine Acceptance Rate acquired is 99%. SigComp2011 has better results compared to SigComp2009 since SigComp2011 has fewer writer classes.
threshold
«■■■■■M FAR ^^^^^^^ FRR
Figure 10 Private Dataset ROC
Figure 10 represents the Private Dataset ROC graph. Equal Error Rate is obtained on threshold 61 with 0,09 value, and Genuine Acceptance Rate acquired is 91%.
Table 7. Multiple Dataset Result
|
Dataset |
Threshold |
EER |
GAR |
|
SigComp2009 |
76 |
0.089 |
91% |
|
SigComp2011 |
90 |
0.0057 |
99% |
|
Private |
61 |
0.09 |
91% |
Table 7 represents the result of the signature identification test using the Receiver Operation Characteristic (ROC) approach. SigComp2011 dataset has 99% Genuine Acceptance Rate (GAR) value, while both SigComp20009 and Private dataset has GAR with 91% value. This result shows that the number of classes, used training, and testing signature images significantly impact identification accuracy.
This study proposed an offline signature identification using combination methods between Pretrained Deep Learning and Euclidean Distance. Pretrained Deep Learning is used as feature extraction, while Euclidean Distance is used as an identification method. Various Pretrained Deep Learning such as DenseNet, Inception, ResNet, VGG, Xception, and MobileNet are evaluated as a comparison for finding the best result. Several scenarios of testing are also conducted to measure the robustness of the proposed method in various conditions.
The highest accuracy was measured using DenseNet201 as a feature extraction method, which gives a 99.43% accuracy value. This Pretrained Deep Learning is also used on other databases, such as Sigcomp2009 and private databases. The result of the test using those databases are both 91.00%
References
-
[1] H. Saikia and K. Chandra Sarma, “Approaches and Issues in Offline Signature Verification System,” International Journal of Computer Applications, vol. 42, no. 16, pp. 45–52, Mar. 2012, doi: 10.5120/5780-8035.
-
[2] M. Taskiran and Z. G. Cam, “Offline signature identification via HOG features and artificial neural networks,” in 2017 IEEE 15th International Symposium on Applied Machine Intelligence and Informatics (SAMI), Jan. 2017, pp. 000083–000086, doi: 10.1109/SAMI.2017.7880280.
-
[3] M. A. Djoudjai, Y. Chibani, and N. Abbas, “Offline signature identification using the histogram of symbolic representation,” 2017 5th International Conference on Electrical Engineering -Boumerdes (ICEE-B), vol. 2017-Janua, pp. 1–6, 2017, doi: 10.1109/ICEE-B.2017.8192092.
-
[4] T. Sultan Rana, H. Muhammad Usman, and S. Naseer, “Static Handwritten Signature
Verification Using Convolution Neural Network,” 3rd International Conference on Innovative Computing (ICIC), no. Icic, 2019, doi: 10.1109/ICIC48496.2019.8966696.
-
[5] M. Thenuwara and H. R. K. Nagahamulla, “Offline handwritten signature verification system using random forest classifier,” 17th International Conference on Advances in ICT for Emerging Regions (ICTer) 2017, vol. 2018-Janua, pp. 191–196, 2017, doi:
10.1109/ICTER.2017.8257828.
-
[6] E. Utami and R. Wulanningrum, “Use of Principal Component Analysis and Euclidean Distance to Identify Signature Image,” Iptek-Kom, vol. 16, no. 1, pp. 1–16, 2014, [Online]. Available: https://jurnal.kominfo.go.id/index.php/iptekkom/article/viewFile/505/327.
-
[7] G. D. Angel and R. Wulanningrum, “Machine Learning untuk Identifikasi Tanda Tangan Menggunakan GLCM dan Euclidean Distance,” Prosiding SEMNAS INOTEK (Seminar Nasional Inovasi Teknologi), pp. 297–301, 2020.
-
[8] V. L. Blankers, C. E. Van Den Heuvel, K. Y. Franke, and L. G. Vuurpijl, “The ICDAR 2009 signature verification competition,” Proceeding 10th International Conference on Document Analysis and Recognition, ICDAR, pp. 1403–1407, 2009, doi: 10.1109/ICDAR.2009.216.
-
[9] M. Liwicki et al., “Signature verification competition for online and offline skilled forgeries (SigComp2011),” Proceeding International Conference on Document Analysis and Recognition, ICDAR, pp. 1480–1484, 2011, doi: 10.1109/ICDAR.2011.294.
-
[10] X. Yan, L. Wen, L. Gao, and M. Perez-Cisneros, “A Fast and Effective Image Preprocessing Method for Hot Round Steel Surface,” Mathematical Problems in Engineering, vol. 2019, 2019, doi: 10.1155/2019/9457826.
-
[11] A. H. Pratomo, W. Kaswidjanti, and S. Mu’arifah, “Implementasi Algoritma Region of Interest ( ROI ) Untuk Meningkatkan Performa Algoritma Deteksi Dan Klasifikasi Kendaraan,” Jurnal Teknologi Informasi dan Ilmu Komputer, vol. 7, no. 1, pp. 155–162, 2020, doi:
10.25126/jtiik.202071718.
-
[12] Abhisek and K. Lakshmesha, “Thinning approach in digital image processing,” Last
Accessed April, pp. 326–330, 2018.
-
[13] A. Foroozandeh, A. Askari Hemmat, and H. Rabbani, “Offline Handwritten Signature
Verification and Recognition Based on Deep Transfer Learning,” International Conference on Machine Vision and Image Processing. MVIP, vol. 2020-Janua, 2020, doi:
10.1109/MVIP49855.2020.9187481.
-
[14] I. M. Mika Parwita and D. Siahaan, “Classification of Mobile Application Reviews using Word Embedding and Convolutional Neural Network,” Lontar Komputer Jurnal Ilmiah Teknologi Informasi, vol. 10, no. 1, p. 1, 2019, doi: 10.24843/lkjiti.2019.v10.i01.p01.
-
[15] J. A. Gliner, G. A. Morgan, N. L. Leech, J. A. Gliner, and G. A. Morgan, “Measurement Reliability and Validity,” Research Methods in Applied Settings, pp. 319–338, 2021, doi: 10.4324/9781410605337-29.
-
[16] S.-H. Tsang, “No Title,” Review: Xception - With Depthwise Separabale Convolution, Better THan Inception-V3, 2018. review: Xception - With Depthwise Separabale Convolution, Better THan Inception-V3 (accessed May 18, 2021).
-
[17] O. Sudana, I. W. Gunaya, and I. K. G. D. Putra, “Handwriting identification using deep convolutional neural network method,” Telkomnika (Telecommunication Computing
Electronics and Control), vol. 18, no. 4, pp. 1934–1941, 2020, doi:
10.12928/TELKOMNIKA.V18I4.14864.
-
[18] K. He, X. Zhang, S. Ren, and J. Sun, “Deep residual learning for image recognition,” Proceeding IEEE Conference on Computer Vision and Pattern Recognition (CVPR), vol. 2016-Decem, pp. 770–778, 2016, doi: 10.1109/CVPR.2016.90.
-
[19] Y. Harjoseputro, I. P. Yuda, and K. P. Danukusumo, “MobileNets: Efficient Convolutional Neural Network for Identification of Protected Birds,” International Journal on Advanced Science, Engineering and Information Technology, vol. 10, no. 6, pp. 2290–2296, 2020, doi: 10.18517/ijaseit.10.6.10948.
-
[20] G. Huang, Z. Liu, L. Van Der Maaten, and K. Q. Weinberger, “Densely connected convolutional networks,” Proceeding - 30th IEEE Conference on Computer Vision and Pattern Recognition, CVPR 2017, vol. 2017-Janua, pp. 2261–2269, 2017, doi:
10.1109/CVPR.2017.243.
-
[21] Y. Adiwinata, A. Sasaoka, I. P. Agung Bayupati, and O. Sudana, “Fish Species Recognition with Faster R-CNN Inception-v2 using QUT FISH Dataset,” Lontar Komputer Jurnal Ilmiah Teknologi Informasi, vol. 11, no. 3, p. 144, 2020, doi: 10.24843/lkjiti.2020.v11.i03.p03.
111
Discussion and feedback