Classification Of Rice Plant Diseases Using the Convolutional Neural Network Method
on
LONTAR KOMPUTER VOL. 12, NO. 2 AUGUST 2021
DOI : 10.24843/LKJITI.2021.v12.i02.p06
Accredited Sinta 2 by RISTEKDIKTI Decree No. 30/E/KPT/2018
p-ISSN 2088-1541
e-ISSN 2541-5832
Classification Of Rice Plant Diseases Using the Convolutional Neural Network Method
A A JE Veggy Priyangkaa1, I Made Surya Kumarab1
aDepartment of Information Technology, Udayana University Badung, Indonesia
1veggypr@gmail.com (corresponding author)
bNetwork Learning Technology, National Central University Taoyuan, Taiwan
Abstract
Indonesia is one of the countries with the population majority of farming. The agricultural sector in Indonesia is supported by fertile land and a tropical climate. Rice is one of the agricultural sectors in Indonesia. Rice production in Indonesia has decreased every year. Thus, rice production factors are very significant. Rice disease is one of the factors causing the decline in rice production in Indonesia. Technological developments have made it easier to recognize the types of rice plant diseases. Machine learning is one of the technologies used to identify types of rice diseases. The classification system of rice plant disease used the Convolutional Neural Network method. Convolutional Neural Network (CNN) is a machine learning method used in object recognition. This method applies to the VGG19 architecture, which has features to improve results. The image used as training and test data consists of 105 images, divided into training and test images. Parameter testing using epoch variations and data augmentation. The research results obtained a test accuracy of 95.24%.
Keywords: Classification, Recognition, Convolutional Network, Rice Diseases
Indonesia is known as the third-largest rice producer and consumer in the world [1]. Data from the Central Bureau of Statistics show that around 35.7 million Indonesians in 2018 are farmers, and some of them live below poverty. Activities that can increase rice productivity will affect millions of rice farmers in Indonesia. It estimates that farmers lose 37% of their rice production annually due to rice pests and diseases [2].
Knowledge of pests and diseases of rice plants is very significant in increasing farmers’ income. Thus, it is necessary to develop a system to recognize and classify rice plant diseases, and hence it can help Indonesian rice farmers. Recognition and classification of rice plant diseases require an accurate system to produce classification data. Types of rice diseases can be identified in several ways, one of which is leaf characteristics.
The first research is Identification Using Convolutional Neural Network (CNN). It consists of different layers which use for identification. The data used is AI crowd with ten leaf diseases, including apple black spot, broadleaf spot, apple needle leaf spot, normal apple, normal bell paper, normal blueberry, normal cherry, normal cherry powder, corn blight, and corn rust. The result is a python-based system with an accuracy of about 78% [3].
The second research is the detection and classification of plant diseases that consists of four main phases. The first phase uses the k-means clustering method. Further, the second phase is masking object area and background. The third phase involves feature extraction by applying the Color Co-occurrence Method (CCM). Last, the fourth phase is leaf disease detection using Neural Network. The Neural Network process is the creation of a training and testing process. Five types of plants with various diseases and healthy leafy plants use in the classification process. This
classification applies RGB image data set. This classification uses the Neural Network classifier, which achieves a precision between 83% and 94% active [4].
Based on the problems above, this research designs an application to classify rice diseases based on leaf color and texture and uses the Convolutional Neural Network method. The use of several methods to improve the classification result accuracy is a fundamental difference between this research and previous studies. On the other hand, the similarity lies in the speed of rice diseases identification. The programming language used is Python with VGG19 pre-trained architecture, which is trained for ImageNet. The usage of large numbers of images and computers with high computing to use CNN using pre-trained models with specific data [5]. This rice disease classification system can classify rice plant diseases accurately.
This research used a dataset of rice diseases obtained from research data of UPT BPTPH Bali Province and https://irri.org. The study consisted of four phases, namely phases of Data Collection, Data Processing, Data Training, and Testing. The data collection phase is the phase of collecting the data needed in this research. The data processing phase was the data adjustment phase from the dataset obtained for use in the Data Training Phase. This research used seven classes of rice disease with 15 images. The image size of each class was 200 x 200 pixels in RGB format. Training data and test data types were in *.jpeg format. The disease types used for the identification process were Bacterial Leaf Streak, Brown Spots, Narrow Brown Spots, Blast, Bacterial Leaf Streak, Fake Burns, and Healthy Rice Leaves. The age of rice plants used in the vegetative and generative phases (45-85 days). The disease image used was on the leaves and seeds (grain).

Figure 1. Image of Rice Plant Disease
The data training phase was for the object detection model with the VGG-19 Convolutional Neural Network architecture using prepared training data in the previous stage. This research made four scenarios to determine the effect of the training data used in each class. The testing phase was the phase to test the performance of each model that has been trained and evaluate the test results. Evaluation of test results was carried out by comparing the results obtained with related previous studies. This research used seven classes of rice plant diseases, and each of them had a total of 15 images. The image was divided into four parts for training and used as a test image. This experiment expected to know how much influence the number of images used in the training process had on the resulting accuracy.
Nowadays, Artificial Intelligence is almost applied in all daily life aspects because it can solve complex problems, such as those mentioned in AI [6]. The popularity of machine learning is increasing following the popularity of Artificial Neural Networks (ANN) [7]. Convolutional Neural Network (CNN) is a deep learning algorithm that is popular in image processing. Generally, it uses to perform object recognition in images. The model used in rice disease classification relies on the Convolutional Network (CNN). CNN processes image data, which will build by the network using information from the executed process [8].
CNN can apply to image and text classification [9]. After design the CNN architecture, the next phase is the training process. Transfer learning (TL) is the reuse of models that have been carried out previously and with different images [10]. A CNN consists of several layers. Based on the
VGG19 architecture, there are four main layers in CNN. However, this research only applied three layers. CNN layer can consist of three types; convolutional layer, pooling layer, and fully connected layer[11].
The Convolution Layer is the first layer of CNN that performs convolution on the output of layers. Furthermore, image processing that used to image the entire potential balance. Subsampling is an activity to reduce the size of the image. In image processing, it is used to repair the position invariance of features. Max pooling is a subsampling method applied to CNN. This method separates the results of the convolution layer into small parts. Thus, it is easy to substitute with a convolutional layer using equivalent steps to the pooling layer [12].
A Fully Connected Layer is a layer where all activation neurons from the previous layer connect to the following layer neurons [13]. The operation at this layer is the same as the convolution operation, which is to perform a linear combination filter operation on the local area. Each activates certain features of the input image [14]. A journal by Lin et al. explains that a convolution layer with a kernel size of 1 x 1 performs the same function as a fully connected layer but retains the spatial character of the data. It makes use of the fully connected layer on CNN does not widely used now. [15].
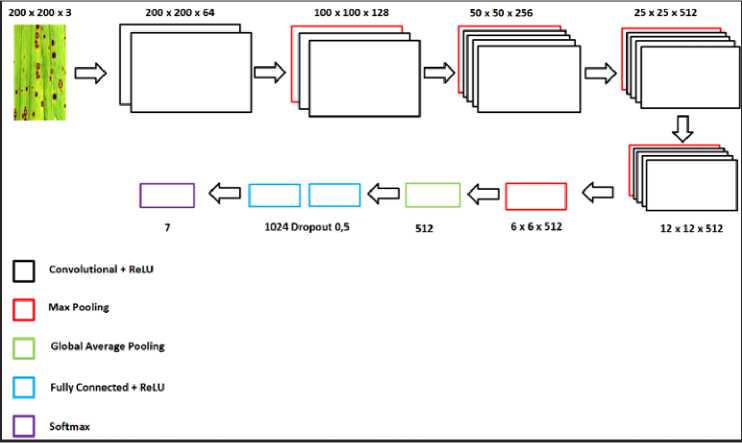
Figure 2. VGG19 Architecture
Visual Geometry Group (VGGNet) is deep learning used for digital processing. VGG19 compresses five convolutional layers before being combined in a multilayer perceptron (MLP). The last layer includes nodes that directly contain the number of classified classes (for some classes) or a sigmoid activation function (for classes that do not more than or equal to two) [16].
During the research process, the dataset is the most important thing [17]. If the dataset provided in the training process is very small, then the accuracy of the results from the neural network model will be less good than the neural network model with more datasets [18]. Data augmentation is needed to solve this problem. Thus, it is essential to provide more variety from the current data set. The results of data augmentation on the image have various images. Thus, the image characteristics are better during the training process [19]. Manual data augmentation can improve the classification results. In this research, the classification process at the training phase applies data augmentation to produce a more varied image [20]. The augmentation methods used are sheer range, zoom range and rotation range, and horizontal flip. Figure 3 is the output of the data augmentation process that has been carried out. The data training process by applying CNN takes place after the augmentation process.
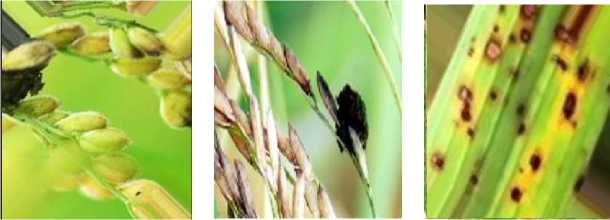
Figure 3. Data Augmentation
The experiments carried out in this research used four experimental scenarios based on variations in the amount of data used and data augmentation. The image data used in this experiment is in RGB form. All images do only resized in size 200x200 pixels for CNN needs, so it does not apply image processing. In this research, each disease class contains 15 images. The image used for the training process must have high accuracy in testing to determine the effect of the image. Test scenarios use different numbers of images in data training and data testing. Each data used in the training and testing steps is different. The CNN pre-trained model used in this research is the VGG19 model. The experimental scenario presents in Table 1.
Table 1. Research Scenario
|
No |
Total Training Total Testing Data Data |
|
1 2 3 4 |
3 12 6 9 9 6 12 3 |
The analysis carries out according to the various parameters of the test data and test data on the training model. The variation used in the data sample consists of 3, 6, 9, and 12 data. Variations of data augmentation used are zoom range, sheer range, horizontal flip, and rotation range, with epochs for each training consisting of 50, 100, and 150 epochs. This scenario uses 70% data for training data and 30% for validation. The results of the first experiment conducted in this research are present in Figure 4.
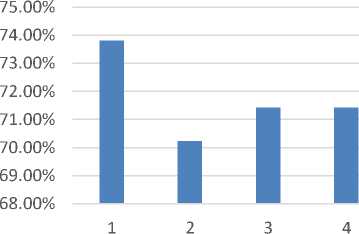
Figure 4. Accuracy of the first scenario
The first experiment uses three training data and 12 test data. The test chart uses data augmentation of the zoom range and 150 epochs, and it obtains an accuracy of 73.81% in the test results. The second test chart uses zoom range, sheer range, and 150 epochs which obtains an accuracy level of 70.24%. Furthermore, it uses data augmentation of the zoom range, shear
range, horizontal flip, and 100 epochs on the chart, and it obtains an accuracy level of 71.43%. Last, the fourth test chart uses data augmentation of the zoom range, shear range, horizontal flip, rotation range, and 150 epochs, and it obtains an accuracy level of 71.43% in the test results.
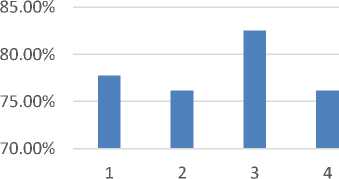
Figure 5. Accuracy of the second scenario
The second experiment uses six training data and nine test data. The first chart of the test steps uses data augmentation of the zoom range and 150 epoch which obtains an accuracy level of 77.78%. The second chart of the test uses data augmentation the zoom range, shear range, and 50 epochs, and it obtains an accuracy level of 76.19%. Data augmentation used in the third graph test consists of the zoom range, shear range, horizontal flip, and 100 epochs, obtains an accuracy rate of 82.54%. Data augmentation consists of the zoom range, shear range, horizontal flip, rotation range, and 150 epochs used in the fourth chart of the test. The test results obtained an accuracy rate of 76.19%.
82.00%
81.00%
80.00%
79.00%
78.00%
77.00%
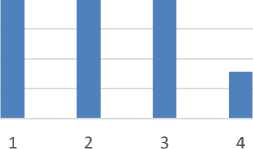
Figure 6. Accuracy of the third scenario
The third experiment uses nine training data and six test data. The first test chart uses data augmentation of the zoom range and 150 epochs, which obtains an accuracy rate of 80.95%. The data augmentation used in the second chart of the test is the zoom range, shear range, and 150 epochs, and it obtains an accuracy rate of 80.95%. Data augmentation of the zoom range, shear range, horizontal flip, and 100 epochs used in the third chart of the test obtains an accuracy rate of 80.95%. Data augmentation used in the fourth graph consists of the zoom range, shear range, horizontal flip, rotation range, and 150 epochs which obtained an accuracy rate of 78.57%.
100.00%
95.00%
90.00%
85.00%
80.00%
1234
-
Figure 7. Accuracy of the fourth scenario
The fourth experiment uses 12 training data and three test data. The first test step chart uses data augmentation consisting of the zoom range and 100 epochs which obtain an accuracy rate
of 90.48%. The second chart of the test uses data augmentation consisting of the zoom range, shear range, and 150 epochs which obtains an accuracy rate of 95.24%. The third graph testing phase uses data augmentation of the zoom range, shear range, horizontal flip, and 100 epochs which obtains an accuracy rate of 90.48%. The fourth graph testing phase uses data augmentation consisting of the zoom range, shear range, horizontal flip, rotation range, and 150 epochs obtained an accuracy rate of 85.71%. The maximum result from using this dataset is achieved in the fourth scenario that uses 12 training data and three test data. This research can develop using more datasets and various categories of rice diseases. The best four graphs in each scenario show that the amount of training data affects the test accuracy. The scenario using 12 training data obtains the best accuracy shows that the convolutional neural network method requires many training images to get better results in the testing step. On the other hand, the three training data images used in the testing process have the worst performance in the trained model. We suspect that the amount of training data is not compatible with the test dataset because the convolutional neural network requires large data manual labeled data for the training process.
The fourth scenario model was carried out on rice disease with an accuracy of 95.24% using 100 epochs and using data augmentation of the zoom range and shear range. Classification of rice diseases using the CNN method in two phases: the training and testing process. In this research, each class used 15 disease image data for the training and testing process. Before processing the training data, the training image processing is carried out by doing data augmentation to add images from each class to increase the accuracy obtained. The training data will be stored and then used for the testing data process.
References
-
[1] B. P. Statistik, “Persentase Penduduk Miskin 2017,” 2017.
-
[2] O. Russakovsky et al., “ImageNet Large Scale Visual Recognition Challenge,” International Journal Computer Vision., vol. 115, no. 3, pp. 211–252, 2015, doi: 10.1007/s11263-015-0816-y.
-
[3] Mushtaq Adnan, Karol Ali, and G. Drushti, “Plant Disease Detection using CNN & Remedy,” pp. 622–626, 2019, doi: 10.15662/IJAREEIE.2019.0803014.
-
[4] H. B. Prajapati, J. P. Shah, and V. K. Dabhi, “Detection and classification of rice plant diseases,” Intelligent Decision Technology., vol. 11, no. 3, pp. 357–373, 2017, doi:
10.3233/IDT-170301.
-
[5] M. Mehdipour Ghazi, B. Yanikoglu, and E. Aptoula, “Plant identification using deep neural networks via optimization of transfer learning parameters,” Neurocomputing, vol. 235, no. August 2016, pp. 228–235, 2017, doi: 10.1016/j.neucom.2017.01.018.
-
[6] R. Kamble and D. Shah, “Applications of Artificial Intelligence in Human Life,” International Journal Research -GRANTHAALAYAH, vol. 6, no. 6, pp. 178–188, 2018, doi:
10.29121/granthaalayah.v6.i6.2018.1363.
-
[7] Y. Adiwinata, A. Sasaoka, I. P. Agung Bayupati, and O. Sudana, “Fish Species Recognition with Faster R-CNN Inception-v2 using QUT FISH Dataset,” Lontar Komputer : Jurnal Ilmiah Teknolologi Informasi., vol. 11, no. 3, p. 144, 2020, doi: 10.24843/lkjiti.2020.v11.i03.p03.
-
[8] S. Sakib, Ahmed, A. Jawad, J. Kabir, and H. Ahmed, “An Overview of Convolutional Neural Network: Its Architecture and Applications,” ResearchGate, no. November, 2018, doi: 10.20944/preprints201811.0546.v1.
-
[9] I. M. Mika Parwita and D. Siahaan, “Classification of Mobile Application Reviews using Word Embedding and Convolutional Neural Network,” Lontar Kompututer : Jurnal Ilmiah Teknologi Informasi., vol. 10, no. 1, p. 1, 2019, doi: 10.24843/lkjiti.2019.v10.i01.p01.
-
[10] S. K. G. Manikonda and D. N. Gaonkar, “A Novel Islanding Detection Method Based on Transfer Learning Technique Using VGG16 Network,” 1st IEEE International Conference Sustainable Energy Technologies and System. ICSETS 2019, vol. 6, pp. 109–114, 2019, doi: 10.1109/ICSETS.2019.8744778.
-
[11] C. G. Pachón-Suescún, J. O. Pinzón-Arenas, and R. Jiménez-Moreno, “Detection of scratches on cars by means of CNN and R-CNN,” International Journal Advanced Science, Engineering and Information Technology., vol. 9, no. 3, pp. 745–752, 2019, doi:
10.18517/ijaseit.9.3.6470.
-
[12] S. Arivazhagan and S. V. Ligi, “Mango Leaf Diseases Identification Using Convolutional Neural Network,” International Journal of Pure and Applied Mathematics., vol. 120, no. 6, pp. 11067–11079, 2018.
-
[13] D. Jaswal, S. V, and K. P. Soman, “Image Classification Using Convolutional Neural Networks,” International Journal of Scientific and Engineering Research., vol. 5, no. 6, pp. 1661–1668, 2014, doi: 10.14299/ijser.2014.06.002.
-
[14] M. Sayed and F. Baker, “Thermal face authentication with Convolutional Neural Network,” Journal of Computer Science., vol. 14, no. 12, pp. 1627–1637, 2018, doi:
10.3844/jcssp.2018.1627.1637.
-
[15] K. He, X. Zhang, S. Ren, and J. Sun, “Deep residual learning for image recognition,” Proceedings IEEE Computer Society Conference on Computer Vision Pattern Recognition., vol. 2016-Decem, pp. 770–778, 2016, doi: 10.1109/CVPR.2016.90.
-
[16] M. A. H. Abas, N. Ismail, A. I. M. Yassin, and M. N. Taib, “VGG16 for plant image classification with transfer learning and data augmentation,” International Journal of Engineering and Technology (UAE)., vol. 7, no. 4, pp. 90–94, 2018, doi:
10.14419/ijet.v7i4.11.20781.
-
[17] K. K. Lai, “An Integrated Data Preparation Scheme for Neural Network Data Analysis,” IEEE Transactions on Knowledge and Data Engineering., vol. 18, no. 2, pp. 217–230, 2006, doi: 10.1109/TKDE.2006.22.
-
[18] C. Shorten and T. M. Khoshgoftaar, “A survey on Image Data Augmentation for Deep Learning,” Journal of Big Data, vol. 6, no. 1, 2019, doi: 10.1186/s40537-019-0197-0.
-
[19] A. Mikołajczyk and M. Grochowski, “Data augmentation for improving deep learning in image classification problem,” 2018 International Interdisciplinary PhD Workshop IIPhDW 2018, no. May, pp. 117–122, 2018, doi: 10.1109/IIPHDW.2018.8388338.
-
[20] A. P. Parente, M. B. de Souza, A. Valdman, and R. O. Mattos Folly, “Data augmentation applied to machine learning-based monitoring of a pulp and paper process,” Processes, vol. 7, no. 12, 2019, doi: 10.3390/PR7120958.
129
Discussion and feedback