Recognition of The Baby Footprint Characteristics Using Wavelet Method and K-Nearest Neighbor (K-NN)
on
LONTAR KOMPUTER VOL. 12, NO. 1 APRIL 2021
DOI : 10.24843/LKJITI.2021.v12.i01.p05
Accredited Sinta 2 by RISTEKDIKTI Decree No. 30/E/KPT/2018
p-ISSN 2088-1541
e-ISSN 2541-5832
Recognition of The Baby Footprint Characteristics Using Wavelet Method and K-Nearest Neighbor (K-NN)
I Made Aris Satia Widiatmika a1, I Nyoman Piarsa a2, Arida Ferti Syafiandinib3
aDepartment of Information Technology, Udayana University Bukit Jimbaran, Bali, Indonesia 1ariswidiatmika@student.unud.ac.id 2manpits@unud.ac.id
bDepartment of Library and Information Science, Yonsei University 50 Yonsei-ro, Seodaemun-gu Seoul 03722, Korea 3afsyafiandini@yonsei.ac.kr
Abstract
Individual recognition using biometric technology can be utilized in creating security systems that are important in modern life. The individuals recognition in hospitals generally done by conventional system so it makes more time in taking identity. A newborn baby will proceed an identity tagging after birth process is complete. This identity using a bracelet filled with names and ink stamps on paper that will be prone to damage or crime. The solution is to store the baby's identity data digitally and carry out the baby's identification process. This system can increase safety and efficiency in storing a baby's footprint image. The implementation of baby's footprint image identification starting from the acquisition of baby's footprint image, preprocessing such as selecting ROI size baby's footprint object, feature extraction using wavelet method and classification process using K-Nearest Neighbor (K-NN) method because this method has been widely used in several studies of biometric identification systems. The test data came from 30 classes with 180 images test right and left baby's footprint. The identification results using 200x500 size ROI with level 4 wavelet decomposition get recognition results with an accuracy of 99.30%, 90.17% precision, and 89.44% recall with a test computation time of 8.0370 seconds.
Keywords: Footprint, Feature Extraction, Wavelet, K-Nearest Neighbor.
Information technology has developed in all fields, one of which is in the health sector, such as using biometric technology. Newborn babies generally already have an identity marker using a footprint and a bracelet with a name on the baby's feet to identify standard operating procedures for infant safety. The identification system using conventional baby footprints using ink and paper media. This allows human error to occur. Systems that are still conventional should be replaced with digital biometric recognition systems to recognize individuals optimally and avoid data loss or damage.
Biometrics is a technology used to create identification and security systems that are used in everyday life. Biometrics uses data from parts of the human body with special characteristics that make it difficult for others to imitate or steal. The baby's footprint is one part of the body that can be used in an individual identification system. Research on baby feet is rarely used as objects in the identification system, so research is necessary. The main features found on the baby's feet' soles (including lines, protrusions, small dots, single dots, and textures) can be used as feature data to create a baby identification system.
Research using the baby's footprint aims to improve what was previously conventional into a digital system capable of storing digital data and identifying babies in hospitals. The baby's footprint identification system goes through the acquisition stage using a smartphone camera to get an image of the research object. The camera produces different image orientation images depending on the baby's footprint captured [1]. The method feature extraction Wavelet provides
time information and compresses data without removing redundant data by reducing computation size and time [2]. The process of taking features with Wavelet using an image decomposition process produces a sub-band image, where the components are produced by decreasing the level of decomposition. Image decomposition is done by passing high-frequency and low-frequency signals, which produce the approximate coefficient values, horizontal, vertical, and diagonal. Discrete Wavelet Transform is a more commonly used method because it is easy to implement, and the computation time is shorter.
The classification K-Nearest Neighbor method is a method for determining the class, which is done by looking for the K closest neighbors with the test image and selecting the prediction class with the highest number [3]. The number of nearest neighbor's data can be determined to get the best calcification results. The purpose of the K-Nearest Neighbor algorithm is to classify an object based on the learning data model, which is used to determine the class of objects that are not yet known by matching feature values. The method is very influential on the accuracy of the identification of a system. Besides that, a parameter is used, namely ROI (Region of Interest) in this study. The purpose of the ROI parameter is to test the effect of the ROI measure on the accuracy obtained in the identification system. The Wavelet method and the K-Nearest Neighbor (K-NN) method have been widely used to make image identification systems and research related to biometric image processing.
Research using the feature Wavelet extraction method and the similar K-NN calcification method have been carried out. The study was conducted by Armanda using the Method Wavelet and classification K-Nearest Neighbor (K-NN) on the footprint object to identify someone's identity. The test results show the best accuracy decomposition Level 4 using the parameter K = 1 with the approach Euclidean Distance of 98% using the system autorotate. The computation time produced by each image's average time in the feature extraction process Haar Wavelet is 2.9796 seconds and 0.00229 seconds in the classification process [4]. The following research conducted by Adinda Maulida discusses the introduction of individuals using adult women's soles and men's feet with the feature extraction method. Discrete Wavelet Transform (DWT) and use kernel SVM classification algorithm Polynomial multiclass One Against One has the highest accuracy of 72% with the fastest computation time of 66.7141 seconds [5].
Based on these studies, a study was made using the Wavelet feature extraction method and the K-Nearest Neighbor classification method in making a baby's recognition system because seeing the standard hospital operating procedures for newborns is still conventional, it is still inefficient and still exists. Several cases of abduction in infants. This study aims to create a system for identifying infant identity in tackling criminal acts such as kidnapping or swapping babies during childbirth and creating a digital system that previously still used footprint ink on paper that is easily damaged or human error. The application of individual recognition using the baby's footprint is expected to solve the problems previously faced.
Character Recognition Baby's Footprint Using Feature Extraction Method Wavelet and the Classification K-Nearest Neighbor (K-NN) through two main stages, namely the training dataset and testing dataset stage. This stage is shown in Figure 1.

Figure 1. System Overview
Figure 1. is an overview of the baby's foot recognition system. The system has several process modules: the acquisition module, preprocessing module, feature extraction module, and classification module. The acquisition process resulted in a dataset of the baby's feet obtained divided into 2, training data totaling 420 images of right and left feet, test data totaling 180 images of right and left feet. The following process is preprocessing starting from grayscaling, which is converting an RGB image into an image that only has a gray level color, then carried cropping is starting by looking for the value threshold so that objects with the background can be distinguished for cutting the Region of Interest (ROI) obtained based on the percentage of the object specified After that, the image size normalization process (is carried out resize) to uniform the size pixel of the image cropped and speed up the computation process. The next feature extraction process is an important step in pattern classification and aims to extract relevant information to characterize each class [6]. This process uses the method Wavelet with the level best decomposition. This process uses the Wavelet method with the best decomposition level. The results obtained by feature extraction used system reference data to distinguish one foot's owner from another. The classification is divided into two processes, namely the training process and the testing process. The training process is a process of training the feature value data obtained in the feature extraction process using the K-Nearest Neighbor (K-NN) method which produces a file template K-NN used in the process of matching the baby's feet. The testing process matches the value of the special features obtained in the test image against the template K-NN file obtained during training to produce output in the form of the name of the owner of the baby's feet. There are several test scenarios carried out to get the best results from the introduction of the soles of the feet, namely testing the level decomposition of the method wavelet, measuring ROI on the texture of the baby's feet, determining the K-NN classification parameter value, and the effect of adding a rotational image to the training dataset.
Feet The human foot has a strong and complex mechanical structure. The foot consists of 26 bones, 33 joints and consists of hundreds of muscles, tendons, and ligaments. The soles of the feet are located on the bottom of the human skin. The skin on the feet' soles has neither hair nor pigment, so the pore concentration of sweat is high. The baby's footprint has creases that form during embryogenesis and do not have sebaceous glands [7]. From the toes' tips to the heels, the baby feet' skin has fine lines protruding from each other like grooves that form a particular structure. The fine lines are difficult to change since a person is born but can experience a change in size that gets bigger and can change due to special treatment, such as scratching or burning. The baby footprint used in the study were obtained from 30 babies with a total of 600 images of the right and left feet with a resolution of 500x900 pixels. Examples of images of baby's feet used in this study can be seen in Table 1.
Table 1. Baby's Footprint Image Documentation Data

Table 1 is an example of an image acquisition result that has been taken and then edited to improve image quality, speed up the computation process and reduce the use of storage space. The stage after image acquisition is preprocessing, such as image cropping and grayscale image conversion, which is the initial process in classifying objects that aim to prepare the image to be structured [8].
Cropping is a process of cutting an image at certain coordinates in an area in the image. The process is cropping very important to do before the image is processed to be characterized, to get parts of the image considered important and have a lot of information. The process of cutting the image part uses two coordinates, namely the initial coordinate of the cutting result and the final coordinate, which is the endpoint of the cut. Coordinates form a rectangular shape where each pixel will be stored in a new image [9]. The result cropping image can be seen in Figure 2.

Figure 2. Result Cropping Image
Figure 2 is an image resulting from the process of cropping. The ROI measurement used is determined by the width and height of the baby's foot object. The cropped image has a size of 200x500 pixels.
image grayscale is a type of image with a pixel value. Image grayscale has an intensity of 0 to 255. The value 0 in the image grayscale represents black, and the value 255 represents white. The storage space for images grayscale is economical because it only requires an 8-bit pixel storage value. The following is a technique for converting RGB colors to a grayscale shown in Equation (1) [10].
G = (0.229 x R) + (0.587 x G) + (0.114 xB) (1)
Note:
G = Image after conversion to image gray
R = Image on layer Red
G = Image on layer Green
B = Image on layer Blue
Result cropping image can be seen in Figure 2.
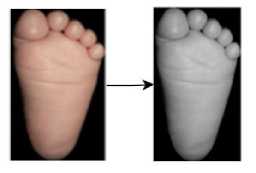
Figure 3. Result Grayscale Image
Figure 3 is an image converted from an RGB image to an image grayscale. The conversion process is carried out to make it easier to process because it only has one intensity value for each pixel. The intensity of the image value grayscale ranges from 0 to 255. The value 0 represents black, and the value 255 represents white so that the color between them is gray.
There are various types of wavelets, including transformations in Discrete Wavelet Transform (DWT). Discrete Wavelet Transform (DWT) is a multilevel decomposition technique that localizes
features in space and frequency. The process at the DWT decomposition level produces four subparts of the image. The image's four sub-sections are obtained through the low-pass and high-pass filters that work through the image rows and columns. Decomposition Wavelet produces four new images, namely low-resolution approximation (LL), horizontal (HL), vertical (LH), and diagonal (HH) detail component. The four subsections' results can be recombined to obtain the original image before being decomposed [11]. In the following, we can see the 2-dimensional signal decomposition process at Level 1 as follows. The 2-dimensional signal decomposition process at Level 1 can be seen in Figure 4.

Figure 4. Decomposition Discrete Wavelet Transform Level 1
Figure 4 is a picture of the stage of the decomposition process at Level 1, which produces four pieces of sub-band new, namely:
-
1. LL: Sub-group low transformation results of rows and columns (Approximation).
-
2. HL: The sub-group high from the transformations on the line, and the sub-group low
of its column transformations. (Horizontal).
-
3. LH: The sub-group low of the transformed lines and the sub-group high of its column
transformations. (Vertical).
-
4. HH: Sub-group high on the results of the transformation of rows and columns
(Diagonal).
Image coefficients approximation, horizontal, vertical, and diagonal, has the foot's characteristic features that can be used for identification and verification persons. The decomposition process of the foot image at Level 1 can be seen in Figure 5.
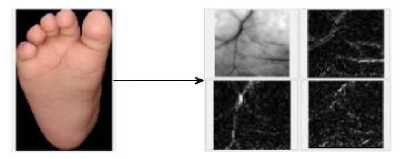
Figure 5. Decomposition Results Level 1
Figure 5 illustrates the results of the decomposition process at Level 1 image of baby's feet, based on the image above the results of each image, namely the approximation of the LL sub-band, the LH horizontal sub-band. The vertical HL sub-band and the diagonal HH sub-band [12].
The classification process aims to classify the data obtained from the feature extraction results and then match them to new data to obtain predictive results. K-Nearest Neighbor will classify object features based on its closest neighbors [13]. K-Nearest Neighbor is said to be a lazy learner because it is based on learning. The K-Nearest Neighbor modeling process can be delayed until it is needed to classify the test data samples. The results of training data characteristics are
explained by the numerical attributes on n-dimensions and stored in n-dimensional space. When testing the test data (unknown class label), the algorithm K-Nearest Neighbor looks for the training data that is closest to the test data. The proximity value search is usually calculated based on the metric distance. The distance measurement will be calculated on the basis Euclidean Distance is represented in the following Equation (2) [14].
D(a, b) = √∑kn=1(ak - bk )2 (2)
Note:
D(a,b) = Euclidean Distance ak = Test Data
n = Dimension of data bk = Training data

Figure 6. K-NN Classification Results
Figure 6 is a display of the results of the testing process. The table above shows the results of the image classification tested sequentially down so that it is known the number of images that are correctly classified based on the class.
Results and discussion describe the application trial and test analysis's appearance that produces the best level of accuracy in the Infant Foot Recognition System. Tests carried out on the system using sample data totaling 420 images and testing data totaling 180 images.
The application trial of the Character Recognition of Baby's Foot Lines is done after completing the system design. The application interface has several main buttons: choose the image, preprocessing, decomposition, show values, image identification, and probability.

Figure 7. View Open Image
Figure 7 displays the test results open image. The test image that has been prepared is then selected to be displayed. The application successfully displays the image of the foot that has been selected by the user along with the name of the file image to be displayed on the main page of the application.
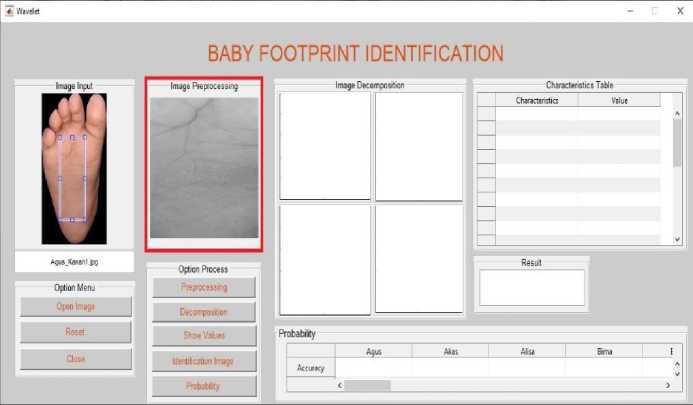
Figure 8. Display Preprocessing Image
Figure 8 is an image display of the process preprocessing in the Baby's Foot Recognition Application. The initial stage of the process preprocessing starts from determining the ROI of the test image, then resizing it to equalize the image size after cropping, then the results are converted into image grayscale. The process results are preprocessing displayed in the box image preprocessing that has been prepared on the main page of the application.

Figure 9. Image Decomposition Display
Figure 9 is a display of the result of image decomposition with the level of decomposition that has been determined in the system. The image is preprocessed decomposed using the method Wavelet. To get the value of its special characteristics, the decomposed image is displayed in 4 boxes image decomposition that has been prepared on the main page of the application. The image in the upper left corner is an approximation image, in the upper right corner is a horizontal image, in the lower-left corner is a vertical image and in the lower right corner is a diagonal image. The approximate image is a decomposition image that stores many characteristics of the baby's footprint.
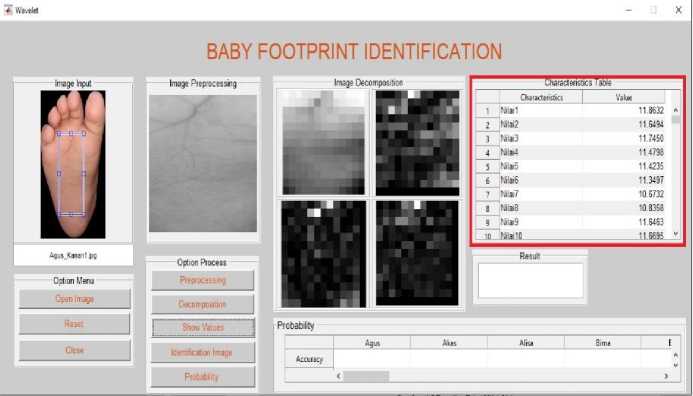
Figure 10. Display Feature Value Table
Figure 10 is a display of the feature values displayed in a characteristic table. The approximate image of the decomposition results has a coefficient value which is used as a special characteristic of the baby's feet being tested.

Figure 11. Display of Identification Results
Figure 11 displays the recognition results from the image being tested in the form of the name of the owner of the baby's feet. The test image recognition process results that have been carried out, namely Agus, are displayed in the column results that have been prepared on the main page of the application.
* Wmiet
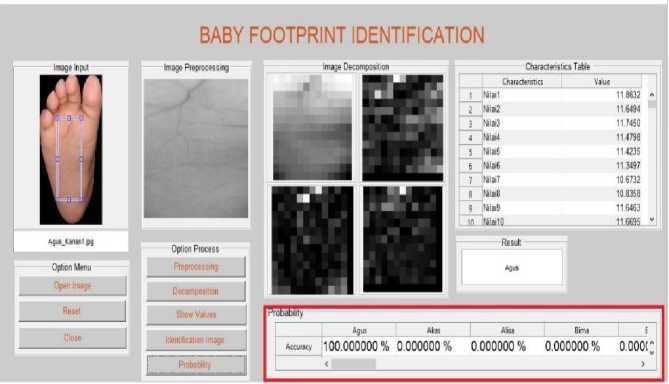
Figure 12. Display Probability Results
Figure 12 displays the results of the prediction of the test image on table probability which shows that namely, Agus class is a class that is predicted as the result of having baby's feet tested with a 100% percentage.
Method Wavelet has the function of image decomposition, which aims to reduce the image's size based on the level specified that the characteristic values obtained more efficiently. The level used in image decomposition produces different features, so testing at each level is needed to get better recognition results. This study tested the decomposition at level 1 to level 6 with the number of images tested, namely 180 images with an ROI size of 200x200 pixels and a value of K = 1, shown in Table 2.
Table 2. Test Results for the Effect of Level Decomposition Wavelet
|
Level Decomposition Wavelet |
Accuracy |
Precision |
Recall |
|
Level 1 |
98.96% |
87.53% |
84.44% |
|
Level 2 |
99.00% |
87.26% |
85.00% |
|
Level 3 |
99.00% |
87.87% |
85.00% |
|
Level 4 |
99.11% |
89.19% |
86.67% |
|
Level 5 |
98.93% |
85.65% |
83.89% |
|
Level 6 |
98.41% |
78.91% |
76.11% |
Test results show the results of the test comparison using the decomposition parameter. Level Wavelet on the baby's foot image produces the highest accuracy of 99.11%, with a precision of 89.19% and a recall of 86.67% for decomposition. Wavelet Level 4. The test results prove that the higher the level of decomposition, the fewer characteristic values are obtained. The more the number of features used is not directly proportional to the accuracy of precision and recall obtained and vice versa if the feature value is too little.
ROI is determining the object taken at the stage cropping to be processed in preprocessing stage. The ROI size is generally square and can then be adjusted to get more texture from the baby's feet' soles. Testing with the ROI parameter is carried out on the decomposition Wavelet Level 4 with image sizes 200X200, 200x300, 200x400, 200x500, and 200x600 pixels with the number of images tested, namely 180 images at wavelet decomposition level 4 and the value of K = 1 which can be seen in Table 3.
|
Table 3. Test Results for the Effect of ROI Size ROI | |||
|
Size ROI (Pixel) |
Accuracy |
Precision |
Recall |
|
200x200 |
99.11% |
89.19% |
86.67% |
|
200x300 |
99,22% |
90,46% |
88,33% |
|
200x400 |
99,26% |
90,44% |
88,89% |
|
200x500 |
99,30% |
90,17% |
89,44% |
|
200x600 |
99,22% |
89,78% |
88,33% |
The test results show the comparison of the test results using the ROI parameter in the baby's foot recognition system, with the highest accuracy value of 99.30% with a precision of 90, 17%, and a recall of 89.44% on an ROI measuring 200x500. The test results show that the greater the ROI, the greater the accuracy obtained, the value of the region used should not be on the background so as not to affect the feature extraction process.
Image recognition using the K-NN parameter is the determination of the value K neighbor in the K-NN method. K's value is used as a vote for the prediction results of the closest class to the image being tested. Testing with the K parameter is carried out to determine the K value, which is accurate in recognizing the owner of the baby's feet. The K parameter tested values were 1, 3, 5, 7 and 9 with the number of images tested, namely 180 images with an ROI size of 200x500 pixels and level 4 wavelet decomposition, which can be seen in Table 4.
Table 4. Results of Testing the Influence of K Parameters
|
Value K Classification K-NN |
Accuracy |
Precision |
Recall |
|
K=1 |
99,30% |
90,17% |
89,44% |
|
K=3 |
99,04% |
87,92% |
85,56% |
|
K=5 |
98,56% |
81,38% |
78,33% |
|
K=7 |
98,41% |
80,21% |
76,11% |
|
K=9 |
98,07% |
77,55% |
71,11% |
The test results show the comparison of the test results using the K-NN parameter, which results in a decreased percentage of accuracy compared to the value of K = 1, which has been used in previous tests. This result is due to the characteristic value obtained in the feature extraction process wavelet in the training image dataset is not much different between classes. The greater the number of K values used will reduce the system's ability to determine the test image class's prediction.
Recognition using rotation parameters is a test that is done by adding the training dataset to be 2x the previous number with an image that has been rotated clockwise. Testing with rotation parameters was carried out to determine the effect of adding a rotational image to the training dataset with accuracy in recognizing the baby's feet' owner. The tilt angle used from the rotational parameter tested is 10 °, 20 °, and 30 ° with the number of images tested, 180 images with 200x200 pixel ROI size, level 4 wavelet decomposition K = 1 value which can be seen in Table 5.
Table 5. Testing Results of the Effect of Image Rotations
|
Rotation |
Accuracy |
Precision |
Recall |
|
10° |
99,22% |
89,33% |
89,33% |
|
20° |
99,26% |
91,07% |
91,07% |
|
30° |
99,30% |
91,37% |
91,37% |
The results obtained indicate that the addition of a training dataset in a rotated image does not provide a better accuracy improvement than the test. It was previously done because the image
trained with a certain slope produces a different feature value from the normal test image so that the testing process does not provide a change inaccuracy.
Research by Adinda Maulida with an infant foot recognition system has similarities using the feature extraction method, Wavelet. Still, the difference between the research objects used is the soles of adult men's and women's feet. The acquisition process in this study uses a scan tool with the number of images as many as 50 data, which is divided into 25 training data and 25 test data. The training data and test data have five classes, and each class contains five pieces of data. The preprocessing process in this study includes converting the image to grayscale, cropping the ROI in the area under the big toe, and converting the image histogram equalization. Feature extraction using the method Discrete Wavelet Transform (DWT) with decomposition Level 2in the LL sub-band and the method used to identify the soles of the feet is the SVM multiclass One Against One kernel type Polynomial with the highest accuracy of 72% and computation time of 66.72 seconds[5]. While the research carried out on the baby's foot recognition system went through the acquisition process using camera smartphone with the results obtained by 30 different baby classes, with the amount of right and left foot image data totaling 600 images then divided into 480 training image datasets and 180 test image datasets. The process preprocessing carried out is converting the image to grayscale, cropping using the ROI measure, which takes most of the baby's foot texture and normalizes the image size. The extraction of the features of the baby's feet using the method Discrete Wavelet Transform (DWT) type of Haar with decomposition Level 4in the LL sub-band and the method used to identify the sole of the baby's feet K-Nearest Neighbor (K-NN) with parameter K = 1 gets an accuracy percentage of 99.30%, precision 90.17% and recall 89.44%with a computation time of 8.0370 seconds.
The final results of the research carried out on the application of baby's foot recognition through the acquisition process using a camera smartphone with the results obtained 30 different baby's classes, with the amount of right and left foot image data totaling 600 images then divided into 480 training image dataset and image dataset test 180 pieces. The process preprocessing carried out is converting the image to grayscale, cropping using the ROI measure, which takes most of the baby's foot texture and normalizes the image size. The best test results were obtained using an ROI size of 200x500 by taking the texture of the baby's feet, which then performed feature extraction using the method Discrete Wavelet Transform (DWT) type of Haar with decomposition Level 4in the LL sub-band and the method for identifying baby's feet using K-Nearest Neighbor (K-NN) with parameter K = 1 gets an accuracy percentage of 99.30%, precision 90.17% and recall 89.44% with a testing computation time of 8.0370 seconds.
References
-
[1] G. Ngurah Sanditya Riantama, I. Nyoman Piarsa, And G. Made Arya Sasmita, “Pengaruh Segmentasi Terhadap Hasil Rotasi Citra Menggunakan Metode Minimum Area Rectangle,” Jurnal Ilmiah Merpati (Menara Penelitan Akademik Teknologi Informasi), Vol. 7, No. 2, P. 95, 2019, Doi: 10.24843/Jim.2019.V07.I02.P01.
-
[2] M. Manjunath, "Biorthognal, Symlet & Discrete Meyer Wavelet Based Palm Print Recognition System," Perspectives in Communication, Embedded-Systems Signal-Processing, Vol. 2, No. 7, Pp. 319–323, 2018.
-
[3] N. L. W. S. R. Ginantra, “Deteksi Batik Parang Menggunakan Fitur Co-Occurence Matrix Dan Geometric Moment Invariant Dengan Klasifikasi Knn,” Lontar Komputer Jurnal Ilmiah Teknologi Informasi, Vol. 7, No. 1, P. 40, 2016, Doi: 10.24843/Lkjiti.2016.V07.I01.P05.
-
[4] Armanda Nur Fadhlillah, “Analisis Dan Implementasi Klasifikasi K-Nearest Neighbor (K-Nn) Pada Sistem Identifikasi Biometrik Telapak Kaki Manusia,” Telkom University Collection, Vol. 2, No. 2, Pp. 2876–2883, 2015.
-
[5] Y. N. F. Adinda Maulida, Rita Magdalena, “Implementasi Metode Discrete Wavelet
Transform (DWT) Dalam Sistem Identifikasi Telapak Kaki Manusia dengan Klasifikasi Support Vector Machine (SVM),” Prosiding Seminar Nasional Aplikasi Sains & Teknologi (SNAST) 2018, No. September, 2018.
-
[6] Novar Setiawan And I. M. Suwija Putra, “Klasifikasi Citra Mammogram Menggunakan Metode K-Means, Glcm, Dan Support Vector Machine (Svm),” Jurnal Ilmiah Merpati (Menara Penelitian Akadademik Teknologi Informasi), Vol. 6, No. 1, P. 13, 2018, Doi:
10.24843/Jim.2018.V06.I01.P02.
-
[7] M. Melina, Dr.Ir.Bambang Hidayat, Suci Auliya, St., “Pengklasifikasian Tinggi Dan Berat Badan Manusia Berdasarkan Citra Telapak Kaki Menggunakan Metode Discrete Wavelet Transform (Dwt) Dan Support Vector Machine-Multiclass (Svm-Mc),” Telkom University, Vol. 5, No. 3, Pp. 5245–5257, 2018.
-
[8] I. G. A. Socrates, A. L. Akbar, M. S. Akbar, A. Z. Arifin, And D. Herumurti, “Optimasi Naive Bayes Dengan Pemilihan Fitur Dan Pembobotan Gain Ratio,” Lontar Komputer Journal Ilmiah Teknologi Informasi, Vol. 7, No. 1, P. 22, 2016, Doi: 10.24843/Lkjiti.2016.V07.I01.P03.
-
[9] F. Muwardi And A. Fadlil, “Sistem Pengenalan Bunga Berbasis Pengolahan Citra Dan Pengklasifikasi Jarak,” Jurnal Ilmiah Teknik Elektro Komputer Dan Informatika, Vol. 3, No. 2, P. 124, 2018, Doi: 10.26555/Jiteki.V3i2.7470.
-
[10] M. A. R. Muhammad Rafi Farhan, Agus Wahyu Widodo, “Ekstraksi Ciri Pada Klasifikasi Tipe Kulit Wajah Menggunakan Metode Haar Wavelet,” Jurnal Pengembangan Teknologi Informasi dan Ilmu Komputer, Vol. 3, No. 3, Pp. 2903–2909, 2019.
-
[11] E. P. P. Ezy Claudia Nivsky, Ernawati, “Aplikasi Biometrika Pencocokan Citra Daun Telinga Berbasis Tekstur Dan Bentuk Menggunakan Metode Transformasi Wavelet Dan Chain Code,” Rekursif Jurnal Informatika, Issn : 2303-0755, Vol. 4, No. 3, Pp. 325-333, 2016.
-
[12] L. K. P. B. Mamta Dewangan, "Palmprint Recognition Using Pca And Dwt," Journals for International Shodh in Engineering and Technology, Vol. 01, No. 06, Pp. 1–6, 2016.
-
[13] I. W. A. S. Darma, "Implementation Of Zoning And K-Nearest Neighbor In Character Recognition Of Wrésastra Script," Lontar Komputer Jurnal Ilmiah Teknologi Informasi, Vol. 10, No. 1, P. 9, 2019, Doi: 10.24843/Lkjiti.2019.V10.I01.P02.
-
[14] A. A. Syafitri Hidayatul Aa, Yuita Arum S, “Seleksi Fitur Information Gain Untuk Klasifikasi Penyakit Jantung Menggunakan Kombinasi Metode K-Nearest Neighbor Dan Naïve Bayes,” Jurnal Pengembangan Teknologi Informasi Dan Ilmu Komputer, Vol. 2, No. 9, Pp. 2546– 2554, 2018.
52
Discussion and feedback