End User Satisfaction for Location Health Service Application with Analysis of Task Technology Fit
on
LONTAR KOMPUTER VOL. 11, NO. 2 AUGUST 2020
DOI : 10.24843/LKJITI.2020.v11.i02.p02
Accredited B by RISTEKDIKTI Decree No. 51/E/KPT/2017
p-ISSN 2088-1541
e-ISSN 2541-5832
End User Satisfaction for Location Health Service Application with Analysis of Task Technology Fit
Linda Perdana Wanti1*, Hijriah Fajar Muhammad Insan2, Nur Wachid Adi Prasetya3
aDepartment of Infomatics (D3 Teknik Informatika, Politeknik Negeri Cilacap) Jln. Dr. Soetomo No.1 Sidakaya, Cilacap, JawaTengah, Indonesia 1*linda_perdana@pnc.ac.id (Corresponding author)
bDepartment of Informatics (S1 Teknik Informatika, STMIK Amikom Purwokerto) Jln. Letjen. Pol. Sumarto, Banyumas, Jawa Tengah, Indonesia
cDepartment of Infomatics (D3 Teknik Informatika, Politeknik Negeri Cilacap) Jln. Dr. Soetomo No.1 Sidakaya, Cilacap, JawaTengah, Indonesia 3nwap.pnc@pnc.ac.id
Abstract
There are several types of health services that provide information about health care facilities, such as pharmacies, health centers, clinics, and hospitals. Application of health service facilities location is used to facilitate users in reaching the nearest health service facility. The application of the health care facilities location has not been optimally used by the user so often. The advantage of analyzing the system is to determine its direct and indirect effect on the end-user. This research analyzes task technology fit (TTF) of application for the location of health service facilities based on measures of end-user satisfaction and knowledge management system (KMS). The research began with an exploratory study through interviews with users of health service applications. With the results of interviews, the research hypothesis model was built to integrate health service applications with the task technology fit model based on end-user satisfaction. The results obtained from this study are the impact of the performance of a good application system can increase end-user satisfaction in optimizing all the modules that exist in the application. The intended system performance is the quality of information presented by the application including the location of the health service facility and the accuracy of information needed by the end which affects the compatibility of the health service facility application which significantly increase the end-user satisfaction, and this will automatically affect the TTF performance for the better. This needs to be responded to so that the application continues to be updated in real-time to continue to provide information about the application in accordance with the development and needs of end-users. This linkage shows that the role of task technology fit has a good impact on system development that affects system relationships and end-user satisfaction in applications.
Keywords: Task technology fit, end-user satisfaction, health services facilities, knowledge management system, analysis of application
Health Service Facilities (Fasyankes) is one of the public facilities that provide services in the health sector. Health Service Facility is a tool and / or place used to carry out health service efforts, including promotive, preventive, curative, and rehabilitative, conducted by the government, local government, and / or the community based on the law of Republik Indonesia number 36, regarding health, 2009. There are several types of public health services, such as clinics, pharmacies, health centers, hospitals, etc.
The development of technology has infiltrated all aspects of people's lives, including the health aspect. The development of various applications that increasingly facilitate the interests of the community, especially in the health sector, continues to be developed, such as the application
for locating public health services [1]. The application of the location of health service facilities is an application created to facilitate users in reaching the nearest health service facility [2].
Usability is a qualitative analysis that determines how easy the user is to use the user interface of an application [3]. The design and development of an application by taking into account all the needs of the end-user process become a necessity. Therefore the utilization of all modules contained in the application to be developed can be maximized [4]. The user interface design on the page of an android application is simple but not boring, so users feel comfortable interacting with the application page of health service facilities [5]. The functionality and effectiveness of using the android application become a magnet to attract users to continue to access it [6]. Analysis task technology fit for the application of Android-based health service facilities and the modules contained therein will later be processed as material that is reviewed in the analysis in order to maximize the performance of application modules and make this application more user friendly [7].
Task technology fit is a model that provides the suitability of an increasingly developed technological capability to complete all the tasks needed in a job [8]. The fulfillment of this task is the ability of information technology to provide support for each work [9]. The model that is used to explore the knowledge management system is task technology fit, with a view to sharing knowledge in analyzing the determinants for the impact of knowledge management system performance [10]. Task technology fit is widely used to study the characteristics and knowledge of users of applications that affect the relationship between task technology fit and the use of information systems that refer to the end-user satisfaction measurement parameters [11].
The problem that often arises when end users use health service facility applications is that they are not yet familiar with the modules in the application. The use of the application should be optimal by maximizing all modules in the application to find the closest location of the health facility where the end-user is located; therefore, they can go directly there with the fastest accommodation. Modules created in the health service facilities application are in accordance with the usability of the information system, which is made as efficiently as possible with all the needs of end-users, easy to remember, and user friendly. By using TTF as the model being tested to analyze the application of health facilities, end-user satisfaction is measured through the use of all modules contained in the application. Among them is information about the location of health services, whether presented with accurate location precision or not, then the measurement of end-user satisfaction is also seen from the interaction between end-users and application, whether end users can respond well to all information presented on the application, and the last is updated information about the number and location of the latest health facilities contained in the application of health service facilities.
Task technology fit places that information technology will only be used if the functions and benefits are available to support user activities [12]. Effectiveness is related to the end user's success in achieving goals by using a system [13]. Efficiency concerns the smoothness of the end-user to achieve these goals [14]. End-user satisfaction is related to the user's acceptance of the system [15]. Usability testing is done to evaluate whether an application is in accordance with the needs and satisfaction of end-users or not [16]. The environment outside the system can make the system work process as a reference for end-user computing [17].
Task technology fit is different from the technology acceptance model (TAM), which analyzes the behavior of system users who assume that when someone is in a system, they will be free to act without any restrictions in the system [18] [19]. Task technology fit analysis has been applied in various systems because the correspondence between the characteristics of the task and the characteristics of the technology affects the use of technology [20]. While the analysis using the technology acceptance model is more emphasized on the usefulness of users, perceptions about the use of the system that will improve performance and ease of use, namely the user's perception that the system is easy to use [21].
End-user satisfaction is measured through several parameters, such as the process of delivering information from the information source to the recipient [22]. The next parameter is the involvement of personnel in the system, running system processes, programs, and devices used and systems that use networks for data processing and information exchange [23]. The measure of end-user satisfaction is determined by the interaction between the end-user and the
computer system, both hardware and software [24]. These two variables determine the efficiency of information systems, which have an important impact on end-user satisfaction [25].
The difference between this research and previous ones is that this research focuses on analyzing the components of task technology fit to the health service facilities application based on the satisfaction of end-users. The analysis results are used to utilize and optimize the performance of health service applications. The high performance of the application system has implications for improving efficiency, improving effectiveness, and improving system quality [26].
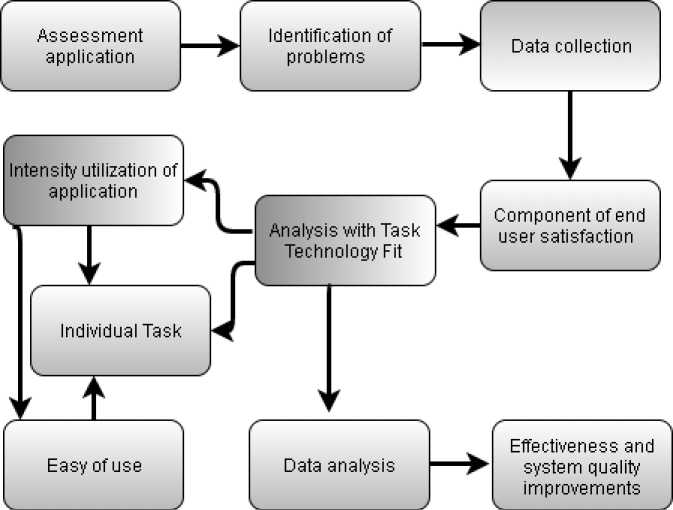
The analytical method uses the task technology fit model, which is oriented towards the enduser satisfaction of health service facility applications. Figure 1 shows that the study began with an assessment of the application of health service facilities used by end-users to find out the closest health services to where the user is located. Inputs for analysis using TTF in this study were the results of questionnaire respondents’assessments of health service facility applications to find out the end user’s assessment of the application, how the end-user responds to the information presented by the application. Then the results of the questionnaire are used to draw a common thread on the problems faced by end-users when using the application. The first stage is identifying problems faced by end-users in the use of health service facility applications. Problems that may arise related to information on the location of the health service facility closest to where the end-user is located. Because of the urgency of the needs of the end-users situation must get a quick response and as soon as possible. The next step of collecting data that supports this research is followed by analyzing the TTF model, starting with the intensity of the use of health service facility applications by end-users [27]. The data in question is data about the location of health service facilities and types of health facilities. Data is collected and processed using variables to analyze the effect of task technology fit on the application. Analyzing the ease of use of applications by end-users and modules used by each end-user is the next stage; therefore collected data analysis can be used to make decisions about the results of this study, namely the effectiveness and the quality improvement of application of health service facilities [24]. The results of data processing are used to improve the performance of existing modules in the application with the ultimate goal of end-user satisfaction.
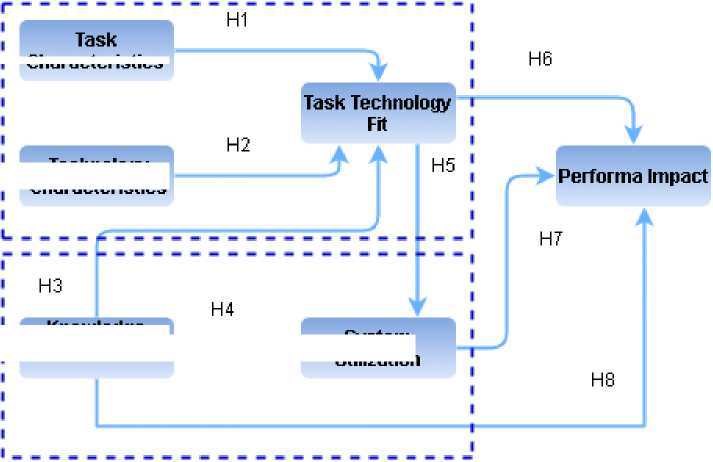
This study analyzes the relationship between hypotheses that significant and positively impact the perception of TTF that supports the usefulness of health service facilities in accordance with the perception of ease and satisfaction of end-users [9]. The hypothesis that is developed later is the relationship between task characteristics and technology characteristics, which together affect the task technology fit [27]. Whereas task technology fit influences outcome variables, namely impact performance and utilization [28]. The analysis of task technology fit makes sure that the information of technology to be used only if the functions and benefits are available to support user activities [13].
Relationship between TTF with task characteristics and technology characteristics
The compatibility between task technology fit with task characteristics and technology characteristics is that technology provides excellence, advice, and support needed to finish a job that it supports. Suitable technology will improve performance because the technology will help the work to be completed quicker, faster, easier, and better [29].
Based on the above studies, it can be concluded that the perceived ease of use of the system is significantly influenced by the task characteristics and technology characteristics of the task technology fit symbolized by H1 and H2.
H1: Perceived ease of user system where the system is in accordance with the TTF that significantly influenced by task characteristics.
H2: Perceived ease of user system where the system is in accordance with the TTF that significantly influenced by technology characteristics.
Relationship between knowledge sharing intention with system utilization and task technology fit
Utilization of computer systems/applications by end-users who have knowledge of the environment that they can choose will be influenced by individual feelings (affect) on the use of computers/smartphones, social norms (social norms) in the workplace that notice the use of hardware, habits (habit) related to the use of hardware, the hardware users expectations of individual consequences (consequences), and facilitating conditions in a conducive environment [12].
H3 and H4 represent hypotheses about the intensity of the end user’s knowledge sharing on the use of the system they are using and its effect on systems that are in accordance with the task technology fit model.
H3: Perceived ease of use system where the system is in accordance with the TTF that significantly influenced by the intention of sharing knowledge between users.
H4: Perceived ease of system users where the utilization of the system is significantly influenced by the intention of sharing knowledge between system users.
Relationship between TTF with performance impact and system utilization
The suitability between the uses of information systems with the modules needed in completing a task, in accordance with the TTF model, significantly affects the performance of end-user [30]. While the mismatch between required task and systems features in terms of data representation will affect the slow performance in decision making [26], based on the above hypothesis, it can be symbolized by H5 and H6 as follows:
H5: Perceived ease of user system in system utilization is influenced by perceived task technology fit.
H6: Perceived ease of user system that affects the impact of system performance is felt significantly influenced by task technology fit according to system perception.
Relationship between system utilization and impact performance
Utilization of the existing modules in the system/application to the maximum will affect the performance impact by end-users . The better the system is created by adjusting the task technology fit model, the more the end-user feels helped by the application and the higher automatic increase of significant effect on the performance impact [29]. The relationship between system utilization and the performance impact is symbolized by H7:
H7: Perceived ease of use of a system that influences the impact of system performance is significantly influenced by system utilization.
Relationship between knowledge sharing intention and impact performance
The intensity of sharing knowledge between users will significantly affect the impact of system performance [24]. The attitude of users who are influenced by social norms and other situational factors and share their knowledge leads to system utilization and has a positive impact on individual performance [22]. Based on the information's above, the hypotheses that can be made are symbolized by H8:
H8: Perceived user convenience where the impact of system performance will be significantly affected by the intention of sharing knowledge between users.
Figure 2 explains the relationship between hypotheses 1 (symbolized with H1) to hypothesis 8 (symbolized by H8). The first hypothesis H1 and the second hypothesis H2 states the relationship that characteristics of the task and characteristics of the technology significantly influence TTF. Then third hypothesis H3 and fourth hypothesis H4 states the relationship that the intention to share knowledge by users significantly influences the task technology fit and system utilization. The fifth hypothesis H5 and the sixth hypothesis H6 explain the relationship between TTF with performance impact and system utilization, where the perception of user convenience regarding system utilization and impact performance is influenced by task technology fit according to system perception. The seventh hypothesis, symbolized by H7, explains that the impact of system performance is significantly affected by system utilization. And the future hypothesis of H8 explains the relationship between knowledge sharing intention and impact performance. Significantly the impact of system performance is influenced by the perception of user convenience in terms of sharing knowledge between system users.
Knowledge
Sharing Intention
Characteristics
Figure 2. The Graphical Model and Hypotheses
Technology Characteristics
System Utilization
Figure 2 explains the relationship between hypothesis 1 to hypothesis 8 with each of the variables used and analyzed on the task technology fit. While figure 3 explains the process of task technology fit analysis of the object of research, namely the application of health service facilities. The relationship between figure 2 and figure 3 is defining the hypothesis used to analyze the task technology fit and then implementing the hypothesis with the variable being analyzed for the object, namely the application of health service facilities.
Figure 3 explains the analysis process using task technology fit. This study involved 132 respondents as users of health service facility applications, which are categorized based on the level of active users, advanced and beginners who will later be used as evaluators in testing based on the satisfaction of end-users. Grouping respondents only consider differences from respondents' experience in using android-based communication tools that are beginners and proficient, while the division of groups based on other demographic data such as gender, age, education level, and profession is not concluded [16]. The analysis begins with measuring the intensity of the use of health service facility applications by end-users, the characteristics of the end-user itself in using the application, and the characteristics of the technology used in the process of making the application based on the needs of the end-user. The next step is analyzing the easy use of applications by end-users and the modules used by each end-user [8] and the measurement of application usability to support end-user activities related to application performance and task technology fit analysis results on health service facility application performance. Feedback from performance impacts will be used to improve the modules in the application [11].
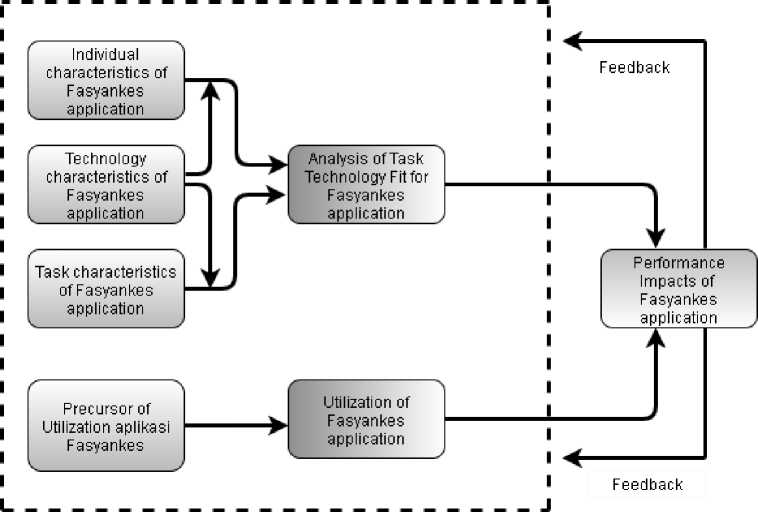
Figure 3. Task technology fit analysis for Fasyankes application
Data in this study were obtained through a questionnaire of 132 respondents. Table 1 shows the demographic characteristics of the respondents where respondents were grouped into several categories such as gender, age, education, and occupation. Grouping by gender, most respondents are female, with a percentage of 52.3% and male respondents as much as 47.7%. The grouping of respondents by age shows that the age of most respondents is between 20 years to 35 years with a percentage of 43.2%, respondents with an age range between 35 years to 45 years 23.5%, respondents under the age of 20 years are 17.4% and respondents over the age of 45 years are 15.9%.
Classification of respondents by education level shows the data of respondents with undergraduate education level with a percentage of 47%, high school education level with a percentage of 30.3%, respondents with master's education level as much as 17.4% and respondents with post-doctoral education level as much as 5.3%.
The last grouping of respondents is based on their work. This data shows that most respondents with a percentage of 40.1% are students, respondents with a percentage of 37.1% as workers from various sectors, and 22.8% are respondents with jobs as entrepreneurs, freelancers and unemployed.
Table 1. Characteristics of Respondents
|
Items |
Type |
Frekuensi |
Percent (%) |
|
Gender |
Male |
63 |
47.7 |
|
Female |
69 |
52.3 | |
|
Age |
Under 20 |
23 |
17.4 |
|
20-35 |
57 |
43.2 | |
|
35-45 |
31 |
23.5 | |
|
Above 45 |
21 |
15.9 | |
|
Education |
High School |
40 |
30.3 |
|
Bachelor |
62 |
47 | |
|
Master |
24 |
17.4 | |
|
Ph.D |
7 |
5.3 | |
|
Occupation |
Student |
54 |
40.1 |
|
Worker |
49 |
37.1 | |
|
Others |
29 |
22.8 |
This study used SEM (Structural Equation Modeling) for the calculation technique to validate the task technology fit model. Data analysis techniques using SEM are performed to thoroughly explain the relationships between variables used in research [31][32]. SEM is used to examining and validating a model, not to design a theory [33][34], wherein this study, the validated model is task technology fit. Therefore, the main requirement to use SEM is to build a hypothetical model that consists of structural models and measurement models in the form of path charts that are adjusted to the justification of the theory [35][36]. Structural Equation Modeling can be used as a series of relationships simultaneously, which makes it possible to use a collection of statistical techniques [37][38]. The relationship is built between one or several independent and dependent variables [39][40]. Analysis of the model in this study is based on Partial Least Square (PLS) is a statistical calculation that provides an outcome in the form of Path coefficients, T-Value, and R2. PLS is a type of statistical analysis with SEM-like benefits, therefore, the basic framework in PLS is based on linear regression [8][41]. Respondent data is processed using PLS because PLS characteristics are easier to modify with other models and more flexible to any changes in the model once the model is finished. The data population used also supports the use of PLS because, during observational data withdrawal or interviews process, there may be an error when the respondent fills in the questionnaire. The error is not ignored but still analyzed because there are some respondents who fill in the questionnaire according to the perception instead of the provision. The characteristics of the data used are respondents who fill in a random questionnaire and are selected from a variety of educational backgrounds, age, occupation and gender, either women or men. It is intended that users of the health service facility application can come from various ages, education, occupations since health problems are quite urgent matter.
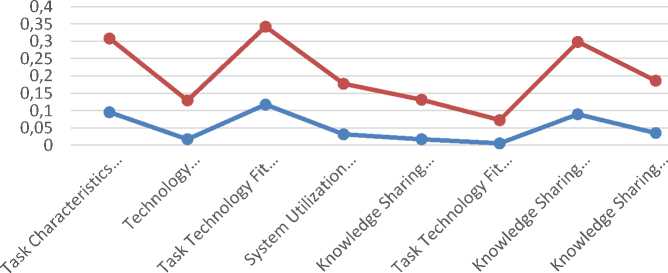
Table 2 and Figure 4 explain the results of the measurement of variables that show the average value of the data of respondents who have filled out the questionnaire. After the calculation, the
path coefficient value, T-value, and R2 values are known. The R2 value represents the independent variable that explains the variation in the dependent variable. Analysis using partial least square showed the highest R2 value on the performance impact variable on TTF and the lowest R2 value on the system utilization variable on TTF, all R2 values obtained and compared between R2 values in the first variable to R2 values in the last variable can be seen in table 2. The value of R2 indicates that the task model technology fit explains the variation in impact performance to be quite significant, a set of task technology fit models at a lower level that is the variable characteristics of the task to TTF is still quite large influence. The next variable with a smaller R2 value that is knowledge sharing intention on system utilization is still quite significant influence; even on the performance impact of the influence of knowledge sharing intention is as significant. The next variable successive is system utilization to impact performance with R2 value of 0.177, knowledge sharing intention variable to task technology fit of 0.131, technology characteristic variable to task technology fit of 0.129. The lowest is system utilization variable to task technology fit, with R2 value is only 0.072. This result shows that the influence of the TTF model on system utilization is not significant enough.
Table 2. Descriptive Statistics of Research Variables
|
Variable |
Average |
Path Koefisien |
T-Value |
R2 |
|
Task Characteristics to Task Technology Fit |
20.57 |
0.095 |
13.632 |
0.308 |
|
Technology Characteristics to Task Technology Fit |
21.14 |
0.017 |
2.207 |
0.129 |
|
Task Technology Fit to Performa Impact |
20.64 |
0.117 |
17.204 |
0.342 |
|
System Utilization to Performa Impact |
20.95 |
0.031 |
4.196 |
0.177 |
|
Knowledge Sharing Intention to Task Technology Fit |
21.22 |
0.017 |
2.269 |
0.131 |
|
Task Technology Fit to System Utilization |
17.25 |
0.005 |
0.678 |
0.072 |
|
Knowledge Sharing Intention to System Utilization |
20.96 |
0.089 |
12.66 |
0.298 |
|
Knowledge Sharing Intention to Performa Impact |
20.99 |
0.035 |
4.668 |
0.186 |
Recommended that T-Value >= 2,200 with significance level of p > 0.01 [8]
Result of Value Path Koefisien and R2
—•— Path Koefisien —•— R^2
Figure 4. Values of Path Koefisien and R2
Figure 5 shows the value of the highest T-Value on the task technology fit to performance impact variable, which means that the TTF model has a significant influence on the impact of system performance. Then at a lower level, the T-Value is sequentially on the task characteristics variable, where the implementation of the TTF model has a significant effect with a T-Value of 13,632. Then the T-Value value of the knowledge sharing intention variable towards system utilization is 12.66, which means that knowledge sharing intention influences the system utilization. Furthermore, the system performance impact variable is influenced by knowledge sharing intention with a T-value of 4.668. The variable performance of system performance is influenced by the utilization of the system with a value of T-Value 4.196. TTF model has a significant effect on the variable knowledge sharing intention with a T-Value of 2,269, while on technology characteristics, the T-Value value is 2,207. The lowest T-Value in the task technology fit variable against system utilization with a T-Value of 0.678 means the task technology fit model has no effect on system utilization.
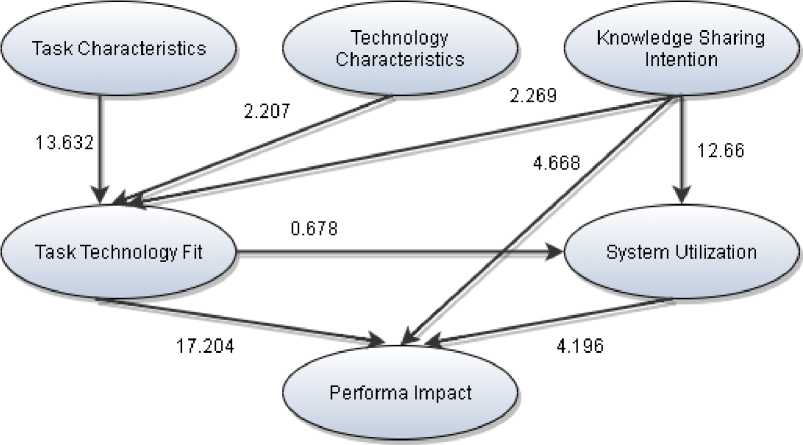
Figure 5. T-Value values of all variables
The results obtained by analyzing the satisfaction of end-user of health service facilities applications using task technology fit our end-users assisted with all modules in the application so that application utilization is optimal in showing the location of health service facilities required by end-users. While for health service facilities, application, the results of the analysis using TTF function to improve application performance.
This research proves that implementation of the TTF model that is applied has a significant effect on a number of variables by conducting a linear regression test using partial least square analysis that provides outputs in the form of path coefficient, T-Value and R2 values such as several studies that have been conducted by [11] [9] [12] which proves that the implementation of the task technology fit model will significantly affect the variables involved. The first hypothesis is task characteristics on task technology fit; the resulting path coefficient value is 0.095, which means that the effect of task technology fit on task characteristics is quite significant. The second hypothesis with the symbol H2 is technology characteristics to task technology fit with a path coefficient value of 0.017. This value means that the effect of applying the TTF model to technology characteristics is significant. Variable with the highest path coefficient value of 0.117 is hypothesis 3 symbolized by H3, which is the influence of the task technology fit model on the impact of system performance. The path coefficient results conclude that the applied task technology fit model has a significant effect on impact performance. The fourth hypothesis is the system utilization of impact performance with a path coefficient value of 0.031, which means that the increased utilization of the system will also increase the impact
performance. The next hypothesis is knowledge sharing intention on TTF. The path coefficient value is 0.017, which indicates a significant influence on the implementation of the TTF model on knowledge sharing intention. The sixth hypothesis with the symbol H6 is task technology fit to system utilization. The application of the task technology fit model to system utilization does not have a significant effect because of the linear regression test results in a path coefficient value of 0.005 smaller than 0.01. It means that the effect of task technology fit on system utilization is not quite significant, and system utilization is not directly affected by the application of task technology fit. This is in accordance with research conducted by [8]. The next hypothesis H7 is knowledge sharing intention towards system utilization with a path coefficient value of 0.089, which means that the better the sharing of knowledge between users, the better the utilization of the system. And the last hypothesis is H8, the knowledge sharing intention variable on the impact performance with a path coefficient value of 0.039. This value indicates that the better the impact performance is influenced by, the higher knowledge sharing intention. The results obtained from the conclusions of all the above hypotheses that the TTF analysis of health service facility applications which have been tested using several variables proves that the impact of the performance of a good health service facility application system can increase the satisfaction of end-users in optimizing all modules in the application. The results of the analysis are also used for the utilization and improvement of the performance of health service facility applications, so it can be better in the future. The quality of accurate information and the location of high-precision health service facilities in the application affect system compatibility, which significantly increases end-user satisfaction and automatically influences better TTF performance. Of all respondents who filled out the questionnaire, ninety-three percent expressed satisfaction because they precisely knew the location of health facilities and were satisfied with all the information contained in the application.
References
-
[1] D. R. Luna, D. A. Rizzato Lede, C. M. Otero, M. R. Risk, and G. B. de Q. Fernán, “Usercentered design improves the usability of drug-drug interaction alerts: Experimental comparison of interfaces,” Journal of Biomedical Informatics, vol. 66, pp. 204–213, 2017.
-
[2] V. P. Aggelidis and P. D. Chatzoglou, “Hospital information systems: Measuring end user computing satisfaction (EUCS),” Journal of Biomedical Informatics, vol. 45, no. 3, pp. 566– 579, 2012.
-
[3] A. L. Russ et al., “Usability evaluation of a medication reconciliation tool: Embedding safety probes to assess users’ detection of medication discrepancies,” Journal of Biomedical Informatics, vol. 82, pp. 178–186, 2018.
-
[4] Y. C. Liu et al., “Design and usability evaluation of user-centered and visual-based aids for dietary food measurement on mobile devices in a randomized controlled trial,” Journal of Biomedical Informatics, vol. 64, pp. 122–130, 2016.
-
[5] M. Georgsson, N. Staggers, E. Årsand, and A. Kushniruk, “Employing a user-centered cognitive walkthrough to evaluate a mHealth diabetes self-management application: A case study and beginning method validation,” Journal of Biomedical Informatics, vol. 91, p. 103110, 2019.
-
[6] R. Schnall et al., “A user-centered model for designing consumer mobile health (mHealth)
applications (apps),” Journal of Biomedical Informatics, vol. 60, pp. 243–251, 2016.
-
[7] M. Khalifa and O. Alswailem, “Hospital information systems (HIS) acceptance and
satisfaction: A case study of a Tertiary Care Hospital,” Procedia Computer Science, vol. 63, pp. 198–204, 2015.
-
[8] G. R. El Said, “Understanding Knowledge Management System antecedents of performance impact: Extending the Task-technology Fit Model with intention to share knowledge construct,” Future Business Journal, vol. 1, no. 1–2, pp. 75–87, 2015.
-
[9] J. Crumbly and L. Carter, “Social Media and Humanitarian Logistics: The Impact of Tasktechnology Fit on New Service Development,” Procedia Engineering, vol. 107, pp. 412– 416, 2015.
-
[10] H. P. Lu and Y. W. Yang, “Toward an understanding of the behavioral intention to use a social networking site: An extension of task-technology fit to social-technology fit,” Computers in Human Behavior, vol. 34, pp. 323–332, 2014.
-
[11] R. S. Rai and F. Selnes, “Conceptualizing task-technology fit and the effect on adoption –
A case study of a digital textbook service,” Information & Management., 2019.
-
[12] V. Moreno and F. Cavazotte, “Using information systems to leverage knowledge management processes: The role of work context, job characteristics and task-technology fit,” Procedia Computer Science, vol. 55, no. Itqm, pp. 360–369, 2015.
-
[13] S. Leek, L. Canning, and D. Houghton, “Revisiting the Task Media Fit Model in the era of Web 2.0: Twitter use and interaction in the healthcare sector,” Industrial Marketing Management, vol. 54, no. 2015, pp. 25–32, 2016.
-
[14] G. Kopanitsa, H. Veseli, and V. Yampolsky, “Development, implementation and evaluation of an information model for archetype based user responsive medical data visualization,” Journal of Biomedical Informatics, vol. 55, pp. 196–205, 2015.
-
[15] F. Karimi, D. C. C. Poo, and Y. M. Tan, “Clinical information systems end user satisfaction: The expectations and needs congruencies effects,” Journal of Biomedical Informatics, vol. 53, pp. 342–354, 2015.
-
[16] B. A. Johnsson and G. Weibull, “End-User Composition of Graphical User Interfaces for PalCom Systems,” Procedia Computer Science, vol. 94, pp. 224–231, 2016.
-
[17] B. A. Johnsson and B. Magnusson, “Towards end-user development of graphical user interfaces for internet of things,” Future Generation Computer Systems, 2017.
-
[18] R. Estriegana, J. A. Medina-Merodio, and R. Barchino, “Student acceptance of virtual laboratory and practical work: An extension of the technology acceptance model,” Computer & Education, vol. 135, pp. 1–14, 2019.
-
[19] K. B. Ooi and G. W. H. Tan, “Mobile technology acceptance model: An investigation using mobile users to explore smartphone credit card,” Expert Systems with Applications, vol. 59, pp. 33–46, 2016.
-
[20] I. U. Khan, Z. Hameed, Y. Yu, T. Islam, Z. Sheikh, and S. U. Khan, “Predicting the acceptance of MOOCs in a developing country: Application of task-technology fit model, social motivation, and self-determination theory,” Telematics and Informatics, vol. 35, no. 4, pp. 964–978, 2018.
-
[21] D. Arvie and A. R. Tanaamah, “Technology acceptance model for evaluating IT of online based transportation acceptance: a case of GO-JEK in Salatiga,” TELKOMNIKA (Telecommunication Computing Electronics and Control), vol. 17, no. 2, p. 667, 2018.
-
[22] M. Maćkowiak, J. Nawrocki, and M. Ochodek, “On some end-user programming constructs and their understandability,” Journal of Systems and Software, vol. 142, pp. 206–222, 2018.
-
[23] B. R. Barricelli, F. Cassano, D. Fogli, and A. Piccinno, “End-user development, end-user programming and end-user software engineering: A systematic mapping study,” Journal of Systems and Software, vol. 149, pp. 101–137, 2019.
-
[24] B. Šumak, M. Špindler, M. Debeljak, M. Heričko, and M. Pušnik, “An empirical evaluation of a hands-free computer interaction for users with motor disabilities,” Journal of Biomedical Informatics, vol. 96, no. June, p. 103249, 2019.
-
[25] F. Y. Lo and N. Campos, “Blending Internet-of-Things (IoT) solutions into relationship marketing strategies,” Technological Forecasting and Social Change, vol. 137, no. April, pp. 10–18, 2018.
-
[26] B. Wu and X. Chen, “Continuance intention to use MOOCs: Integrating the technology acceptance model (TAM) and task technology fit (TTF) model,” Computers in Human Behavior, vol. 67, pp. 221–232, 2017.
-
[27] M. C. Howard and J. C. Rose, “Refining and extending task–technology fit theory: Creation of two task–technology fit scales and empirical clarification of the construct,” Information & Management, 2018.
-
[28] V. Moreno and F. Cavazotte, “Using information systems to leverage knowledge management processes: The role of work context, job characteristics and task-technology fit,” Procedia Computer Science, vol. 55, pp. 360–369, 2015.
-
[29] O. Isaac, Z. Abdullah, A. H. Aldholay, and A. A. Ali, “Antecedents and outcomes of internet usage within organisations in Yemen: An extension of the Unified Theory of Acceptance and Use of Technology (UTAUT) model,” Asia Pacific Management Review, vol. 24, no. 4, pp. 335-354, 2019.
-
[30] O. Isaac, A. Aldholay, Z. Abdullah, and T. Ramayah, “Online learning usage within Yemeni higher education: The role of compatibility and task-technology fit as mediating variables in the IS success model,” Computers & Education, 2019.
-
[31] K. A. Hallgren, C. J. McCabe, K. M. King, and D. C. Atkins, “Beyond path diagrams: Enhancing applied structural equation modeling research through data visualization,” Addictive Behaviors, vol. 94, pp. 74–82, 2019.
-
[32] J. B. Ingvardson and O. A. Nielsen, “The relationship between norms, satisfaction and public transport use: A comparison across six European cities using structural equation modeling,” Transportation Research Part A: Policy and Practice, vol. 126, no. June, pp. 37–57, 2019.
-
[33] P. Papantoniou, G. Yannis, and E. Christofa, “Which factors lead to driving errors? A structural equation model analysis through a driving simulator experiment,” IATSS
Research, vol. 43, no. 1, pp. 44–50, 2019.
-
[34] I. B. Mafimisebi, K. Jones, B. Sennaroglu, and S. Nwaubani, “A validated low carbon office building intervention model based on structural equation modeling,” Journal of Cleaner Production, vol. 200, pp. 478–489, 2018.
-
[35] M. H. Raza, M. Abid, T. Yan, S. A. Ali Naqvi, S. Akhtar, and M. Faisal, Understanding farmers’ intentions to adopt sustainable crop residue management practices: A structural equation modeling approach, vol. 227. Elsevier B.V., 2019.
-
[36] S. L. Ng, “Predicting multi-family dwelling recycling behaviors using structural equation modeling: A case study of Hong Kong,” Resources, Conservation and Recycling, vol. 149, no. February, pp. 468–478, 2019.
-
[37] N. Kursunoglu and M. Onder, “Application of structural equation modeling to evaluate coal and gas outbursts,” Tunnelling and Underground Space Technology, vol. 88, no. February, pp. 63–72, 2019.
-
[38] E. Hassneen, A. H. El-Abbasi, M. Khalifa, and F. Shoaeb, “Using a two-level structural equation model to study the determinants of reproductive behavior in Giza Governorate,” Egyptian Informatics Journal, vol. 20, no. 2, pp. 143–150, 2019.
-
[39] W. Jirangkul, “Structural equation modeling of best practice-based high-performance public organizations in Thailand,” Kasetsart Journal of Social Sciences, pp. 6–11, 2018.
-
[40] R. Sadia, S. Bekhor, and A. Polus, “Structural equations modeling of drivers’ speed selection using environmental, driver, and risk factors,” Accident Analysis & Prevention, vol. 116, no. July 2017, pp. 21–29, 2018.
-
[41] S. Durdyev, S. Ismail, A. Ihtiyar, N. F. S. Abu Bakar, and A. Darko, “A partial least squares structural equation modeling (PLS-SEM) of barriers to sustainable construction in Malaysia,” Journal of Cleaner Production, vol. 204, pp. 564–572, 2018.
87
Discussion and feedback