Structural and Semantic Similarity Measurement of UML Use Case Diagram
on
LONTAR KOMPUTER VOL. 11, NO. 2 AUGUST 2020
DOI : 10.24843/LKJITI.2020.v11.i02.p03
Accredited B by RISTEKDIKTI Decree No. 51/E/KPT/2017
p-ISSN 2088-1541
e-ISSN 2541-5832
Structural and Semantic Similarity Measurement of UML Use Case Diagram
Mohammad Nazir Arifina1, Daniel Siahaana2
aInformatics Department, Institut Sepuluh Nopember 1nazir.arifin16@mhs.if.its.ac.id
Abstract
Reusing software has several benefits ranging from reducing cost and risk, accelerating development, and its primary purposes are improving software quality. In the early stage of software development, reusing existing software artifacts may increase the benefit of reusing software because it uses mature artifacts from previous artifacts. One of software artifacts is diagram, and in order to assist the reusing diagram is to find the level of similarity of diagrams. This paper proposes a method for measuring the similarity of the use case diagram using structural and semantic aspects. For structural similarity measurement, Graph Edit Distance is used by transforming each actor and use case into a graph, while for semantic similarity measurement, WordNet, WuPalmer, and Levenshtein were used. The experimentation was conducted on ten datasets from various projects. The results of the method were compared with the results of assessments from experts. The measurement of agreement between experts and method was done by using Gwet’s AC1 and Pearson correlation coefficient. Measurement results with Gwet’s AC1 diagram similarity are 0,60, which were categorized as “moderate" agreement and the result of measurement with Pearson is 0.506 which means there is a significant correlation between experts and methods. The result showed that the proposed method can be used to find the similarity of the diagram, so finding and reuse of the diagram as a software component can be optimized.
Keywords: Diagram Similarity, Use Case Diagram, Graph Edit Distance, Structural Similarity, Semantic Similarity
Software reuse refers to a strategy in developing new software that uses previously developed software components [1, 2, 3, 4]. These components could be code fragments, design, test data, or cost estimates. The scale of software reuse may range from one line of code within a function up to one complete software package. Software engineers classified two types of software reuse, i.e. systematic and accidental reuse. The systematic software reuse is a well-defined organization process in developing software in which reusable resources are intentionally generated, composed, or obtained, and then reliably expended and preserved to acquire an eminent degree of reuse [5]. It improves the capability of the organization to deliver high-quality endproducts in a timely and cost-effective manner. The end-product produced by systematic software reuse is considered more robust, well documented, and better-tested artifacts compared with accidental reuse. The accidental software reuse is an arbitrary process of developing software in which reusable resources are intentionally generated, composed, or obtained, and sporadically expended and hardly preserved. The accidental software reuse is simple, but components may not be in the best form. Reusing components, specifically on the diagram, could help quicken the product advancement process. It also can decrease the expenses and dangers utilized [6]. There are some information used to find compatible reused components [7, 8, 9], such as software requirements [10, 11], the fragment of codes [12, 13], metadata [14], and design [15, 16, 17]. There
are methods or techniques used to compare diagrams, i.e. Graph Matching Techniques, CaseBased Reasoning Techniques, Ontology-Based Techniques, Information Retrieval methods, and other specific methods [1]. Su and Bao [18] concentrated on real structural similarity of the UML model by comparing XML structure in XML format using the graph approach. Whereas in [19], three types of information are used to measure the similarity of class diagrams based on their semantic similarity on WordNet.
Use case diagrams are UML diagrams to define functionality and graphically of a system in terms of actor, use cases, and relations [20]. A tool has been implemented for storing, searching, and retrieving use case diagrams using ontologies and Semantic Web technology by [20]. This tool stores use case diagram information in OWL ontology and the implementation in Java and using SPARQL query language. Previous research by Fauzan et al. [16] adapted its predecessors [17, 21]. They suggest that the structural and semantic similarities of the two diagrams are suitable parameters in calculating the use case diagram similarity. They used the WuPalmer lexical distance of neighboring components for calculating structural similarity measurement. Both previous researches emphasized the use of semantic information from a diagram to measure the overall similarity of the two diagrams.
This study primarily focuses on developing an approach to measure the similarity between two use case diagrams by using structural and semantic aspects. To measure structural similarity, the proposed method used the process of modeling the use case diagram as a graph and graph similarity method and for semantic similarity used WuPalmer and Levenshtein. The rest of the paper is organized as follows. Section two describes in detail the similarity measurement method. It elaborates the semantic similarity measurement and structural similarity measurement. Section three describes the scenarios employed during the testing. It also shows the results and their analysis. The last section concludes the research and suggests future works.
Our similarity measurement method is composed of two main processes, i.e. diagram preprocessing and similarity measurement process. The similarity measurement process comprises of two similarity measurement aspects, i.e. semantic similarity and structural similarity. The semantic similarity between the two use case diagram is calculated using the Greedy Algorithm. The structural similarity between the two use case diagrams is calculated using Graph Edit Distance.
The diagram preprocessing aims mainly to extract the diagram metadata by converting the use case diagram into a graph. The use case diagram is modeled using an open-source UML modeling tool. Then, each model is exported to XML Metadata Interchange (XMI) format. A parser have been developed that analyze and convert XMI files into a graph by extracting property information of components that composed the system. The components are actors, use cases, and their relations. For the sake of illustration, let us consider a use case of an automatic teller machine (ATM), as shown in Figure 1.
The use case diagram in Figure 1 models the context diagram of the ATM system. Let the ATM system is called s1. The context diagram describes the overview of system interactions with other objects outside of the system. A use case in the context diagram represents the basic needs of an actor to the system. The ATM system has six main use cases, i.e. Check Balance, Deposit Fund, Withdraw Cash, Transfer Fund, Cash Register, and Maintenance. An actor is a role played by a set of objects outside the system that directly interacts with the system. An object can be an end-user or other system that directly interacts with the system. An object may have one or more roles, but an object can play only one role at a time. For example, a Card Holder is an actor played by any customer who has a bank account and holds an ATM card. The directed arrow shows the relations between actor and cardholder. An active actor is an actor that triggers the use case. A passive actor is an actor being involved in a use case. For example, the Card Holder has four use cases, i.e. Check Balance, Deposit Fund, Withdraw Cash, and Transfer Fund. In the Check
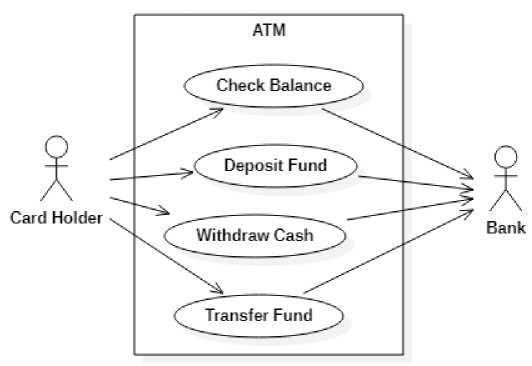
Figure 1. Use case diagram (ATM)
(a)
Figure 2. Use Case Description of (a) Check Balance and (b) Transfer Fund
(b)
Balance use case, the Card Holder is the active actor that triggers the Check Balance use case, while the Bank is a passive actor that being involved in the Check Balance use case.
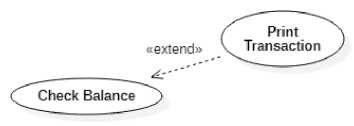
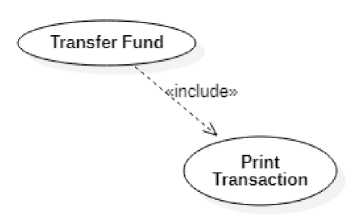
The main use case may have a detailed description that views its relations with its sub-use cases. Figure 2 shows the detailed description of the use case Transfer Fund and Check Balance. It can be seen that that both use case has Print Transaction as their sub-use case. The Transfer Fund use case includes a Print Transaction use case, while the Check Balance use case is extended by Print Transaction use case.
Given the use case diagram of the ATM system in Figure 1, an XMI file of the use case diagram can be obtained. Figure 3 shows a snapshot of the XMI script of the ATM system’s use case diagram. Use Cases and actors in the use case diagram are represented as package elements. A use case’s package element is denoted by xmi:type="uml:UseCase", while an actor’s package element is denoted by xmi:type="uml:Actor". Each package element has a unique identity. The association between actor Card Holder with use case Check Balance is represented by owned-Member element with type uml:Association. The element has two ends, i.e. the actor Card Holder and use case Check Balance (with green background). The relation between use case or depicted as extend, include, or generalization elements. The extension relation between Print Transaction and Check Balance is shown in Figure 4. Notice that text with green background is Check Balance use case.
The next step is parsing the XMI file and represents the element as a directed graph [6]. Let g(V, E) is a graph with a set of vertices V, and their edges E. A vertices can be an actor or a use case. An edge represents an association among actors, between an actor and a use case, or among use cases. The graph representation of the ATM system is shown in Figure 5. The a1 and a2 vertices represent the actors, i.e. the Card Holder and Bank, respectively. The v1, v2, v3,
CpackagedElement xmi ι id="AAAAAAFF+qBWKβM3z8Y=" name="Model" visitHity= "public" xmi:type="umlιModel"> ____<packagedElemen⅜ Xmiiid=vAfiAAAftFxBljFObQnMniw=" name="Check⅜2 OBalance11 xmi : type="uπιl: UseCase11 >____________
CpackagedElement Xmiiid=nAAAAAAFxBljOlrRUcEU=" name=,,Deposit%20Fundn xmi:type="uml:UseCase">
CpackagedElement Xmiiid=nAAAAAAFxBlklSbSEeXI=" name="Withdraw%20Cashl1 xmi ι type="uπιl: UseCase ">
CpackagedElement Xmiiid=nAAAAAAFxBllsELSzMAQ=" name=1,Transfer⅜20Fund" xmi:type="uml:UseCase">
<packagedElement Xmiiid=vAAAAAAFxBlnnoLVBEYc=" name="Card%20Holder" xmi : type="uml: Actor,,>
CownedMember xmi : id= "AAAAAAFxBlpi27XBh,6M=" visibility="public" xmi:type="uml:Association" isDerived= "false">
CownedEnd xmi:id="AAAAAAFx51pi3LXC7zY=" xmi:type="uml:Property" type=,,AAAAAAFx5InnoLVBEYc=">
CownedEnd xmi:id="AAAAAAFx51pi3LXDEsw=" xmi:type="uml:Property" type="AAAAAAFx51jFθbQnM∏w=">
j j j j CxmiiExtension extender="StarUML">
I I I <∕ownedE∏d>
: : : CmemberEnd xmi:idref="AAAAAAFx51pi3LXC7zY="∕>
I I I CmemberEnd xmi:idref="AAAAAAFx51pi3LXDEsw="∕>
i i C∕ownedMember>
________CownedMember xmi:i5=nAAAAAAFx51s∕cLksyQk=" Xmiityoe=nUmliAssociation" isDerived=nfalsen>_____________
CownedMember xmi:id=nAAAAAAFxSltN47mrRzk=" Xmiitype=nUmliAssociation" isDerived=nfalsen>
J____^____CownedMember xmi : id="AAAAAAFx51tcrLpv⅜DA=" xmi:type="uml!Association" isDerived="false">____________
<∕packagedElement>
CpackagedElement Xmiiid=vAAAAAAFxBlpDZrWXLeU=" name="Bank" visibility="public" i≡Abstract=nfalse" IsFinalSpecialization="false" i≡Leaf="false" xmi:type="uπιl:Actor"∕>
CpackagedElement xmi:id="AAAAAAFxB+nWi8cSTbY=" name="Print%20Transaction" visibility="public" i≡Abstract=

C∕packagedElement>
Figure 3. Snapshot of XMI Files: ATM System
] : CpackagedElement xmi:id="AAAAAAFx5+nWi8cSTbY=" name="Print⅝20Transaction" xmi:type=,,u∏ιlIUseCase">
Cextend xmi:id="AAAAAAFxS+uRAchuZBc=" visibility="public" xmi:type="uml:Extend" extendedCase= "AAAAAAFxBljFObQnMiiw=" extension= "AAAAAAFx5+nWi8cSTbY=1,∕>
-
- i C∕packagedElement>
Figure 4. Snapshot of XMI files: Print Transaction Extends Check Balance
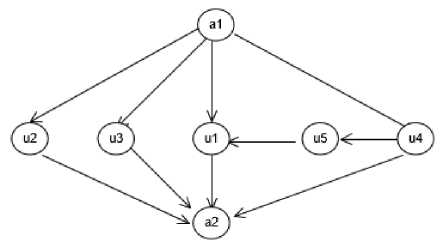
Figure 5. Graph Representation of The ATM System
v4, and v6 vertices represent the use cases, i.e. Check Balance, Deposit Fund, Withdraw Cash, Transfer Fund, and Print Transaction, respectively.
-
2.2. Graph Edit Distance
In this paper, the inexact graph matching is used by facilitating Graph Edit Distance. Graph edit distance is the distance between two measured graphs, g1 and g2 , by the amount of distortion that is needed to transform g1 into g2 [22]. In this method, graph modifications take the form of addition, deletion, and replacement of vertices and edges. For vertices replacement, it is based on type of vertices (i.e. actor and use case) and for edges are based on its’ type and directions (i.e. association, include, extend, and generalization). Equation 1 shows how to measure the distance of the two compared graphs.
dλmin (g1,g2)= min ∑ei∈λc(ei) (1)
λ∈γ(g1,g2)
where dλmin (g1,g2) denoted as graph edit distance, which is the minimum transformation of graph g1 into g2 and c(ei) is the cost for each graph modification. The cost of all operations in this paper is set 1, where it could be set a different number for increasing costs for certain operations.
The process of comparing vertices and edges is based on values obtained from the "xmi: type" attribute of the XMI file. Furthermore, edge comparisons are performed not only based on edge
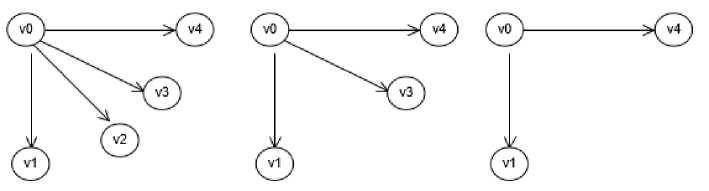
Figure 6. Graph Transformation from The First Graph to The Last Graph
type but also based on edge direction. Based on this, for directed relationships such as include, extend, and generalization, the location and type of origin or destination vertices also affect the total costs of the graph transformation process. So the results of the transformed graph will not only have the same vertices / edges type but also have the same direction of edges.
Figure 6 is an example of the transformation steps of two compared graphs. The graph g1 (first graph) has five vertices, where v0 has associations to v1, v2, v3, and v4. The graph g2 (last graph) has three vertices, where v0 has associations to v1 and v4. To transform g1 into g2, there should be a deletion of two actors (v2 and v3) and their (two) associations with vertices v0. Therefore, the sum of operation cost from g1 to g2 is 4. This operation cost value then converted into a number in a range between 0 and 1 with equation 2.
sim{g1,g2') =
100
__________cost∙100__________
v(g1)+e(g1 )+v(g2)+e(g2 )
100
where cost is the value of operation cost, v is the number of vertices, and e is the number of edges of compared graphs g1 and g2. From equation 2, the graph edit distance of g1 and g2 has operation cost 0.7143.
The semantic relationship between the two concepts is often related to their distance in the Word-Net lexical dictionary. WordNet-based has been used for determining the semantic similarity of class diagram [23, 19], sequence diagram [21, 17], and use case diagram [16, 20]. In this paper, the information contained in the use case diagram about actor and use case is measured using a combination of WuPalmer and Levenshtein where the calculation of Levenshtein distance will be used if the calculations with WuPalmer can not be performed.
Levenshtein distance is the smallest number of insertions, deletion, and substitution processes that change a word or string to be another string [24]. For example, Levenshtein Distance of string “synthesis” and “synthesize” is 2 because there are two operations: change character ’s’ into ’z’ and addition of character ’e’. In this paper, equation 3 is an equation for transforming Levenshtein distance into a normalized number ranged 0 – 1.
sim(wi, Wj) =
100
lev(wi ,Wj )∙100 len(wi) + len(wj)
100
where lev is levenshtein distance value, len(wi), and len(wj) is string length of word wi and Wj. Therefore, the result of similarity measurement of the words "synthesis" and "synthesize" based on the Levenshtein distance is 0.867.
In this paper, all of the comparison values from the two diagrams compared are arranged in metrics. Comparing the metrics requires an algorithm to find the most optimal value. Khiaty in
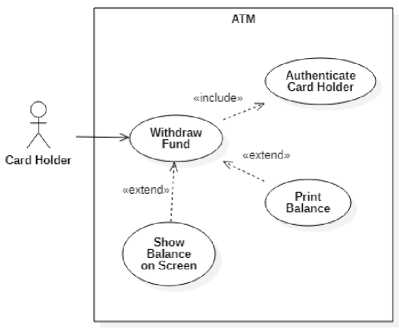
Figure 7. Use Case Diagram of The Second ATM System (s2)
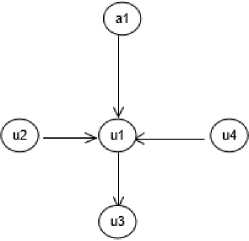
Figure 8. Graph Representation of s2
-
[23] proposed an algorithm based on greedy the algorithm, which is superior in matching time compared with the simulated annealing based algorithm. This method then adapted by several researchers such as [25, 21] for measuring structural and semantic similarity.
Based on the determined aspect, structural and semantics, the main formula for obtaining similarity between two compared diagrams is shown in equation 4. Since each aspect may have a different impact on total similarity, the proposed method used weights for each similarity measurement.
ucdSim(d1, d2) = wstruc ∙ strucSim(d1, d2) + wsem ∙ semSim(d1, d2)
(2)
where wstruc and wsem are the constant values which represent weight of structural and semantic aspects, respectively, strucSim and semSim are the results of structural and semantic similarity measurement. The weights are given arbitrarily. Structural and semantic similarity measurement use weight for actor and use case as in equation 3 and 4.
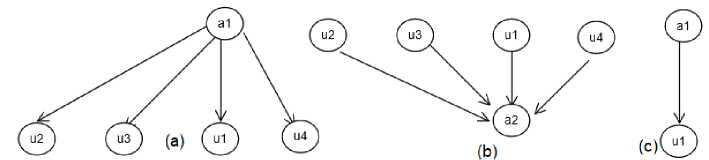
Figure 9. Graph Representation of Actors in Use Case Diagram s1 and s2
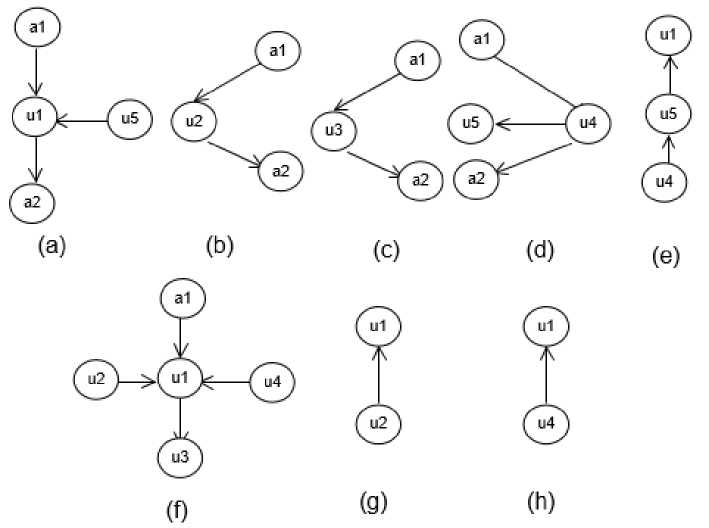
Figure 10. Graph Representation of use case in Use Case Diagram s1 and s2
structSim(d1, d2) = wac ∙ struct(∀aci ∈ d1, ∀acj ∈ d2) + wuc ∙ struct(∀uci ∈ d1, ∀u,Cj ∈ d2) (3)
semSim(d1, d2) = wac ∙ sem(∀aci ∈ d1, ∀acj ∈ d2) + wuc ∙ sem(∀uci ∈ d1, ∀ucj ∈ d2) (4)
where Wac and Wuc are the weight of actor and use case respectively, struc is result of the structural similarity measurement, and sem is the result of semantic similarity measurement, ∀aci and ∀uci is all actor and all use case respectively, within (∈) diagram d1 and d2 .
Based on equations 3 and 4, each actor in the first diagram and the second diagram will be matched and measured using Graph Edit Distance for structural, and combination of WuPalmer and Levenshtein for semantic similarity. The calculation results are summed and then multiplied with the weight of the actor Wac. This step will also be applied to each use case in the first diagram and second diagram. Weight for actor and use case is arbitrary given with value between 0 – 1, where it’s sum must be 1. These weights are used to emphasize which component in use case measurement, whether actor or use case.
To illustrate the calculation process, let’s consider the second ATM system (shown in Figure 7). Let the second version of the ATM system called s2. In s2, there are only one actor, i.e. Card Holder, and four use cases, i.e. Withdraw Fund, Show Balance on Screen, Print Balance, and Authenticate Card Holder. The use case Withdraw Fund is the only use case that directly connected to the Card Holder. Given this information, a graph representation of s2, called g2, as shown in Figure 8 was generated. The next subsections explain how to calculate the structural and semantic similarities of the two diagrams. The weights of wac and wuc for structural and semantic were set to 0.5, while wstruc,wsem was set to 0.7, 0.3, respectively.
The first step in structural similarity measurement is calculating the structural similarity of each component type. Therefore, each vertices within g1 and g2 is treated as sub-graphs. Given graph
Table 1. Structural similarity measurement of use cases in g1 and g2
g2
|
u1 |
u2 |
u3 |
u4 | |
|
u1 |
0.813 |
0.500 |
0.600 |
0.500 |
|
u2 |
0.643 |
0.625 |
0.625 |
0.625 |
|
g1 u3 |
0.643 |
0.625 |
0.625 |
0.625 |
|
u4 |
0.750 |
0.600 |
0.500 |
0.600 |
|
u5 |
0.714 |
0.750 |
0.750 |
0.750 |
g1, two sub-graphs for actors (Figure 9.a and 9.b) and five sub-graphs for use cases can be generated. Given graph g2, there are one sub-graph for the actor (Figure 9.c) and four sub-graphs for use cases. Then, for each actor in g1 , the method calculates its sub-graph similarity with the sub-graph of each actor in g2. Using the Graph Edit Distance, the structural similarity between sub-graphs can be calculated. Transforming sub-graph Card Holder (sg11) in g1 into sub-graph Card Holder (sg21) in g2 requires six operations, i.e. removes three vertices (u2, u3, and u4) and removes three edges (a1-u2, a1-u3, and a1-u4). Therefore, the cost of transforming (sg11) into (sg21) is 6. Thus, transforming sub-graph bank (sg12) in g1 and sub-graph Card Holder (sg21) requires seven operations, i.e removes three vertices (u2 , u3 , and u4), removes three edges (u2-a2, u3-a2, and u4-a2), and one edge replacement (from u1-a2, to a2-u1). Therefore, the cost of transforming (sg12) into (sg21) is 7. Given their costs, the structural similarities can be calculated as follow:
100__6∙100
struc(aι : g2,a1 : g2) = ------5+4+2+1 = 0.5
100--7∙100
struc(a2 : gι, aι : g2) = ------5+4+2+1 = 0.42
Given this structural similarity scores, it can be concluded that actor Card Holder in g1 is more structurally similar to actor Card Holder in g2 than actor Bank in g1. The structural similarity of actors in g1 and g2 can be calculated as follow:
struc(∀aci ∈ g1, ∀acj ∈ g2) =
2 ∙ 0.5
2+1
= 0.33
Structural similarity measurement on the use case’s sub-graphs is also conducted. Figure 10 shows the sub-graphs of the use case in g1 and g2 . Table 1 shows the structural similarity measurement of each pair. The result shows that u1 : g1 is best matched with u1 : g2, u2 : g1 is best matched with u4 : g2, u3 : g1 is best matched with u3 : g2, and u5 : g1 is best matched with u2 : g2. Given the best pairs, we could calculate the structural similarity measurement of use cases in g1 and g1 as follow:
+ w . 2 ∙ (0.813 + 0.750 + 0.625 + 0.625)
struc(∀uci ∈ g1, ∀ucj ∈ g2) = --------------5 + 4-------------- = 0.625
Given the structural similarity score of actors and use cases, we could calculate the structural similarity between g1 and g2 as follow:
strucSim(g1,g2) = 0.5 ∙ 0.33 + 0.5 ∙ 0.625 = 0.478
The first step of semantic similarity measurement is extracting tokens of text from each component within each vertices. Each token should go through three text-preprocesses, i.e. stop-word
Table 2. Semantic similarity measurement of use cases in g1 and g2
|
g2 u1 u2 u3 u4 | |
|
u1 u2 g1 u3 u4 u5 |
0.485 0.692 0.835 0.548 0.665 0.436 0.610 0.228 1.000 0.392 0.435 0.240 0.850 0.496 0.550 0.240 0.390 0.432 0.730 0.256 |
removal, lower casing, and lemmatizing. To get the semantic similarity of actors, the method calculated semantic similarity between tokens in each actor in g1 against tokens in each actor in g2 . To calculate the semantic similarity between tokens, WuPalmer and Levenshtein Distance algorithms are employed. To enable the use of WuPalmer calculation, both of the two compared tokens must be found in WordNet lexical database. If one of them is absent, the Levenshtein distance calculation function is used. Different from [16] and [25], this paper does not use cosine similarity for semantic similarity calculation. We could calculate the semantic similarity between pairs of actors as follow:
sem(aι : g1,a1 : g2) =
2 ∙ (1.0+ 1.0)
2 + 2
= 1.0
sem(a2 : gι, ai : g2)
2-≡5 = 0.27 2+1
Given this semantic similarity scores, it can be concluded that actor Card Holder in g1 is more semantically similar to actor Card Holder in g2 than actor Bank in g1 . The semantic similarity of actors in g1 and g2 can be calculated as follow:
sem(∀aci ∈ g1, ∀acj ∈ g2) =
2 ∙ (1.0)
2 + 1
= 0.67
Semantic similarity measurement on use cases is also conducted. To get the semantic similarity of use cases, the method calculated the semantic similarity between tokens in each use case in g1 against tokens in each use case in g2. Using the WuPalmer similarity measurement, the semantic similarity between pairs of use cases can be calculated. Table 2 shows the semantic similarity measurement of each pair. The result shows that u3 : g1 is best matched with u1 : g2, u1 : g1 is best matched with u3 : g2, u4 : g1 is best matched with u2 : g2, and u5 : g1 is best matched with u4 : g2. Given the best pairs, we could calculate the semantic similarity measurement of use cases in g1 and g2 as follow:
sem(∀uci ∈ g1, ∀u,Cj ∈ g2) =
2 ∙ (1.0 + 0.835 + 0.492 + 0.256) _ q 57
5+4
Given the semantic similarity score of actors and use cases, we could calculate the semantic similarity between g1 and g2 as follow:
semSim(g1,g2) = 0.5 ∙ 0.67 + 0.5 ∙ 0.57 = 0.62
The similarity score between the two graphs could be calculated using equation 4, given the weight of structural 0.5 and semantic 0.5 is 0.55. With the range value of similarity between 0 – 1, where the highest value means equal, this similarity result of s1 and s2 is considered moderate. Although they have relatively significant semantic similarity, there are significant differences in their structure.
Table 3. List of software projects
|
Project Name |
#actors |
#use cases |
|
AIRPORT |
4 |
7 |
|
CASHIER |
2 |
9 |
|
COFFEMAKER |
1 |
7 |
|
PHOTOSHARING |
4 |
11 |
|
INSTMSG |
1 |
8 |
|
OLSHOP |
5 |
4 |
|
OLSHOP2 |
7 |
4 |
|
TMCS |
3 |
6 |
|
ATM |
3 |
6 |
|
ATM2 |
1 |
4 |
In this study, the author collected ten projects. These projects are generated from several undergraduate student projects in a software engineering course. Table 3 shows a list of software projects. Each project has different complexity in terms of the number of actors and use cases. They range from small (1 actor and four use cases) to medium size of projects.
A tool that implementing the proposed method has been built. This tool process use case diagrams started from parsing and analyzing XMI documents until the testing process. It has been built by using a combination of Typescript, Python, and libraries such as Python NLTK, and xml-js. After building the tool, the next step is redraw and convert into XMI all datasets that consist of ten diagrams from ten projects by using open-source UML modeling applications. This process also rechecked the models to make sure that all components structurally and semantically able to be processed. After finishing this process, all xmi documents parsed and analyzed by using the created tool.
To measure whether the proposed method can provide a sufficient result, a comparison with assessment from experts was conducted. In this paper, there are three experts, consisting of two academics and a practitioner in the field of use case diagram modeling who have used and utilized a use case diagram for at least two years. These experts provide an assessment of the similarity between 30 pairs of the compared diagrams. Expert’s assessments were obtained using questionnaire contains all paired diagrams, and each diagram pair is given an expert rating for each aspect (structural and semantic) with number scale 1-5 where the greater of the number means the more similar the compared diagram.
Due to the different types of numbers, which is the expert’s assessment number for questionnaire produces an ordinal number 1 – 5, while the calculation from the proposed method produces 0 – 1 interval numbers, then two kinds of calculations are used to measure the agreement between expert and method. For ordinal number using Gwet’s AC1 and for interval number using Pearson’s correlation. For Pearson’s, the significance of values was consulted to Pearson’s critical value table with α = 0.05, degree of freedom (df) = 28, with value 0.361. For Gwet’s AC1, the values were consulted to Cohen’s Kappa interpretation table.
Some testing scenarios has been conducted in comparing the averaged assessment value from expert with the proposed method’s result using Gwet’s AC1 and Pearson’s correlation. The test was conducted sequentially, starting from structural similarity, semantic similarity, and finally, diagram similarity. In general, each test is done by changing the weights (actors, use cases, structural, or semantic) and then recalculate the diagram similarity measurement. Then the values are re-compared against the experts’ assessment. The agreement level is recalculated. For structural and semantics, weight pair for actors and use case are given arbitrary with value of 0.3 - 0.7, 0.4 - 0.6, 0.5 - 0.5, 0.6 - 0.4, and the last is 0.7 - 0.3. As for the similarity of diagram using changes
Table 4. Semantic and structural agreement
|
Weight’s Pair |
Agreement | ||||
|
Actor |
UseCase |
Structural |
Semantic | ||
|
AC1 |
Pearson |
AC1 |
Pearson | ||
|
0.3 |
0.7 |
0.49 |
0.56 |
0.47 |
-0.01 |
|
0.4 |
0.6 |
0.49 |
0.60 |
0.50 |
0.01 |
|
0.5 |
0.5 |
0.46 |
0.62 |
0.56 |
0.07 |
|
0.6 |
0.4 |
0.46 |
0.62 |
0.56 |
0.11 |
|
0.7 |
0.3 |
0.50 |
0.62 |
0.59 |
0.14 |
Table 5. Diagram similarity agreement
|
Weight’s Pair |
Agreement | ||
|
Structural |
Semantic |
AC1 |
Pearson |
|
0.3 |
0.7 |
0.60 |
0.44 |
|
0.4 |
0.6 |
0.57 |
0.47 |
|
0.5 |
0.5 |
0.58 |
0.48 |
|
0.6 |
0.4 |
0.59 |
0.49 |
|
0.7 |
0.3 |
0.57 |
0.51 |
in structural and semantic weights with pair values of 0.3 - 0.7, 0.4 - 0.6, 0.5 - 0.5, 0.6 - 0.4, and the last is 0.7 - 0.3. After doing all testing scenarios, the result of agreements for structural and semantic aspects can be observed in Table 4, and the result of agreements for diagrams based on semantic and structural similarity are listed in Table 5.
Based on the values of the agreement for the structural and semantic aspect in Table 4, an increased agreement for structural and semantic aspects were obtained with the increasing number of weights for actors, whether using Gwet’s AC1 or Pearson’s correlation. It can be interpreted that experts tend to assess structural and semantic similarity based on the conditions of actors. Still based on Table 4, the agreement on the semantic aspect is not optimal, and even all calculations with Pearson’s are below the critical value, which means there is no significant relationship between expert’s assessments and the method. This result also stated in [16]. Therefore, an improvement should be conducted on the current semantic similarity method. For the structural aspect, the value of the agreement is better than the agreement on the semantic aspect where the values are within the “moderate” agreement category, so Graph Edit Distance in this proposed method can be used as a tool in measuring the structural similarity of a diagram.
Based on the values of agreement of diagram similarity in Table 5, in general, the increasing agreement can be achieved by increasing structural weight. All values are categorized as a "moderate" agreement for Gwet’s AC1 and have a significant relationship based on Pearson’s correlation. Based on values in Tables 4 and 5, the proposed method is generally able to provide sufficient agreement values, both using Gwet’s AC1 or using Pearson’s correlation. However, the values obtained are not high or in the moderate category. Therefore, it can be concluded that the use of Graph Edit Distance for structural similarity and the use of WuPalmer and Levenshtein for semantic similarity can be used as one of the tools in measuring similarity diagrams.
This paper has introduced a method for measuring the similarity between use case diagrams. From ten datasets used from various project with various number of actor and use case, the level of agreement between the method and experts are in the "moderate" category, which is around 0.60. The results of experiments also showed that the graph approach to structural similarity calculations can be used in evaluating the similarity of use case diagrams as can be seen at the sufficient level of agreement between expert and method. The name of the property of component
within the use case diagram is also ideal for measuring the use case diagram similarity in the semantic aspect.
The result further indicate that the method can be used to find the similarity of the diagram so that the finding and reuse of the diagram as a software component can be optimized. The re-finding of diagrams is very useful especially when going through new software projects that may have similar functionality that might be have the same use case diagram. But, there are still some problems that must be considered such as the proposed method is still not optimal in calculation semantic similarities because of the use of Levenshtein that quite often caused by the absence of the word in WordNet lexical database.
The important thing that should be considered that this work is limited to use case diagram, which may not work for other UML diagrams. Further study should determine a set of weights that can achieve the most accurate measurement value. Second, the author plan to search for an alternative algorithm to increase the measurement value of semantic aspect when the name of a component not listed on WordNet lexical dictionary or when the name of component consists of more than one word. This is because these two conditions reduce the opportunity for finding the word’s lexical meaning in WordNet.
References
-
[1] H. Salami and M. Ahmed, “UML artifacts reuse: state of the art,” The International Journal of Soft Computing and Software Engineering (JSCSE), vol. 3, no. February 2014, pp. 115 – 122, 2014.
-
[2] Z. Yuan, L. Yan, and Z. Ma, “Structural similarity measure between UML class diagrams based on UCG,” Requirements Engineering, pp. 1–17, jun 2019. [Online]. Available: http://link.springer.com/10.1007/s00766-019-00317-w
-
[3] L. Montalvillo and O. Díaz, “Requirement-driven evolution in software product lines: A systematic mapping study,” Journal of Systems and Software, vol. 122, 2016.
-
[4] W. P. Hui and W. M. N. W. Zainon, “Software requirement reuse model based on levenshtein distances,” Journal of Theoretical and Applied Information Technology, vol. 95, no. 12, 2017.
-
[5] A. Buccella, A. Cechich, M. Arias, M. Pol’la, M. d. S. Doldan, and E. Morsan, “Towards systematic software reuse of GIS: Insights from a case study,” Computers and Geosciences, vol. 54, pp. 9–20, apr 2013.
-
[6] J. Parsons and C. Saunders, “Cognitive heuristics in software engineering: Applying and extending anchoring and adjustment to artifact reuse,” IEEE Transactions on Software Engineering, vol. 30, no. 12, pp. 873–888, dec 2004.
-
[7] J. L. Barros-Justo, F. B. Benitti, and S. Matalonga, “Trends in software reuse research: A tertiary study,” Computer Standards and Interfaces, vol. 66, 2019.
-
[8] R. Capilla, B. Gallina, and C. Cetina Englada, “The new era of software reuse,” pp. 1–2, 2019.
-
[9] M. Marques, J. Simmonds, P. O. Rossel, and M. C. Bastarrica, “Software product line evolution: A systematic literature review,” 2019.
-
[10] M. Irshad, K. Petersen, and S. Poulding, “A systematic literature review of software requirements reuse approaches,” 2018.
-
[11] M. Arias, A. Buccella, and A. Cechich, “A Framework for Managing Requirements of Software Product Lines,” Electronic Notes in Theoretical Computer Science, vol. 339, 2018.
-
[12] M. A. Saied, A. Ouni, H. Sahraoui, R. G. Kula, K. Inoue, and D. Lo, “Improving reusability of software libraries through usage pattern mining,” Journal of Systems and Software, vol. 145, 2018.
-
[13] N. Ali, H. Daneth, and J. E. Hong, “A hybrid DevOps process supporting software reuse: A pilot project,” Journal of Software: Evolution and Process, 2020.
-
[14] M. Song and E. Tilevich, “Reusing metadata across components, applications, and languages,” Science of Computer Programming, vol. 98, 2015.
-
[15] M. Stephan and J. R. Cordy, “A Survey of Model Comparison Approaches and Applications,” in Proceedings of the 1st International Conference on Model-Driven Engineering and Software Development - MODELSWARD 2013, 2013.
-
[16] R. Fauzan, D. Siahaan, S. Rochimah, and E. Triandini, “Use case diagram similarity measurement: A new approach,” in 2019 12th International Conference on Information Communication Technology and System (ICTS). IEEE, 2019, pp. 3–7.
-
[17] E. Triandini, R. Fauzan, D. O. Siahaan, and S. Rochimah, “Sequence Diagram Similarity Measurement: A Different Approach,” in 2019 16th International Joint Conference on Computer Science and Software Engineering (JCSSE). IEEE, jul 2019, pp. 348–351. [Online]. Available: https://ieeexplore.ieee.org/document/8864207/
-
[18] J. Su and J. Bao, “Measuring UML Model Similarity,” Proceedings of the 7th International Conference on Software Paradigm Trends, pp. 319–323, 2012.
-
[19] M. A.-R. M. Al-Khiaty and M. Ahmed, “Similarity assessment of UML class diagrams using simulated annealing,” in 5th International Conference on Software Engineering and Service Science. Beijing: IEEE Comput. Soc, 2014, pp. 19–23. [Online]. Available: https://ieeexplore.ieee.org/document/6933505
-
[20] B. Bonilla-Morales, S. Crespo, and C. Clunie, “Reuse of Use Cases Diagrams: An Approach based on Ontologies and Semantic Web Technologies,” vol. 9, no. 1, pp. 24–29, 2012.
-
[21] D. Siahaan, Y. Desnelita, Gustientiedina, and Sunarti, “Structural and semantic similarity measurement of UML sequence diagrams,” in 11th International Conference on Information & Communication Technology and System (ICTS). IEEE, oct 2017, pp. 227–234. [Online]. Available: http://ieeexplore.ieee.org/document/8265675/
-
[22] S. Bougleux, L. Brun, V. Carletti, P. Foggia, B. Gaüzère, and M. Vento, “Graph edit distance as a quadratic assignment problem,” Pattern Recognition Letters, vol. 87, 2017.
-
[23] M. A.-R. Al-Khiaty and M. Ahmed, “UML Class Diagrams: Similarity Aspects and Matching,” Lecture Notes on Software Engineering, vol. 4, no. 1, pp. 41–47, 2016.
-
[24] C. Zhao and S. Sahni, “String correction using the Damerau-Levenshtein distance,” BMC Bioinformatics, vol. 20, 2019.
-
[25] R. Fauzan, D. Siahaan, S. Rochimah, and E. Triandini, “Class diagram similarity measurement: A different approach,” in 2018 3rd International Conference on Information Technology, Information System and Electrical Engineering (ICITISEE). IEEE, 2018, pp. 215–219.
100
Discussion and feedback