Performance Evaluation of Contract Labor Using Cluster Analysis
on
p-ISSN: 2301-5373
e-ISSN: 2654-5101
Jurnal Elektronik Ilmu Komputer Udayana
Volume 9, No 2. November 2020
Performance Evaluation of Contract Labor Using Cluster Analysis
Putu Pasek Wahyu Chandra Putraa1, I Gede Santi Astawaa2
aInformatics Department, Udayana University Bali, Indonesia
2santi.astawa@unud.ac.id.
Abstract
Contract workers are needed for the success of the company, the success of a company is determined by the performance of the contract workers. Performance appraisal / work performance is a way to measure the contribution made. In terms of its benefits for the organization, performance appraisal in an organization is a very important program to implement in order to determine the achievement of work goals for each individual employee. Udayana University also recruits contract workers to support the tri dharma higher education activities, but no evaluation has been carried out regarding the performance carried out by contract workers at Udayana University. One way to do an evaluation is using cluster analysis with the K-Means method. The results showed that the k-means method can group the data of contract workers into 5 clusters with a Silhoutte value of 0.590 and a dunn index of 0.268. The SAW method cluster labeling has an accuracy rate of 84%.
Keywords: Contract Labor, Appraisal, K-Means, Simple Additive Weighting (SAW), Purity Method
The role of employees as human resources is needed to determine the success of a company. Employees or human capital are very important because they can generate additional value for the company, so the role and function of an employee is to help smooth productivity and maximize performance and use time effectively. Today, many large companies hire outsourcing services for the process of recruiting new workers. The benefit of labor recruitment through outsourcing is the company can reduce operating costs and increase the efficiency of the company. Outsourcing is the delegation of daily activities and management of a business process to outside parties (outsourcing service providers) [1]. Of course, using contract workers requires an evaluation of the performance of contract workers.
Performance appraisal / work performance is a way to measure the contribution made. In terms of its benefits to the organization, work performance appraisal in an organization is a very important program implemented in order to determine the achievement of work goals for each individual employee. Evaluation of contract labor is needed to analyze attendance, expertise or skills, workload, work performance of the contract labor. So that it can be a reference for extending the contract or not.
Udayana University, which as known as Unud, is the largest State University in Bali Province which is under the Director General of Technology Research and Higher Education, an institution of the Ministry of Research, Technology and Higher Education. Udayana University was founded on August 17, 1962 based on the Decree of the Minister of Higher Education and Science, Number 104 of 1962, dated August 9, 1962, then stipulated by the Presidential Decree of the Republic of Indonesia Number 18 of 1963, dated January 13, 1963. Udayana University also
recruits contract workers to support the tri dharma higher education activities carried out at Udayana University, but no evaluation has been carried out regarding the performance carried out by contract workers at Udayana University.
One way to do evaluation is by grouping the data. K-Means Clustering is a method used to classify data. The K-Means Algorythm is chosen because it has high enough accuracy to the size of the object, so that this algorithm is relatively more scalable and efficient for processing large numbers of objects. In addition, the K-Means algorithm is not affected by the order of objects [2].
Based on the research that has been presented above, the researcher wants to conduct research on the evaluation of contract workers using cluster analysis. The criteria used based on the Rector's Regulation Number 464/2015 are calculation points of SKP, value of attendance, and value of behavior.
In previous research, Lili Tanti conducted research on the selection of outstanding contract workers based on performance evaluation using the SAW method. The parameters used in this study are the parameters of the assessment criteria, namely work discipline, administrative discipline, reliability, personal maturity and integrity, morale, communication and cooperation, persistence and work principles, quantity of work results, quality of work results and care for the organization using the method that can produce analysis and information that is accurate and fast to assist management in making decisions [3]. Edgar Aryo conducts research on the performance appraisal decision support system of contract employees at the library and archive of Semarang city. In this study using the SAW method to assess the performance of contract employees [4].
Desy Rahmawati conducted a research on cluster analysis using k-means algorithm and fuzzy c-means clustering for corporate bond data grouping. The coupon rate, yield, and rating of each company is more appropriate to use the K-Means method because it has a smaller Sw / Sb ratio value compared to the Fuzzy C-Means method, namely 0.6651. The results of grouping corporate bond data according to coupon rate, yield, and rating variables using the K-Means method show that cluster 7 is the best cluster because cluster 7 contains bonds with AA + and AAA ratings with not too long time to maturity. [5] In Parlina also makes use of the K-means algorithm in determining eligible contract workers to attend the assessment center for the Staff Development Program (SDP) clustering program. In this study the authors applied the K-Means Clustering algorithm for grouping SDP Program data at PT. Bank Syariah. The results of this grouping were obtained by three groups, namely the Passing, Nearly Passing and Not Passing groups. There is a cluster center with Cluster-1 = 8; 66; 13, Cluster-2 = 10; 71; 14 and Cluster-3 = 7; 60; 12. The center of the cluster is obtained from several iterations so as to produce an optimal cluster center [6].
This research is divided into several stages including: data collection, data selection, data clustering, cluster results, testing. First step of this research is collecting data. Next is the data selection stage. Then proceed to data clustering using the K-means algorithm. After the clustering process is carried out, the results of the cluster are obtained and enter the final stage, namely the testing phase.
Pengumpulan
Mulai --------► --------► Seleksi data
Clustering data
Selesai pengujian hasil cluster
Figure 1. Research Flowchart
-
2.1 Data collection
The data source in this study is secondary data, while the data collection process was carried out at Udayana University by utilizing the remuneration data for education personnel at Udayana University in 2017. The data is divided into two data, namely data on educational workforce targets and data on attendance, attitudes & behavior.
-
2.2 Data Selection
Data selection is selecting data to be used in the k-means algorithm process. The objective of data selection is to create a target data set, select a data set, or focus on a subset of variables or data samples, where the findings will be made [7].
-
2.3 Data Clustering
Data clustering is the process of grouping a set of physical or abstract objects into classes that have similarities [8]. In data clustering, the K-means algorithm is used.
-
2.3.1 K-Means
According to MacQueen JB [9], here are the steps of the K-Means algorithm:Determine how many k-clusters you want to form
-
a. Generating k-cluster random value for the initial cluster center (centroid).
-
b. Calculating the distance of each input data to each centroid using the distance formula
(Eucledian Distance) to find the closest distance from each data to the centroid. The following is the Eucledian Distance equation :
d (xi , μi) = √(xi - μi) 2 (1)
-
c. Classify each data based on its proximity to the centroid (smallest distance).
-
d. Update the centroid value. The new centroid value is obtained from the average cluster in question using the formula :
Ck = 1 nk ∑ di (2)
Where:
nk = amount of data in the cluster
di = the number of distance values entered in each cluster
-
e. Repeating from steps 2 to 5 until the members of each cluster have not changed.
-
f. If step 6 has been fulfilled, then the average value of the cluster center (μj) in the last
iteration will be used as a parameter to determine the data classification.
-
2.3.2 Silhouette Index
Silhouette analysis can be used to validate the K-Means algorithm. This is done by looking at the s value of the calculation using the MatLab software. The results of the calculation of the silhouette coefficient value can vary from -1 to 1. If si = 1 means that object i is already in the right cluster. If the value of si = 0 then object i is between the two clusters so that it is not clear that the object must be entered into cluster A or cluster B. in another cluster[10].
S i - bJ- aI .
(3)
i max {aj, b!}
-
2.3.3 Dunn Index
Dunn index has the premise that a good cluster is one that has a small diameter and a large
distance from other clusters [11].
( mn H⅛cJ)ħ
J ι+ι≤J≤g( m≤qd^
(4)
With :
d(Ci,C])= min du (5)
i∈Li,]∈C j
d(C∣) = maxdii (6)
i,]∈Cι
where DU: Dunn Index, q: number of clusters, d(Ci,Ci): squared euclidean distance between object pairs in cluster i and cluster ; (intercluster distance), d(C∣y. squared euclidean distance
between members in cluster I (intracluster distance), dij: the squared euclidean distance between object i and object j.
Purity (purity) of a cluster is represented as a member of the cluster that most fits (fits) in a class. Purity can be calculated by the following formula [12]:
Purity (j) = ^ max (nij)
(7)
(8)
The total value of Purity can be calculated with the following formula :
Purity = ∑ ~ Purity (j)
i=o *
The Simple Additive Weighting (SAW) method according to Kusumadewi, the SAW method is a weighted addition method. The basic concept of the SAW method is to find the weighted sum of the performance ratings for each alternative on all attributes. [8]
(i _ . . _ J MAXiXij ^lj = j MINiXij
if J is atrribute advantage (benefit)
if J is atrribute cost (cost)
(9)
( Xij
Description of each criterion:
Rij: normalized performance rating value.
Xij: the attribute value that belongs to
Max Xij: the largest value of each criterion.
Min Xij: the smallest value of each criterion.
Benefit: if the greatest value is the best
Cost: if the smallest value is best
The final result is obtained from the ranking process, namely the addition and multiplication of the normalized matrix R with the weight vector so that the largest value is chosen as the best alternative as a solution.
Vi = ∑f=1 WjRij
(10)
Information:
-
Vi: ranking for each alternative.
Wj: the weighted value of each criterion.
After collecting the data, the remuneration data is then grouped using the clustering method. The clustering method used is the K-Means method. Clustering consists of 3 stages, namely, the cluster process, determining the performance test, analyzing the cluster results. Input from this process is data that has been selected in the process and the output is in the form of grouped data.
At this stage, the results of clustering will be tested for the performance of 30 experiments with an internal test method using the Dunn Index and Silhoutte Index calculations. If the dunn index value is high, the results are good while the Silhoutte Index determines how well an object is placed in a cluster, while for the number of iterations the minimum number is needed to achieve convergent conditions will be sought. The best cluster results will be used in this study.
External testing is done by using the purity test to determine if the cluster is said to be pure if all objects with the same class are in the same cluster. At this stage, the test will be carried out by comparing the labels made by the system with the labels given by the HR expert at Udayana University
In this study, the data obtained were then selected the appropriate data for calculation. The discarded data is data that is less relevant to the research. The Unused data in this research is data whose variable values are not defined as in the example in table 1.From the spreadsheet data obtained, the determination of the variables used for the calculation process based on Rector Regulation Number 464/2015 is the calculation points for Job Objectives, attendance values, and behavior value
Table 1. Data is not used in the research
|
NIP |
NAME |
WORK GOAL VALUE |
ATTENDANCE VALUE |
VALUE OF CONDUCT |
|
NIP009 |
Tendik009 |
168 |
22,38166667 |
N/A |
|
NIP012 |
Tendik012 |
168 |
40,17166667 |
N/A |
|
NIP014 |
Tendik014 |
168 |
11,97166667 |
N/A |
|
NIP015 |
Tendik015 |
168 |
100 |
N/A |
|
NIP028 |
Tendik028 |
139,03 |
94,13833333 |
N/A |
|
NIP029 |
Tendik029 |
168 |
50,86833333 |
N/A |
At this stage, the tool used for the clustering process using the k-means data contractor method is matlab. Contract labor data will be grouped into 5 clusters with labels that have been determined by the author. The labels used in this study are very good, good, fair, bad and very bad. Determination of the initial cluster centroid will be determined randomly using the random function in the matlab tool. So it takes repeated trials to find the best results. In this research, testing experiments will be carried out 30 times. This is in line with research conducted [13] ] in conducting student data clustering, 30 repetition experiments were carried out. Research conducted [14] ] states that one of the weaknesses of the k-means method is the determination of the initial centroid randomly so that the results of the clusters that are formed are not necessarily optimal so it is necessary to repeat the test to determine the optimal cluster. Figure 2 shows the results of the cluster formed from 269 data on contract employees at Udayana University.
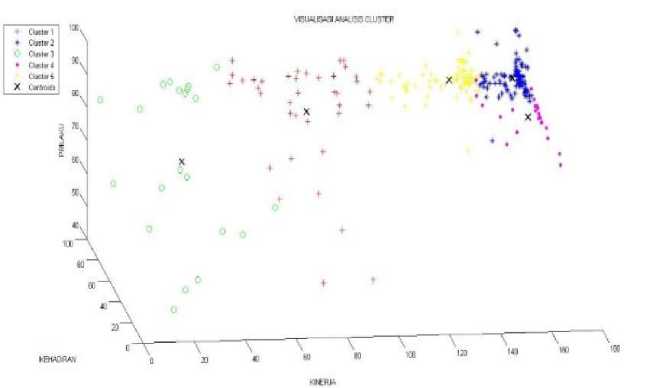
Figure 2. Results of the cluster of contract workers
The testing phase is carried out in two stages, those are internal test using the Dunn index and Silhouette Index methods. The external test was carried out using the purity method using a comparison table from the expert in the HR division of Udayana University.
Figure 3. Is a graph of the results of internal testing carried out 30 times. Based on the experiments conducted experiments 11 and 26 have a Silhoutte value of 0.590 and a dunn value of 0.268 this value is the largest compared to other experiments. Figure 4 shows the iterations required in the iteration of cluster formation to achieve convergent conditions. Of the 30 experiments conducted, the 21st and 30th experiments have the smallest iteration value. This shows that the number of repetitions of cluster formation is to achieve a convergent condition. This experiment was faster than the other experiments, but the Silhoutte and Dunn Index values in experiments 21 and 30 were not better than trials 11 and 26.
From the results of the tests conducted, it can be concluded that the 26th experiment has the best results from other experiments, the results of the 26th experiment have the best Silhoutte and Dunn index values and the iteration value is not too bad compared to other experiments.
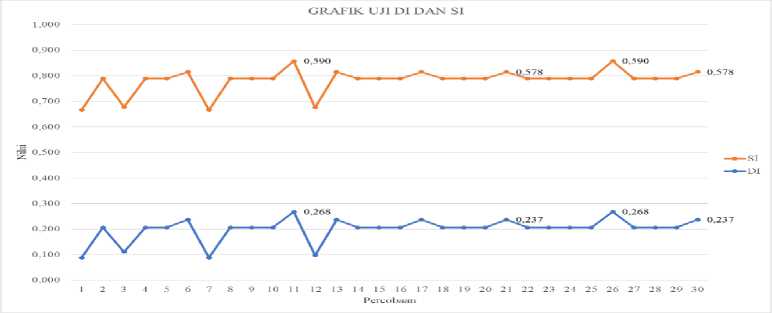
Figure 3. SI and DI test results
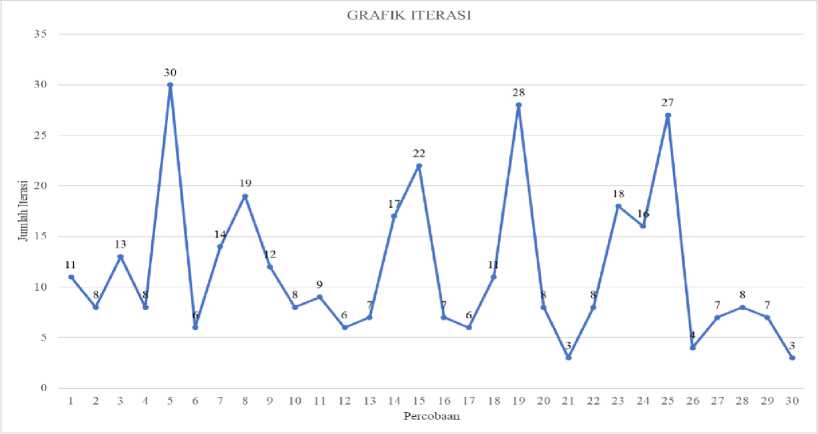
Figure 4. Iteration Test Results
-
3.3.2. External test
The purity method is used to measure the purity level of a cluster. Cluster is said to be pure (pure) all objects with the same class are in the same cluster. The higher the purity value the better the cluster quality.
Table 2. Purity Test
|
Amount |
Very Bad |
Bad |
Enough |
Well |
Very Good |
Purity | |
|
Cluster 1 |
38 |
6 |
18 |
14 |
0 |
0 |
18 |
|
Cluster 2 |
104 |
0 |
0 |
0 |
7 |
97 |
97 |
|
Cluster 3 |
21 |
21 |
0 |
0 |
0 |
0 |
21 |
|
Cluster 4 |
24 |
0 |
0 |
0 |
11 |
13 |
13 |
|
Cluster 5 |
82 |
0 |
0 |
6 |
76 |
0 |
76 |
|
Total |
269 |
84% |
Table 2 shows the calculation results obtained with a purity value of 0.84 or 84%. The results obtained show that the accuracy value with the purity test is good because the purity value is close to 1. This shows that the label made by the system with the label given by the expert has a good level of accuracy.
At the data clustering stage, it will be implemented using matlab. The implementation used 269 data. The clustering stage was carried out as many as 30 experiments. The following graph is generated from the clustering process
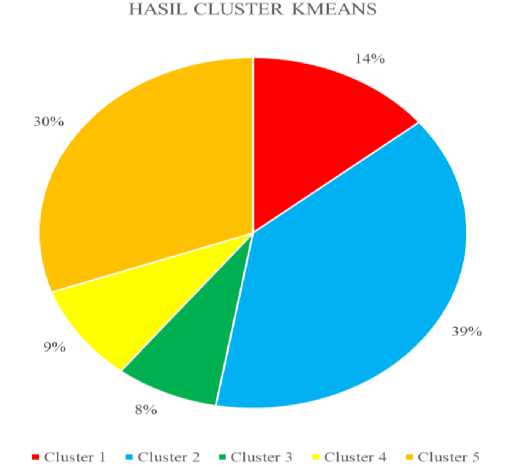
Figure 5. K-means clustering results
Based on Figure 5, 14% of the personnel who enter cluster 1 (38 people), cluster 2 have the most members which consists of 39% (104 people), cluster 3 has the lowest members as much as 8% (21 people), cluster 4 as many as 9% (21 people) and cluster 5 as many as 30% (82 people)
In determining ranking, the criteria that will be used as a reference in making decisions are work targets, attendance and behavior. At this stage the data will be implemented using matlab. The results of the ranking are as follows:
Table 3. Cluster Ranking
|
Works Goals |
Presence |
Conduct |
SAW Result |
RANK |
Information | |
|
Cluster 1 |
89.67 |
70.16 |
76.99 |
0.8072 |
4 |
Bad |
|
Cluster 2 |
164.70 |
90.52 |
88.28 |
0.9984 |
1 |
Very Good |
|
Cluster 3 |
29.63 |
65.93 |
73.54 |
0.7182 |
5 |
Very Bad |
|
Cluster 4 |
162.64 |
53.63 |
88.22 |
0.9356 |
3 |
Enough |
|
Cluster 5 |
140.11 |
91.48 |
87.97 |
0.9751 |
2 |
Well |
Based on table 3, it can be seen that work targets are very well achieved by contract workers who are located in cluster 2 where when viewed from the work target value, behavior has the highest value. Although the value of the presence of contract workers who are located in cluster 5 is the highest, but cluster 5 gets a good rating, this is because the work target value and behavior are lower than cluster 2 and cluster 4.Contractors who are located in cluster 4 get a sufficient rating even though the work target value and behavior is greater than cluster 5, this is due to the small presence of contract workers in cluster 5 so that it affects the SAW results obtained, contract workers located in cluster 4 get a bad predicate and contract workers located in cluster 3 get a very bad predicate very low work target values and the lowest behavior scores among other clusters
This box and whisker graph is used to show the range of variable values for each cluster. A box and whisker graph for the work target variables is shown in Figure 5.
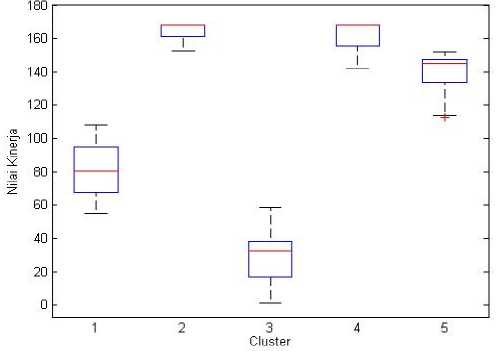
Figure 5. Box and whisker visualization of work target variables
In Figure 5, it can be seen that the box clusters 1 and 3 have a lower position than boxes 2, 4, 5, this shows that members of clusters 1 and 3 have lower values than clusters 2, 4, 5 so that evaluation of the target values can be carried out. contract workers in the cluster. A box and whisker graph for the presence variable is shown in Figure 6.
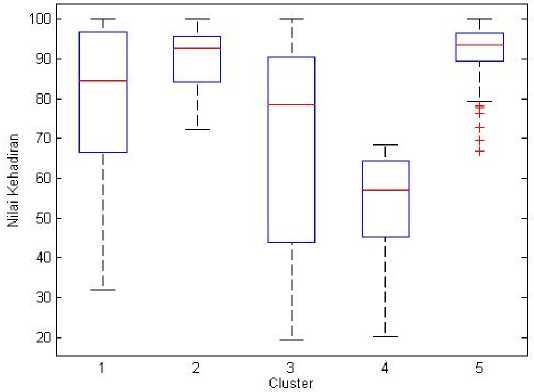
Figure 6. Visualization of the box and whisker variable presence
In Figure 6, it can be seen that the box cluster 4 is the lowest compared to other clusters, so it is necessary to evaluate in terms of attendance for cluster members 4, clusters 1 and 3 have members with high attendance values but low attendance values for members of this cluster. So that there can be an evaluation of attendance in clusters 1 and 3 to maximize the value of the cluster. A box and whisker graph for the behavior variables is shown in Figure 7

Figure 7. Visualization of the box and whisker variable behavior
In Figure 7 it can be seen that members of cluster 3 have a lower box and whisker than other clusters so that evaluation can be carried out in terms of behavior assessment of cluster members 3.In clusters 1, 2, 4, 5, it is found that data is outliers so it is necessary to do more research. further related to data deletion - data is outliers
Based on the research, the evaluation of outsourcing personnel with cluster analysis can be concluded as follows:
-
a. The K-Means method can group contract labor data into 5 clusters with a Silhoutte value of 0.590 and a dunn value of 0.268
-
b. Based on the purity test, cluster labeling using the SAW method has an accuracy rate of 84%
-
c. Because the initial centroid of the cluster is randomly assigned, repeated trials are required to determine the best results. 4. Based on the analysis with box and whisker charts, it is found that some outliers are found.
-
d. Based on the analysis with box and whisker charts, it is found that some outliers are found.
Reference
-
[1] F. R. Wilujeng and R. Kusumo, “ANALISIS KEPUASAN TENAGA KERJA OUTSOURCING TERHADAP PELAYANAN PERUSAHAAN DENGAN METODE IMPORTANCEPERFORMANCE ANALYSIS ( IPA ) Outsourcing Employee Satisfaction Analysis to Company Service using Importance-Performance Analysis ( IPA ) Method,” J. Ind. Eng. Manag. Syst., vol. 11, no. 2, pp. 64–69, 2018.
-
[2] D. W. Sitohang and A. Rikki, “Implementasi Algoritma K- Means Clustering untuk Mengelompokkan Data Gizi Balita pada Kecamatan Garoga Tapanuli Utara,” KAKIFIKOM, vol. 01, no. 02, pp. 80–92, 2019.
-
[3] L. Tanti, “Pemilihan Pegawai Berprestasi Berdasar Evaluasi Kinerja Pegawai Dengan Metode Saw,” Semnasteknomedia Online, vol. 3, no. 1, pp. 2-2–169, 2015, [Online]. Available: http://ojs.amikom.ac.id/index.php/semnasteknomedia/article/view/869.
-
[4] E. A. Ferdika, “Sistem pendukung keputusan penilaian kinerja karyawan kontrak pada kantor perpustakaan dan arsip kota semarang,” Skripsi, Fak. Ilmu Komput., no. 5, pp. 2–7, 2015.
-
[5] D. R. Ningrat, D. A. I. Maruddani, and T. Wuryandari, “Analisis Cluster Dengan Algoritma K-Means Dan Fuzzy C-Means Clustering Untuk Pengelompokan Data Obligasi Korporasi,” None, vol. 5, no. 4, pp. 641–650, 2016.
-
[6] M. R. L. Iin Parlina, Agus Perdana Windarto, Anjar Wanto, “Memanfaatkan Algoritma K-Means Dalam Menentukan Pegawai Yang Layak Mengikuti Asessment Center,” Memanfaatkan Algoritm. K-Means Dalam Menentukan Pegawai Yang Layak Mengikuti Asessment Cent. Untuk Clust. Progr. Sdp, vol. 3, no. 1, pp. 87–93, 2018.
-
[7] E. P. Cynthia and E. Ismanto, “Metode Decision Tree Algoritma C.45 Dalam Mengklasifikasi Data Penjualan,” J. Ris. Sist. Inf. Dan Tek. Inform., vol. (3) Juli, no. July, pp. 1–13, 2018, [Online]. Available:
http://tunasbangsa.ac.id/ejurnal/index.php/jurasik/article/download/60/pdf.
-
[8] W. A. B.Subawa, S.Gede, “Pemilihan Pegawai Terbaik Menggunakan Metode Simple Additive Weighting ( Saw ) Di PT Tirta Jaya Abadi Singaraja,” J. Manaj. Sist. Inf., vol. 4, no. 1, pp. 54–66, 2015, doi: 10.23887/karmapati.v4i5.6623.
-
[9] J. MacQueen, “Some methods for classification and analysis of multivariate observations,” 1967.
-
[10] A. Ramadhan, Mustakim, and Z. Efendi, “Perbandingan K-Means dan Fuzzy C-Means untuk Pengelompokan Data User Knowledge Modeling,” Semin. Nas. Teknol. Informasi, Komun. dan Ind. 9, pp. 219–226, 2017.
-
[11] N. L. G. P. Suwirmayanti, “Penerapan Metode Fuzzy C-Means Untuk Pengelompokan Data Kredit,” STMIK Pontianak Online Proc., pp. 390–395, 2018.
-
[12] R. Handoyo, R. Rumani, and S. M. Nasution, “Perbandingan Metode Clustering Menggunakan Metode Single Linkage Dan K-Means Pada Pengelompokan Dokumen,” JSM STMIK Mikroskil, vol. 15, no. 2, pp. 73–82, 2014, [Online]. Available:
https://mikroskil.ac.id/ejurnal/index.php/jsm/article/view/161.
-
[13] C. Purnamaningsih, R. Saptono, and A. Aziz, “Pemanfaatan Metode K-Means Clustering dalam Penentuan Penjurusan Siswa SMA,” J. Teknol. Inf. ITSmart, vol. 3, no. 1, p. 27, 2016, doi: 10.20961/its.v3i1.644.
-
[14] R. Prasojo, Y. R. W. Utami, and R. T. Vulandari, “IMPLEMENTASI K-MEANS CLUSTERING PADA PENGELOMPOKAN POTENSI KERJASAMA PELANGGAN,” J. TIKomSiN, vol. 7, no. 2, pp. 8–17, 2019.
212
Discussion and feedback