Application of the C4.5 Algorithm to Predict the Types of Disease in Pigs Based on Android
on
p-ISSN: 2301-5373
e-ISSN: 2654-5101
Jurnal Elektronik Ilmu Komputer Udayana
Volume 10 No. 1, August 2021
Application of the C4.5 Algorithm to Predict the Types of Disease in Pigs Based on Android
I Gusti Ayu Purnami Indryaswaria1, Ida Bagus Made Mahendraa2
aInformatics Department, Udayana University
Bali, Indonesia
1purnami.indryaswari@gmail.com
Abstract
Many Indonesian people, especially in Bali, make pigs as livestock. Pig livestock are susceptible to various types of diseases and there have been many cases of pig deaths due to diseases that cause losses to breeders. Therefore, the author wants to create an Android-based application that can predict the type of disease in pigs by applying the C4.5 Algorithm. The C4.5 algorithm is an algorithm for classifying data in order to obtain a rule that is used to predict something. In this study, 50 training data sets were used with 8 types of diseases in pigs and 31 symptoms of disease. which is then inputted into the system so that the data is processed so that the system in the form of an Android application can predict the type of disease in pigs. In the testing process, it was carried out by testing 15 test data sets and producing an accuracy value that is 86.7%. In testing the application features built using the Kotlin programming language and the SQLite database, it has been running as expected.
Keywords: Pig Disease, C4.5 Algorithm, Android App, Prediction, Kotlin
Pig livestock is one of the livestock which is quite a lot maintained by Indonesian people, especially in Bali where this animal is used to fulfill the needs of religious ceremonies in Bali as well as to meet the daily consumption of the Hindu community in Bali. The pig population in Bali was 56,942 from December 2019 to July 2020, according to the Bali Province Agriculture and Food Security Service.
Pig livestock is classified as a monogastric animal where pigs have the ability to change food ingredients efficiently if supported by the quality of the food they consume [7]. Pig livestock are very susceptible to disease. Disease in pigs is generally divided into two, namely infectious and non-infectious diseases. Infectious diseases caused by viruses, bacteria, parasites and fungi. Meanwhile, non-infectious diseases are caused by heredity, lack or excess of nutrition, poisoning, and stress, according to the Ministry of Agriculture in 2010.
From December 2019 to July 2020 there were 4,149 pigs affected by the disease and 32,438 pigs that died from the disease, according to the Bali Province Agriculture and Food Security Service. Dead pigs can cause huge losses to pig breeders.
One solution that can be done is with a system that can predict what kind of pig disease is experienced by livestock so that it can be the first step for pig breeders to handle their pigs.
Many studies on predicting a disease using Data Mining classification techniques, including by Santosa et al [6] by implementing the C4.5 Decision Tree Algorithm to diagnose Tuberculosis using 50 training data and 50 test data, the results of this study were obtained an accuracy value of 90%. Research conducted by Handayani [4] by applying the C4.5 Algorithm for the classification of Hernia Disc and Spondylolisthesis in the Vertebral Column using 310 test data obtained an accuracy value of 89%. In a study conducted by Bahri et al [1] regarding the comparison of the Naïve Bayes and C4.5 algorithms for classification of childhood diseases using 240 data, the resulting accuracy rate for the C4.5 algorithm was 90% while for the Naïve Bayes algorithm it was 89.58% so It can be concluded that the C4.5 algorithm produces the best value in this study.
Based on the research that has been made by these researchers, the author wants to make an Android application that can predict what types of diseases are experienced by pigs by using one of the data mining classification algorithms, namely the C4.5 Algorithm.
The C4.5 algorithm is an algorithm that is often used in classifying data in data mining, this algorithm is used to explore data where the results of this data exploration will be converted into a decision tree form and from the decision tree will be read into a rule [2]. The calculation of the C4.5 Algorithm is carried out by processing 50 training datasets which consist of 8 types of diseases in pigs such as Colibacillosis, African Swine Fever (ASF), Swine Pox, Erysipelas,Hog Cholera, Helminthiasis, Streptococcosis, and Scabies, consisting of 31 symptoms of the disease.
The C4.5 algorithm is an algorithm that is often used in classifying data in data mining, this algorithm is used to explore data, namely to find the relationship between input variables or criteria attributes with the target variable or decision attribute (decision attribute). The results of this data exploration will be converted into a decision tree form and from the decision tree will be read in the form of a rule [2].
The following elements need to be found in value to solve the case using the C4.5 algorithm, namely [2]:
-
a. Entropy
Entropy is the estimated number of bits needed to be able to extract a class (+ or -) from a number of random data in the S sample space. Entropy can be said as the required bit to represent a class. The smaller the Entropy value, the more Entropy is used to extract a class. Entropy is used to measure the authenticity of S. The formula for finding the entropy value is:
Entropy (S) = ∑U - Pi * Iog2 Pi (1)
Information :
S: Number of data samples (Sampling)
-
k: The number of partitions S
Pi: The proportion of Si to S
-
b. Gain
Gain is the acquisition of information from attribute A relative to the data output S. Information obtained from the data output or dependent variable S is grouped by attribute A, denoted by Gain (S, A). The formula for finding the Gain value is:
Gain (S, A) = Entropy (S) - ∑=^ * Entropy(Si) (2)
Information :
-
A: Attribute
S: Number of cases (Sample)
-
k: The number of partitions S
| Si | : The number of samples in the i-th partition
| S | : Number of samples in S.
To form a node in the C4.5 tree, it requires the attribute with the highest gain ratio value.
The formula for finding the gain ratio value along with the split info, namely:
Gain ratio (S, A) = ^(sv
(3)
(4)
' ' Split lnfo(SA)
Split info (S, A) = - ∑i ι * log2(^)
IsI IsI
Information :
A: Attribute
S: Number of cases (Sample)
-
k: The number of partisans S
| Si | : The number of samples in the i-th partition | S | : Number of samples in S.
An application is a set of commands or code that is systematically compiled to carry out an order given by humans through computer components or hardware used by humans in
running application programs, thereby helping humans to provide what solutions they want [5].
Android is an operating system and programming platform developed by the Google Company for smartphones and other mobile devices. Android can work on a wide variety of devices from many different manufacturers. Android includes a software development kit for writing native code and assembling software modules to build applications for Android users [5].
Android application is an application that can run on the Android operating system and platform. Android applications can be written in the Kotlin, Java, and C ++ languages.
Pigs are classified as monogastric livestock where pigs have the ability to change food ingredients efficiently if supported by the quality of the food they consume. Pigs are prolific, namely the ability to have many children in each birth, ranging from 8-14 children, which can give birth twice a year. Pigs can also grow faster and mature faster [7].
Zoological classification of pigs is as follows [7]:
Phylum : Chordates
Klass : Mammals (breastfeeding)
Order : Artiodactyia (even nails)
Family: Suidae (Non Ruminants)
Genus: Sus
Species : Sus scrofa
The current pig is thought to be descended from the species Sus scrofa and Sus vitatus. Sus scrofa is a pig that has a large body, pointed head and long fangs. On some parts of the neck there is long and coarse hair, the front and hind legs are large. Meanwhile, Sus vitatus has a smaller body with fine hair and smaller front and hind legs [7].
Pig livestock are highly susceptible to disease. Disease in pigs is generally divided into two, namely infectious and non-infectious diseases. Infectious diseases caused by viruses, bacteria, parasites and fungi. Meanwhile, non-infectious diseases are caused by heredity, lack or excess of nutrition, poisoning, and stress, according to the Ministry of Agriculture in 2010.
At this stage, the topic of the problem to be studied will be determined and what solutions will be used to solve the problem.
At this stage, it is done by analyzing what is required by the system, what data will be processed, what information will be presented and how to present the information. The results of the requirements analysis will be used in system design.
At the data collection stage, data collection is carried out using data collection methods to be able to obtain the data needed by the system, namely data on cases of disease in pigs (including symptoms of the disease) taken by documentation techniques at the Department of Agriculture and Food Security, Bali province.
-
3.4. System planning
-
1. C4.5 Algorithm Flowchart Design
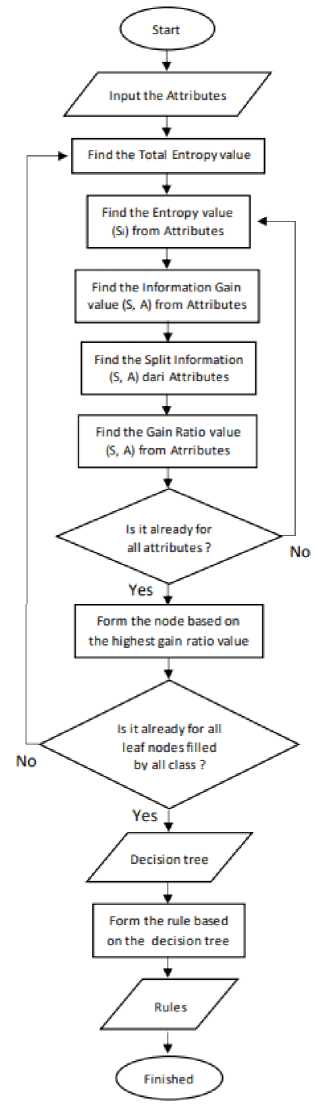
Figure 1. C4.5 Algorithm Flowchart
In the C4.5 Algorithm Flowchart Figure above, it can be seen that it begins by entering all the attributes and classes then calculating them, then continues by calculating the total Entropy of each value in the class using the Entropy equation, then calculating the Entropy value of one of the attributes using the Entropy equation, then calculate the Information Gain for the attribute, then calculate the Split Information for that attribute, then calculate the Gain ratio for that attribute, if all attributes are calculated then a node will be formed based on the highest gain ratio value of one of the attributes, if not all then Back again from the process of calculating the entropy value of the next attribute.
Then if all leaf nodes have been filled by a class, a decision tree can be formed. If not, then you can repeat the step of calculating the total entropy of each value in the class using the Entropy equation. After that a rule can be formed based on the decision tree that has been obtained, then a decision rule will be generated so that the process has been completed.
In In making applications in this study, a database is needed to store the data needed in the development of this application. In this database there are three tables, namely the disease table, symptom table, and knowledge base table.
-
• Disease Table
The Diseases Table will be used to store data about diseases in pigs. In the disease table there are three attributes, namely id_disease to store the ID of the disease with the Integer type and will be the Primary Key and Auto Increament, the disease_code attribute to store the code for disease with type Varchar and string length 11, then the disease_name attribute to store the name of the disease. with Varchar type and string length of 32.
Table 1. Disease Table
|
Attributes |
Type |
Information |
|
id_disease |
integer |
Primary Key, Auto Increment |
|
disease_code |
varchar (11) | |
|
disease_name |
varchar (32) |
-
• Symptom Table
The Symptom Table will be used to store data regarding disease symptoms in pigs. In this symptom table there are three attributes, namely id_symptom to store the id of the symptom with type Integer and will be the Primary Key and Auto Increament, the symptom_code attribute to store the code for symptoms with type Varchar and string length 11, then the symptom_name attribute to store the name of the symptom. symptoms with type Varchar and string length 32.
Table 2. Symptoms Table
|
Attributes |
Type |
Information |
|
id_symptom |
integer |
Primary Key, Auto Increment |
|
symptom_code |
varchar (11) | |
|
symptom_name |
varchar (32) |
-
• Knowledge Base Table
The Knowledge Base table will be used to store data about the knowledge base or rules obtained from the C4.5 Algorithm process. In this knowledge base table there are four attributes, namely id_knowledgeBase to store the ID of the knowledge base with the Integer type and will be the Primary Key and Auto Increament, the disease_code attribute to store the code for disease in the rule with type Varchar and string length 11, then the symptom_code attribute. To store the code for symptoms in a rule with type Varchar and string length 11, then the label attribute will store the label for the rule with type Varchar and string length 11.
Table 3. Knowledge Base Table
|
Attributes |
Type |
Information |
|
id_knowledgeBase |
integer |
Primary Key, Auto Increment |
|
disease_code |
varchar (11) | |
|
symptom_code |
varchar (11) | |
|
label |
varchar (11) |
At this stage, a prototype design of the system is made, such as how it will look in the form of an Android application, how the data input displays and how the output is generated.
At this stage, the C4.5 algorithm design and the prototype that have been made will be implemented into an Android application using the Kotlin programming language, the database design will be created using SQLite Manager as the database.
After the system has been implemented into the Android application and is ready for use, testing will be carried out by comparing the results of the system prediction using the C4.5 algorithm with the attribute class of the testing dataset, then testing the application features whether it is running properly or not.
In calculating the C4.5 Algorithm, it is done by processing the training dataset that has been inputted where the number of training datasets used is 50 datasets. In Table I, a slice of the training dataset has been shown:
Table 4.Data Set Training
|
ID |
G1 |
G2 |
G3 |
G4 |
G5 |
G6 |
… |
G31 |
Class |
|
1 |
No |
No |
Yes |
Yes |
Yes |
No |
… |
No |
Colibacillosis |
|
2 |
Yes |
No |
Yes |
No |
Yes |
No |
… |
No |
African Swine Fever (ASF) |
|
3 |
No |
No |
No |
No |
No |
No |
… |
No |
Swine Pox |
|
4 |
Yes |
No |
Yes |
Yes |
Yes |
No |
… |
Yes |
Erysipelas |
|
5 |
No |
Yes |
Yes |
Yes |
Yes |
No |
… |
No |
Colibacillosis |
|
6 |
Yes |
No |
Yes |
No |
Yes |
No |
… |
No |
African Swine Fever (ASF) |
|
… | |||||||||
|
50 |
Yes |
No |
Yes |
Yes |
No |
No |
… |
No |
Swine Pox |
From these data, there are 8 classes of disease which can be seen in Table II and 31 symptoms which can be seen in Table III.
Table 5. Disease
|
Code |
Names of Disease |
|
P1 |
Colibacillosis |
|
P2 |
African Swine Fever (ASF) |
|
P3 |
Swine Pox |
|
P4 |
Erysipelas |
|
P5 |
Hog Cholera |
|
P6 |
Helminthiasis |
|
P7 |
Streptococcosis |
|
P8 |
Scabies |
Table 6. Symptoms
|
Code |
Names of Symptoms |
|
G1 |
High body temperature (fever) |
|
G2 |
Growth is disrupted / slow |
|
G3 |
Decreased appetite / no appetite |
|
G4 |
Lose weight |
|
G5 |
Limp / not agile |
|
G6 |
Paralyzed |
|
G7 |
Trembling |
|
G8 |
Throw up |
|
G31 |
Conjunctivitis |
The processing steps for the training dataset use the C4.5 algorithm, namely:
-
a. The training dataset is saved in a file with the extension .csv format.
-
b. The file is then uploaded to the android application.
-
c. In the system, the data is processed according to the C4.5 Algorithm where the
entropy, gain, split info, and gain ratio values will be calculated.
-
d. After completing the calculation process, the required data will be entered into the database.
-
e. So that the following Rules can be made:
-
1. IF G21 = Yes AND G29 = Yes THEN class = Streptococcosis
-
2. IF G21 = Yes AND G29 = No AND G4 = Yes AND G10 = Yes THEN class = Hog
Cholera
-
3. IF G21 = Yes AND G29 = No AND G4 = Yes AND G10 = No THEN class = Erysipelas
-
4. IF G21 = Yes AND G29 = No AND G4 = No THEN class = Hog Cholera
-
5. IF G21 = No AND G24 = Yes AND G26 = Yes THEN class = Scabies
-
6. IF G21 = No AND G24 = Yes AND G26 = No THEN class = Swine Pox
-
7. IF G21 = No AND G24 = No AND G20 = Yes THEN class = African Swine Fever
(ASF)
-
8. IF G21 = No AND G24 = No AND G20 = No AND G18 = Yes THEN class =
Helminthiasis
-
9. IF G21 = No AND G24 = No AND G20 = No AND G18 = No THEN class =
Colibacillosis
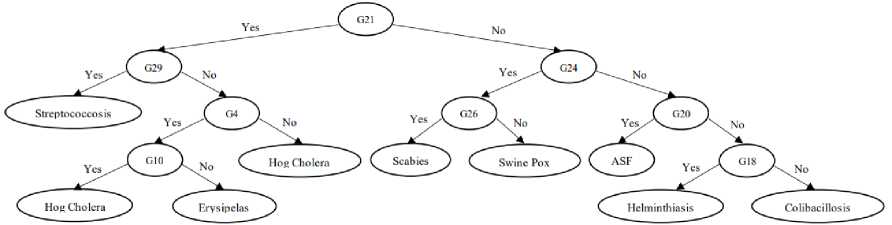
Figure 2. Decision Tree
The main page can be seen in Figure 3.On the main page there are 5 menus consisting of:
-
1. Insert The Data Set File menu, on this menu we can input a file with the .csv format so that later the input data set can be processed using the C4.5 Algorithm and the information contained in the data set can be used in the system.
-
2. Disease menu, in this menu we will be directed to the disease page, where on that page we can see a list of diseases in pigs contained in the data set.
-
3. Symptoms menu, in this menu we will be directed to the symptoms page, where on that page we can see a list of the symptoms of disease in pigs that are contained in the data set.
-
4. Knowledge Base menu, on this menu we will be directed to the knowledge base page,
where on that page we can see a list of the knowledge base or rules obtained using the
C4.5 Algorithm.
-
5. Disease Prediction menu, in this menu we will be directed to the disease prediction
page, where on that page we can input the labels of disease symptoms in pigs then we
will get the prediction results for pig disease.
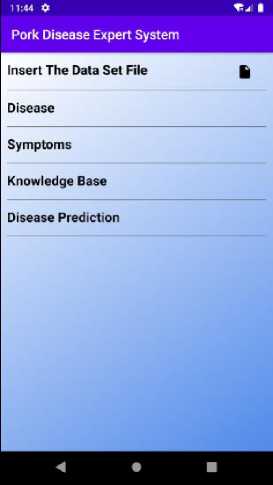
Figure 3. Main Page
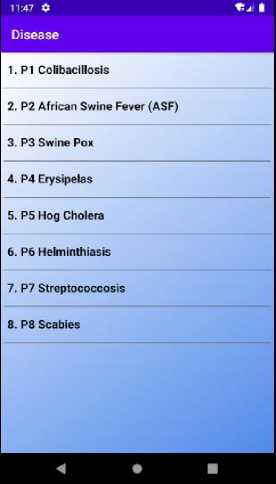
Figure 4. Disease Page
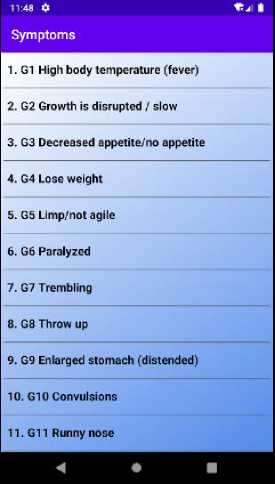
Figure 5. Symptoms Page
11:51 *
Knowledge Base
-
1. If G4 = Ves1 then Hog Cholera
-
2, If G4 = Yes, then Erysipelas
-
3, If G4 = No, then Hog Cholera
-
4. If GIO = Yes, then Hog Cholera
-
5. If GIO - No, then Erysipelas
-
6. If G18 = Yes, then Heiminthiasis
-
7. If G20 = Yes, then African Swine Fever (ASF)
-
8. If G20 = Nor then Helminthiasis
-
9. If G21 = Yes, then Streptococcosis
-
10. if G21 ≡ Yes, then Hog Cholera
-
11. If G21 = Yes, then Erysipelas

Figure 6. Knowledge Base Page
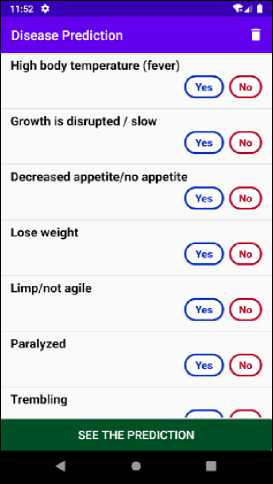
Figure 7. Disease Prediction Page
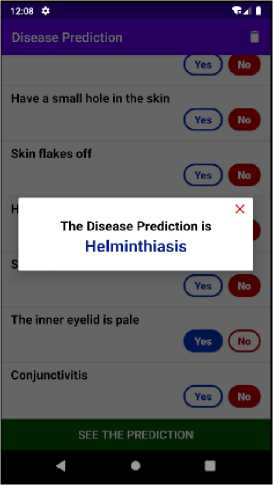
Figure 8. Disease Prediction Dialog
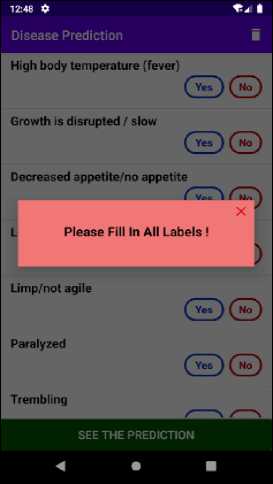
Figure 9. Warning Dialog
Disease page can be seen in Figure 4. On this page a list of diseases is displayed consisting of disease codes and disease names.
Symptoms page can be seen in Figure 5. The page displays a list of symptoms consisting of symptom codes and symptom names.
The Knowledge Base page can be seen in Figure 6. On that page a list of knowledge base or rules is displayed consisting of symptom codes, yes / no labels and disease names.
The Disease Prediction page can be seen in Figure 7. On that page there is a list of disease symptoms along with a yes / no label in the form of a button that we can select, then there is a see the prediction button where if there are symptoms that do not have a label, a dialog will appear as shown in Figure 9 and if all symptoms already have a label, the results of the disease prediction in pigs will be displayed as in Figure 8, there is also a button to delete all recorded labels.
This system is tested using 15 test data sets which can be seen in the following table.
Table 7. Disease Prediction Testing
|
No. |
Class |
System Prediction Results |
Information |
|
1 |
African Swine Fever (ASF) |
African Swine Fever (ASF) |
Corresponding |
|
2 |
Helminthiasis |
Helminthiasis |
Corresponding |
|
3 |
Hog Cholera |
Hog Cholera |
Corresponding |
|
4 |
African Swine Fever (ASF) |
African Swine Fever (ASF) |
Corresponding |
|
5 |
Streptococcosis |
Streptococcosis |
Corresponding |
|
6 |
Colibacillosis |
Colibacillosis |
Corresponding |
|
7 |
Helminthiasis |
Helminthiasis |
Corresponding |
|
8 |
Erysipelas |
- |
Not Corresponding |
|
9 |
Streptococcosis |
Streptococcosis |
Corresponding |
|
10 |
Scabies |
Scabies |
Corresponding |
|
11 |
Hog Cholera |
Hog Cholera |
Corresponding |
|
12 |
Swine Pox |
Swine Pox |
Corresponding |
|
13 |
Scabies |
- |
Not Corresponding |
|
14 |
Swine Pox |
Swine Pox |
Corresponding |
|
15 |
Colibacillosis |
Colibacillosis |
Corresponding |
It can be seen from the test results table that there are 13 suitable prediction results and 2 incorrect prediction results, the accuracy value is obtained, namely:
Accuracy = 13/15 * 100% = 86.7%
-
b. Application Features Testing
Table 8. Application Features Testing
|
Feature / Menu Name |
Input Data |
Expected results |
Observation |
Conclusion |
|
Main page |
There is no |
The main page displays the Insert the data set file, Disease, Symptoms, Knowledge Base, and Disease Prediction menu |
Displays the Insert the data set file, Disease, Symptoms, Knowledge Base, and Disease Prediction menu |
Received |
|
Menu Insert the data set file |
The .csv file contains the training data set |
Files display will appear to select the .csv file |
Displays the Files view |
Received |
|
Disease page |
Click "Disease" |
Displays the List of Diseases |
Displays the Disease List |
Received |
|
Symptoms page |
Click "Symptoms" |
A list of symptoms appears |
Showing a List of Symptoms |
Received |
|
Knowledge Base page |
Click "Knowledge Base" |
List of Knowledge Base appears |
Displays the Knowledge Base List |
Received |
|
Disease Prediction page |
Click "Disease Prediction" |
A symptom list will appear with the button label yes / no, see the prediction button, and the delete button |
Displays a list of symptoms with a button labeled yes / no, button see the prediction, and button delete |
Received |
|
Yes Button label |
Click the Yes Button label |
Button turns blue |
Button turns blue |
Received |
|
Label No Button |
Click the No Button label |
Button turns red |
Button turns red |
Received |
|
See the Prediction Button |
Click See the Prediction Button |
Dialog appears in the formthe result of disease prediction in |
Displays a Dialog in the formthe result of disease |
Received |
|
pigs if all symptoms are labeled and if not, a warning dialog will appear |
prediction in pigs if all symptoms are labeled and if not, a warning dialog will appear | |||
|
Delete Button |
Click Delete Button |
Removes all record labels on every symptoms |
All record labels on each symptoms are removed |
Received |
Based on the results of activities that have been carried outAs for the conclusion that can be obtained is by using the C4.5 Algorithm in predicting disease in pigs using 50 training data sets consisting of 8 diseases and 31 symptoms of disease, the results obtained are an accuracy of 86.7% using 15 data set testing The Android-based application in this study uses the Kotlin programming language and the SQLite database has been able to run well in terms of application features. The suggestion is use more training data and testing data so that the results are even more maximal dan the application should not produce null prediction results.
References
-
[1] Bahri, S., Midyanti, D.M. and Hidayati, R. 2018. Perbandingan Algoritma Naive Bayes dan C4.5 Untuk Klasifikasi Penyakit Anak. Seminar Nasional Aplikasi Teknologi Informasi (SNATi), hal. 24-31. Yogyakarta
-
[2] Buulolo, E. 2020. Data Mining Untuk Perguruan Tinggi. Deepublish. Yogyakarta.
-
[3] Dewi, G.A.M.K. 2017. Materi Ilmu Ternak Babi. Fakultas Peternakan Universitas Udayana. Denpasar.
-
[4] Handayani, I. 2019. Penerapan Algoritma C4.5 Untuk Klasifikasi Penyakit Disk Hernia dan Spondylolisthesis Dalam Kolumna Vertebralis. JASIEK, Vol. 1, No. 2, hal: 83-88. Yogyakarta.
-
[5] Hendriyani, Y. and Karmila, S. 2020. Pemrograman Android Teori dan Aplikasi. Penerbit Qiara Media. Pasuruan.
-
[6] Santosa, I., Rosiyah, H., and Rahmanita, E. 2018. Implementasi Algoritma Decision Tree C.45 Untuk Diagnosa Penyakit Tubercolusis (Tb). Jurnal Ilmiah NERO, Vol. 3, No.3, hal: 169-176. Madura.
-
[7] Sihombing, D.T.H. 1997. Ilmu Ternak Babi. Fakultas Peternakan IPB. Bogor.
This page is intentionally left blank
116
Discussion and feedback