Pitch Transcription of Solo Instrument Tones Using the Autocorrelation Method
on
p-ISSN: 2301-5373
e-ISSN: 2654-5101
Jurnal Elektronik Ilmu Komputer Udayana
Volume 8, No 3. February 2020
Pitch Transcription of Solo Instrument Tones Using the Autocorrelation Method
Sofia Shieldy Budhiono1, I Dewa Made Bayu Atmaja Darmawan2
aInformatics Department, Udayana University Bali, Indonesia
Abstract
Pitch transcription is basically identifying and copying pitch on an audio or music. In this case, the pitch of a solo instrument music is processed to find the composition of the music tones, the method used is autocorrelation. After processing, the system will produce pitch transcription results from the audio that has been processed. this research done digitalization of an old method of identifying pitches into an application that is able to transcribe pitches in an audio. This Pitch Transcription application was created using the Python programming language with Librosa library as a library for audio processing. The purpose of making this system is to facilitate the identification of pitch from a solo instrument music. This Application Feature itself besides being able to show the results of pitch transcription can also display the Onset Graph, Signal Graph play the results of the synthesis transcribed audio sounds. Testing in this study uses audio sourced from 4 single instruments, there are flute, piano, violin and acoustic guitar. The test results show that the implementation of the autocorrelation method in the solo instrument tone transcription application has an accuracy of 92.85%.
Keywords: Pitch Transcription, Autocorrelation, Solo Instrument, Librosa, Python
-
1. Introduction
Music is a unique phenomenon that can be produced by several musical instruments. Music itself is a combination of several components such as tone, harmony, rhythm that create a unity. One interesting musical component to be investigated is the pitch, the pitch is a sound with a certain frequency which in a certain order can create a scale [3].
In creating music the musicians play a number of tones on the instrument and record it, the recording will be heard again to assess whether the tones are good enough to be used as a song, if it is good enough then the musician will transcribe the tones from the recording to the lyrics, the process of transcribing This tone sometimes takes a long time for some people because they have to try the tones one by one using musical instruments, moreover beginners and laymen musicians still have difficulty in identifying the tones of music, the process of transcribing pitches can be quickly done with the pitch transcription application.
Each pitch has a different basic frequency, uniqueness at this frequency that can be processed by computers so that computers can identify one pitch with another. One method that can be used to transcribe pitch is the Autocorrelation Method [6]. Autocorrelation is very often used in detecting pitch because it gives fast and good results on stable pitchs [6]. However, this method applies a pitch-based onset detector, which will provide a fairly visible response to the change of tone, so this method is suitable for monophonic music which means that music is played one note at a time and instruments cannot played overlap.
In the implementation of the Autocorrelation Method there are several related studies including research conducted by Dermawan (2015) which examines the comparison between the
Autocorrelation method and the Zero Cross Rate Method in calculating the frequency of the Gamelan Gender Wayang, the results of the study show that autocorrelation is better in calculating the frequency of Gamelan Gender Wayang[1]. Furthermore, research conducted by Rani (2012) that discusses the pitch detection algorithm designed to estimate the fundamental frequency of periodic signals such as the time domain and frequency domain, one of the time domain methods discussed is the autocorrelation method [2]. Furthermore, research conducted by Velankar.M (2018) compared the autocorrelation method with the Harmonic Product Spectrum (HPS) method, the final results of the study showed that the autocorrelation method with increased audio segmentation was superior to the HPS method [3].
This paper focuses on aiming to build an application that can do pitch transcriptions automatically by applying the autocorrelation method, where users input audio files and the application will process audio signals and provide pitch transcription results. This application was built using the Python programming language with Librosa library as a tool for audio processing. The limitation in this research is the formatted music input file (* .wav), the input audio file is the result of the sound of a solo instrument.
System design is important in building a system. The system built includes detecting onset, estimating pitch using the autocorrelation method, producing pure tones from the estimation of pitch and displaying pitch transcriptions. The following is a general description of system work.
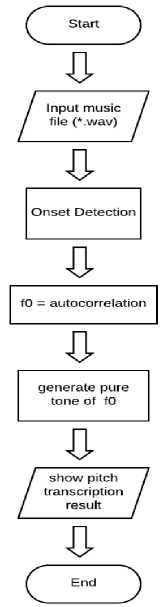
Figure 1. General Design Diagram
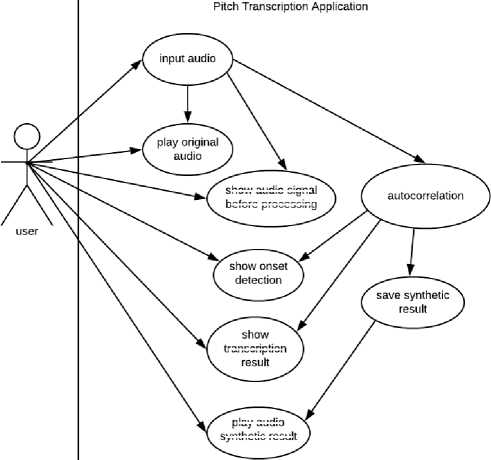
Use Case Diagrams are diagrams that consist of actors, use cases, and interactions between them which introduce a system. Use cases provide a brief description of the relationship between usecase, actors, and systems. In this use case, you will find out what functions are in the system created. In this case the features that can be performed by actors are audio input, listening to audio, viewing graphic signals of audio before processing, viewing graphs onset and viewing the results of tone transcription. Here is a picture of the use case diagram.
transcription
olay audio
synthetic result
show onset
detection
audio signa
before processing
Figure 2. Use Case Diagram
In this research, onset detection is used to segment tones, in order to sort out the sequence of tones to be processed one by one to the autocorrelation method. Most of the onset detection functions are based on the concept of detecting changes in the character of the audio signal. If the audio signal is observed in the frequency-time domain there is an increase in energy (magnitude) in several frequency ranges then this will be considered as onset [8]. The onset detection process is usually divided into three parts, there are signal pre-processing, calculation of the onset detection function (ODF), and peak detection [7].
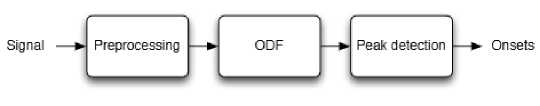
Figure 3. General Process of The Onset Detection
Pre-processing stage is an optional stage where signal separation occurs into several frequency bands (filtering) using STFT with Hann window ^ (m) and a frame rate of 100Hz, the resulting Spectrogram X (n, k) (where the nth frame and bin number k-frequency) where the window size N = 2048 (46 ms at the sampling rate r = 44100 Hz) and hop size h = 441 [7].
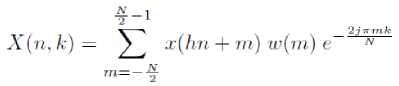
(1)
At the calculation phase of the onset detection function (ODF), measurements are made of how fast the frequency changes with the spectral flux (SF) method are calculated by calculating the difference between the two time spectrums in each frequency bin, then the difference results will be totalize [9]
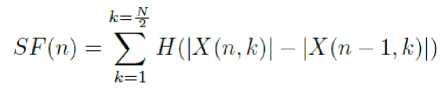
(2)
Next is the stage to select the onset of the ODF results, first of all tresholding is done to get rid of SF values that are not onset. Then look for the maximum value of the tresholding results, in this process the tresholding value of the before and after frame is needed.
Autocorrelation is used to estimate fundamental frequency (f0). Autocorrelation is useful for finding repetitive patterns in a signal, referring to the relationship of a series of time series values between the previous value and the future value [1]. Autocorrelation calculations are calculated using FFT, which has the computational complexity of N x log (N), where N is the window length signal [6]. Because of that the calculation process is very fast. Autocorrelation shows good detection as long as the sound pitch is stable [3]. The stable part of the pitch is right after a sudden change in energy or onset, where all harmonics become stable and are clearly marked in the spectrum. The autocorrelation function for the x signal is indicated by:
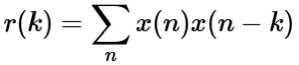
(3)
Where the k is the lag or period length, and x (n) is the time domain signal. This function is very useful in identifying hidden periodicities in signals, for example on weak fundamentals [6]. The peak in the autocorrelation function lies in the lag with stronger periodicity, ie at the zero lag or r (0).
Implementation of the autocorrelation function in the Librosa library along with taking the peak value of the autocorrelation function
r = librosa.autocorrelate(segment) i_min = sr/fmax
i_max = sr/fmin
r[:int(i_min)] = 0
r[int(i_max):] = 0
i = r.argmax()
f0 = float(sr)/i
return f0
The value of r is the value that holds the results of the calculation of the signal spectrum using FFT, the values of i_min and i_max are used to normalize the results of spectrum calculations so that
non-fundamental frequencies are ignored. The value of i is the location of the peak, and f0 is the fundamental frequency of the tone.
In this study, data is needed as test data, the test data used are audio files with * .wav format from the sound recordings of 4 types of musical instruments namely flute, piano, guitar, and violin. Each musical instrument is taken 6 audio recordings so that in total there are 24 audio recordings. Each recording will contain a combination of one-octave tones such as C4, D4, E4, F4, G4, A4, and B4, so that there are 168 total tones tested. Every audio data will be tested whether the pitch contained is properly transcribed or not.
-
3. Result and Discussion
-
3.1. Implementasi
-
The following is the result of the implementation of the pitch transcription application display made with the Tkinter library
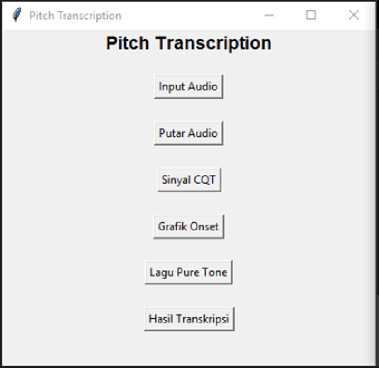
Figure 4. Main Display of Pitch Transcription Application
In the application’s main menu there are 6 menu options, namely the “Input Audio” menu for inputting audio recordings, the “Putar Audio” menu for playing audio before synthesizing, the “Sinyal CQT” menu for displaying signal figures before processing, the “Grafik Onset” menu for displaying tone segmentation graphs in audio, the “Lagu Pure Tone” menu for playing the audio synthesis of the autocorrelation calculation results, and the “Hasil Transkripsi” menu to see the pitch transcription results Figure.
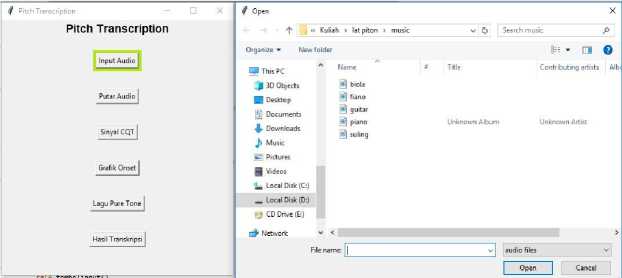
Figure 5. Menu Display Input Audio
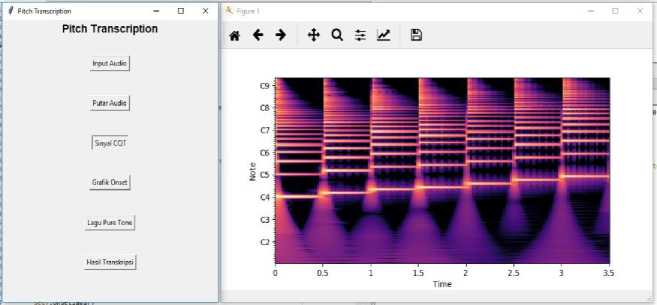
Figure 6. The Application Display Shows The Signal
During the testing, each tone of 4 instruments that have been recorded is checked, the recording data itself is primary data. The picture below is a picture of the results of testing one of the violin sound recordings.
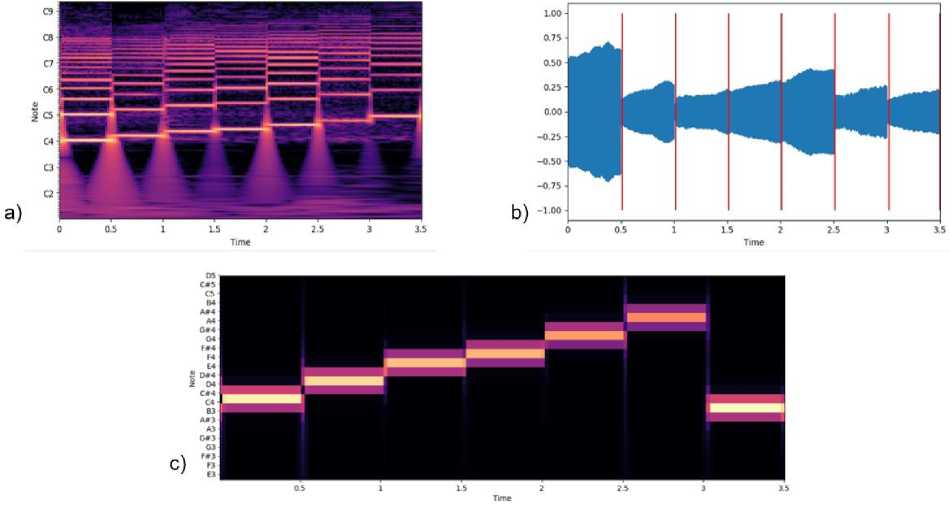
Figure 7. Violin Sound Test Results
Figure 6a. is a spectrogram signal image before processing, Figure 6b. is a tone segmentation image resulting from onset detection. Then Figure 6c. is a pitch transcription image. Next is testing the accuracy of the autocorrelation method to transcribe pitch from musical instruments.
Transcription experiments on violin musical instruments show an accuracy rate of 92.85%, while transcription errors occur in notes A and B wherein some audio autocorrelation methods incorrectly transcribe these pitch into other pitch or lower octave pitch. Compare Figure 6a. and 6c. where is picture 6a. is a spectrogram image of violin sound before performing the autocorrelation process, but the results of Figure 6a. in contrast to Figure 6b, where B is estimated to be 1 octave lower than B in Figure 6a, the synthesized sound also produces B with lower octave. The following are tables of pitch transcription results with autocorrelation on several musical instruments
Table 1. Results of A Violin Pitch Transcription Experiment
|
C |
D |
E |
F |
G |
A |
B |
False |
True | |
|
Violin 1 |
v |
v |
v |
v |
v |
v |
v |
0 |
7 |
|
Violin 2 |
v |
v |
v |
v |
v |
x |
v |
1 |
6 |
|
Violin 3 |
v |
v |
v |
v |
v |
v |
v |
0 |
7 |
|
Violin 4 |
v |
v |
v |
v |
v |
v |
v |
0 |
7 |
|
Violin 5 |
v |
v |
v |
v |
v |
v |
x |
1 |
6 |
|
Violin 6 |
v |
v |
v |
v |
v |
v |
x |
1 |
6 |
|
Percentage |
7.42 % |
92.85 % | |||||||
Table 2. Results of Acoustic Guitar Pitch Transcription Experiments
|
C |
D |
E |
F |
G |
A |
B |
False |
True | |
|
Guitar 1 |
v |
v |
v |
v |
v |
x |
v |
1 |
6 |
|
Guitar 2 |
v |
v |
v |
v |
v |
v |
v |
0 |
7 |
|
Guitar 3 |
V |
v |
v |
v |
v |
v |
v |
0 |
7 |
|
Guitar 4 |
v |
v |
v |
v |
v |
v |
v |
0 |
7 |
|
Guitar 5 |
v |
v |
v |
v |
v |
x |
x |
2 |
5 |
|
Guitar 6 |
v |
v |
v |
v |
v |
v |
x |
1 |
6 |
|
Percentage |
9.52 % |
90.47 % | |||||||
Table 3. Results of Piano Pitch Transcription Experiments
|
C |
D |
E |
F |
G |
A |
B |
False |
True | |
|
Piano 1 |
v |
v |
v |
v |
v |
v |
v |
0 |
7 |
|
Piano 2 |
v |
v |
v |
v |
v |
v |
v |
0 |
7 |
|
Piano 3 |
V |
v |
v |
v |
v |
v |
v |
0 |
7 |
|
Piano 4 |
v |
v |
v |
v |
v |
v |
v |
0 |
7 |
|
Piano 5 |
v |
v |
v |
v |
v |
v |
x |
1 |
6 |
|
Piano 6 |
v |
v |
v |
v |
v |
v |
x |
1 |
6 |
|
Percentage |
4.76 % |
95.23 % | |||||||
Table 4. Results of The Flute Pitch Transcription Experiment
|
C |
D |
E |
F |
G |
A |
B |
False |
True | |
|
Flute 1 |
v |
v |
v |
v |
v |
v |
x |
1 |
6 |
|
Flute 2 |
v |
v |
v |
v |
v |
v |
x |
1 |
6 |
|
Flute 3 |
v |
v |
v |
v |
v |
x |
v |
1 |
6 |
|
Flute 4 |
v |
v |
v |
v |
v |
v |
v |
0 |
7 |
|
Flute 5 |
v |
v |
v |
v |
v |
v |
v |
0 |
7 |
|
Flute 6 |
v |
v |
v |
v |
v |
v |
v |
0 |
7 |
|
Percentage |
7.42 % |
92.85 % | |||||||
In the table above it can be seen that transcribing the notes of the flute, piano, violin and guitar with the autocorrelation method has a pretty good accuracy, the average accuracy of the four instruments is 92.85%. errors in the pitch transcription process often occur in notes A and B.
-
4. Conclusion
The conclusion of this study is the application of pitch transcription on solo instrument using the autocorrelation method can transcribe pitch with high accuracy. The autocorrelation method is a fundamental frequency detection method of a signal. In testing the pitch transcription of some musical instruments with the autocorrelation method produces an accuracy value of 92.85%, transcription errors often occur in A and B tones is most likely due to the recording quality where note A and B sounds weaker than other tones in some recording and there is noise in the recording.
References
-
[1] Darmawan, I. D. M. B. A. (2015). Perbandingan Metode Zcr Dan Autocorrelation Untuk
Menghitung Frekuensi Pada Gambelan Gender Wayang. Jurnal Ilmu Komputer, 8(2).
-
[2] Rani, S., & Jain, N. (2015). A Review of Diverse Pitch & Detection Methods. International
Journal of Science and Research, 4(3), 1680-1683.
-
[3] Velankar, M., Deshpande, A., & Kulkarni, P. (2018). Music Melodic Pattern Detection with
Pitch Estimation Algorithms.
-
[4] De Cheveigné, A., & Kawahara, H. (2002). YIN, a fundamental frequency estimator for
speech and music. The Journal of the Acoustical Society of America, 111(4), 1917–1930. doi:10.1121/1.1458024
-
[5] Wightman, F. L., & Green, D. M. (1974). The perception of pitch. Sigma Xi
-
[6] Monti, G., & Sandler, M. (2000, December). Monophonic transcription with autocorrelation.
In Proceedings of the COST G-6 Conference on Digital Audio Effects (DAFX-00) (pp. 25760).
-
[7] Böck, S., Krebs, F., & Schedl, M. (2012, October). Evaluating the Online Capabilities of
Onset Detection Methods. In ISMIR (pp. 49-54).
-
[8] Dixon, S. (2006). Simple spectrum-based onset detection. MIREX 2006, 62.
-
[9] Bello, J. P., Daudet, L., Abdallah, S., Duxbury, C., Davies, M., & Sandler, M. B. (2005). A
tutorial on onset detection in music signals. IEEE Transactions on speech and audio processing, 13(5), 1035-1047.
-
[10] Gaffar, I., Hidayatno, A., & Zahra, A. A. (2012). Aplikasi Pengkonversi Nada-nada
Instrumen Tunggal Menjadi Chord Menggunakan Metode Pitch Class Profile. Transient, 1(3), 121-127.
355
Discussion and feedback