Real Time Pitch Detection For Vocal Tuning Using FFT Algoritma And Spectrogram
on
p-ISSN: 2301-5373
e-ISSN: 2654-5101
Jurnal Elektronik Ilmu Komputer Udayana
Volume 8, No 3. February 2020
Real Time Pitch Detection For Vocal Tuning Using FFT Algoritma And Spectrogram
Devin Reness Noaka1, I Dewa Made Bayu Atmaja Darmawan a2
aInformatics Department, Mathematics and Science Faculty, Udayana University Jalan Raya Kampus Unud, Bukit, Jimbaran, Bali, Indonesia
Renessdevin@gmail.com Dewabayu@cs.unud.ac.id
Abstract
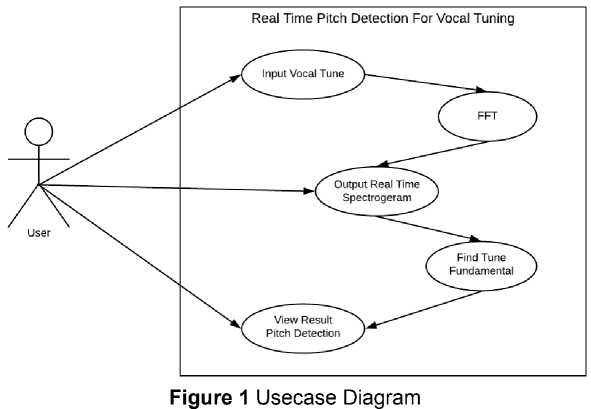
The song is a means of entertainment most often heard by humans where in the song consists of music and vocals. Good quality music and vocal singers will make a song more pleasant to hear. To make the song sound tunable and in accordance with the rhythm can be done by adjusting the vocals according to the tone of the song. From this we know that measuring sound frequencies needs to be done to determine whether a frequency or period is loud, it can also be used as a tool in vocal training, one of them for vocal tuning applications to find the harmonious sound of the sound. Moreover, it can be used as a learning need in Sound Frequency Processing. Where one of the parts to create a vocal tuning application can be through the Real-time spectrogram program. This RTS uses Pyaudio as sound recording, uses the Python 3.6 programming language and uses the Fast Fourier Transform method which will help when making real-time spectrogram and pitch detection programs. The test results obtained 75% accuracy in real-time pitch detection programs.
Keyword : Real-Time Pitch Detection, Real-Time Spectogram, Fast Fourier Transform , Sound Frequency Processing
The development of technology every year continues to grow, many emerging new innovations related to technology. This can be proven in technological advances in processing various kinds of data, one of which is sound. Sound is a phenomenon that has been recognized by humans since birth. Where before the development of physics as now, humans only know that the sound is the result of vibrations from an object or the result of the collision of two objects. Now that measurements of sound have developed rapidly, many sound frequency measuring devices can be used. Therefore, measuring sound frequency is more difficult if done manually using formulas and several methods, because it takes a long time and there may be errors in the district. Starting from the problems mentioned above, the author will conduct research related to the implementation of real-time spectrograms. The spectogram itself is a visualization that is used to show the frequency of sound at a certain time unit where this spectrogram can be applied in real life such as tuning applications that uses a real-time spectrogram which is the development of a spectogram usually to provide information on the results of tones produced from a musical instrument. Real-time spectrograms can efficiently review large amounts of acoustic data, while measuring, extracting, and storing sound parameters and sound segments directly from the screen [5]. Real-time Spectrograms are designed to efficiently analyze all sound files. Users can navigate sound files quickly, audition, edit, measure and save interesting sound events. The making of real-time spectrogram this time is by using the fast fourier transform method [7]. The Fast Fourier transform (FFT) method is an algorithm that calculates a discrete fourier transformation (DFT) of a sequence, or the opposite (IDFT). Fourier analysis converts signals from the original domain (often time or space) to representations in the frequency domain and vice versa. In making the real-time spectrogram, there are related studies that are used, among others, the making of an application for using voice using FFT to find out the sound frequency of a number of people speaking. Where the output of the application produces visualization of FFT frequency, sound signal waves and a series of time values in the sound data file [6].
In this research, several important things need to be done such as analyzing data needs to, collecting data, and implementing it as a reference in making pitch detection with real-time spectogram.
In addition to the existence of Fourier Series, Fourier Transform is also known for its existence (Fourier Transform). Joseph Fourier proposed a periodic function that can be represented by combining the sum and functions of sines and cosines. This function representation is then known as Fourier Series. A few years after this discovery, the Fourier Series was developed into a more general form so that it could be used in non-periodic functions, this more general form which became known as the Fourier Transform [3].
Usually a function is described in the time domain, meaning that measured from the function is time. In other words, if the function is represented on the symmetry axis, then the x axis (as an independent variable) represents time, and the y axis (as an independent variable) represents the value at a certain time t, or its amplitude value [4]. In its application, this representation is not always the best representation. In many cases, special information is hidden in the frequency value. By using Fourier Analysis the time-amplitude representation will be transformed so that it becomes a frequency-amplitude representation. This means that the x axis represents the frequency and the sumbu axis represents the amplitude value. As shown in the figure below
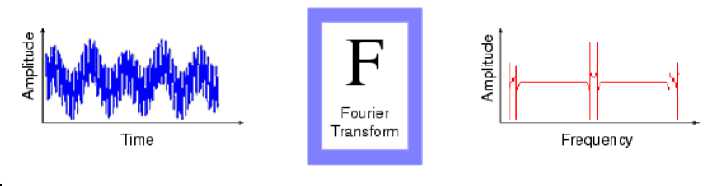
Figure 2 Analysis Fourier
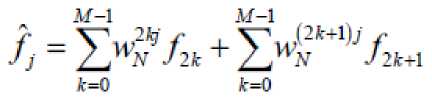
Fast Fourier Transform is an algorithm used to represent signals in discrete time domains and frequency domains. Obtained from the DFT definition for vector data with length N requires N multiplication and N addition. So if used N in large numbers will cause millions of DFT calculation operations. To facilitate calculations, the Fast Fourier Transform (FFT) technique appears [3].
FFT is a DFT that has a smaller amount of computing than ordinary DFT computing. DFT will
produce a computational amount of N2 while FFT will produce a computational amount of (N) log2 (N). So that FFT becomes a practical method of DFT for large amounts.
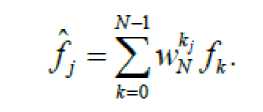
(1)
Suppose that N can be divided into 2 so that Equation (1) is divided into 2 the parts are for k even and k odd. Next, given a new variable with
So obtained
(2)
If known that
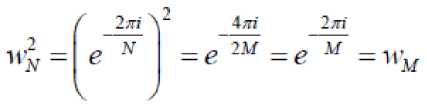
(3)
then substituting Equation (3) in Equation (2) is obtained
(4)
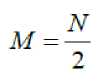
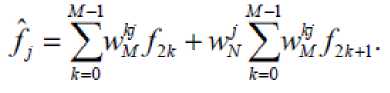
After the time domain is divided by 2, the frequency domain is also divided by 2 so that it is with divide the frequency in Equation (4) then
(5)
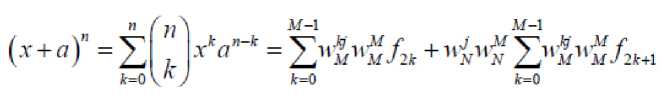
Because W1= = 1 and W=, Equation (5) becomes
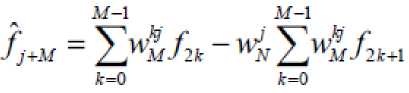
(6)
-2τπ'
-2jπ
where N is the amount of data,
n iγ
This equation is known as FFT.
A spectrogram is a visual representation of the frequency spectrum in sound or other signals because it is different from the mass or some other variable. Spectrograms are sometimes called spectral waterfalls, voiceprints, or voicegrams. Spectrograms may be used to recognize phonetic words of utterance.
They are widely used in the development of music, sonar, radar and speech processing, seismology, and so on. The instrument that holds the spectrogram is called the spectrograph. The real programmaker is playing the violin. Pay attention to the harmonics that apply to the entire multiplication of the fundamental frequency numbers. Consider the fourteen series of arcs, and visual differences in tone.
Musical scales are sequential arrangement of the basic notes of a tone system, starting from one of the basic tones to the octave, for example do, re, mi, fa, so, la, si, do. Inside the scale has its harmonious tone which is a set of certain octave values. For example in Figure 2 the C note is a Do note composed of several octaves as shown in Figure 3.
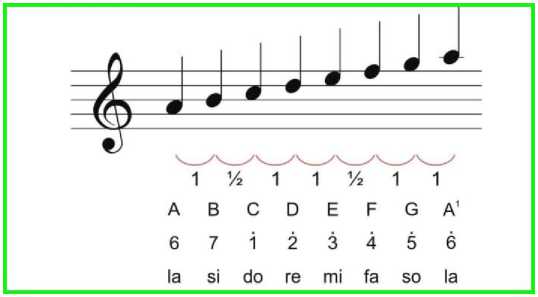
Figure 3 Musical Scale
|
Oktaf 1 |
Oktaf2 |
Oktaf 3 | |
|
C |
130.8 |
261.6 |
523.3 |
|
c# |
138.6 |
277.2 |
554.4 |
|
D |
146.8 |
293.7 |
587.3 |
|
D# |
155.6 |
311.1 |
622.3 |
|
E |
164.8 |
329.6 |
659.3 |
|
F |
174.6 |
349.2 |
698.5 |
|
F# |
185.0 |
370.0 |
740.0 |
|
G |
196.0 |
394.0 |
784.0 |
|
G# |
207.7 |
415.3 |
830.6 |
|
A |
220.0 |
440.0 |
880.0 |
|
A# |
233.1 |
466.2 |
932.3 |
|
247.0 |
493.9 |
987.8 |
Figure 4 Harmonious Tone
The data in this study were obtained by observing and searching accordingly and can be clearly visualized by the spectrogram. From the appropriate search results will be used as a basis for implementing pitch detection from the real-time spectrogram.
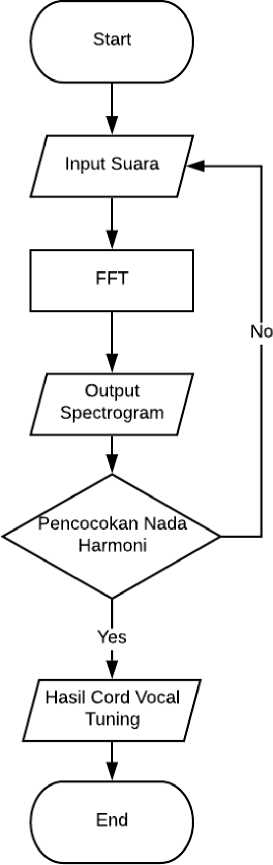
Figure 5 Flowchart Programs
Explanation of flowchart is a program flow real-time pitch detection that has been implemented in the Python 3.6 programming language. In the flowchart there is input in the form of voice, there is a process of changing the signal from the discrete time domain and frequency using FFT then changing it into the spectrogram visualization, then matching harmonious tones and finding out the final results in the form of pitch detection tones.
The design of the flowchart that has been made will be implemented into the Real-Time Spectogram to make real-time pitch detection in the python programming language. He chose to use the Python programming language because of the easy programming syntax and the use of a complete supporting library to facilitate the loading of this Real-Time Pitch Detection.
Python is a high-level general-purpose programming language that is interpreted with philosophy. The Python design emphasizes code readability with the use of significant spaces. The language construct and object-oriented approach aim to help programmers write clear and logical code for small and large-scale projects. [2] Python is typed and collected dynamically. This supports
several programming paradigms, including procedural, object-oriented and functional programming. Python is often described as a "battery included" language because of a comprehensive standard library.
In making the Real-Time Spectogram in Python this time it will be visualized with the output that is "*" star print if there is a frequency, then " | " print the line as Hz difference, and print " " space as empty frequency (noiseless) & the distances at the output are like in the image below.
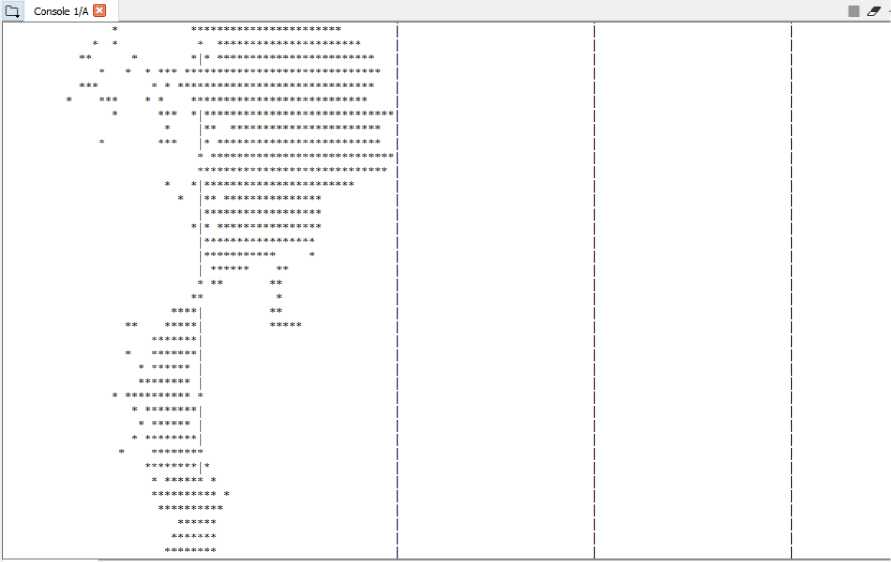
Figure 6 OutPut Real-Time Spectogram
The picture above is the output of the real-time spectrogram from the data inputted using a microphone is a whistling of sound from the lips so it displays the output as shown above.
In the testing phase using the comparison method that is comparing, this time the vocal data that has been collected will be tested using the usual spectogram measuring instrument that is accessed via page [1] and seen its visualization. then proceed by using real-time spectogram tools that can already be implemented as a trial phase.
Figure 7 Ordinary Spectrogram DO Vocal Tone
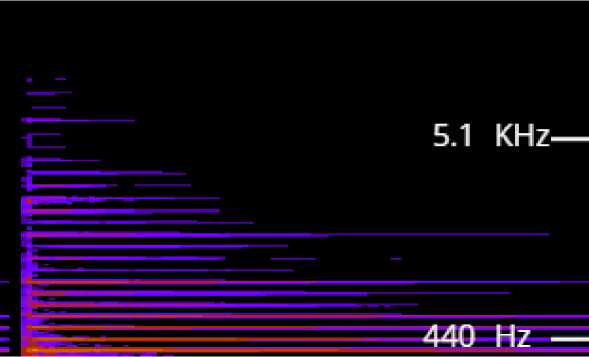
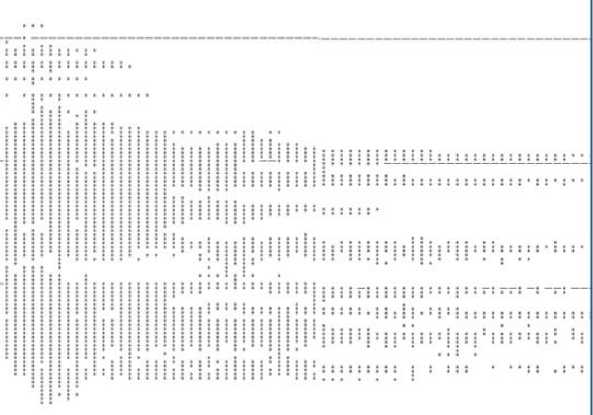
Figure 8 Real-Time Spectrogram Tone DO Vocal
The picture above is a comparison between visualization of frequency in do vocal tones. Seen from the picture, the exact similarities are from the results of the ordinary spectogram, but there is bit error in the real-time spectogram results because unexpected noise is recorded, so there is a slight change in the visualization of the real-time spec-togram output which results in an error in the real-time results. time pitch detection.Following are the results of real-time pitch detection testing using black box testing techniques.
In testing using a total of 24 recorded voice vocal sound data and the success rate of recorded data as many as 18 recorded voice data format * .wav and 6 data said failed.
Table 1 Program Testing With Comparison
|
No |
Test Data |
Testing Scenarios |
Test Result |
The Results |
|
1 |
Jaz_the_man-2_do.wav |
Do Vocal |
Almost Similar |
Fail |
|
2 |
Jaz_the_man-2_re.wav |
Re Vocal |
Similar |
Succeed |
|
3 |
Jaz_the_man-2_mi.wav |
Mi Vocal |
Similar |
Succeed |
|
4 |
Jaz_the_man-2_fa.wav |
Fa Vocal |
Similar |
Succeed |
|
5 |
Jaz_the_man-2_sol.wav |
Sol Vocal |
Similar |
Succeed |
|
6 |
Jaz_the_man-2_la.wav |
La Vocal |
Almost Similar |
Fail |
|
7 |
Jaz_the_man-2_si.wav |
Si Vocal |
Similar |
Succeed |
|
8 |
Jaz_the_man-3_do.wav |
Do Vocal |
Similar |
Succeed |
|
9 |
Jaz_the_man-3_re.wav |
Re Vocal |
Similar |
Succeed |
|
10 |
Jaz_the_man-3_mi.wav |
Mi Vocal |
Similar |
Succeed |
|
11 |
Jaz_the_man-3_fa.wav |
Fa Vocal |
Similar |
Succeed |
|
12 |
Jaz_the_man-3_sol.wav |
Sol Vocal |
Almost Similar |
Fail |
|
13 |
Jaz_the_man-4_la.wav |
La Vocal |
Similar |
Succeed |
|
14 |
Jaz_the_man-4_si.wav |
Si Vocal |
Similar |
Succeed |
|
15 |
Jaz_the_man-4_mi.wav |
Mi Vocal |
Similar |
Succeed |
|
16 |
Jaz_the_man-4_fa.wav |
Fa Vocal |
Almost Similar |
Fail |
|
17 |
Jaz_the_man-6_sol.wav |
Sol Vocal |
Similar |
Succeed |
|
18 |
Jaz_the_man-6_la.wav |
La Vocal |
Almost Similar |
Fail |
|
19 |
Jaz_the_man-6_si.wav |
Si Vocal |
Similar |
Succeed |
|
20 |
Jaz_the_man-6_do.wav |
Do Vocal |
Similar |
Succeed |
|
21 |
Jaz_the_man-1_do.wav |
Do Vocal |
Similar |
Succeed |
|
22 |
Jaz_the_man-1_re.wav |
Re Vocal |
Similar |
Succeed |
|
23 |
Jaz_the_man-1_mi.wav |
Mi Vocal |
Almost Similar |
Fail |
|
24 |
Jaz_the_man-1_fa.wav |
Fa Vocal |
Similar |
Succeed |
In the table above it can be seen that the results of the actualization of the real-time spectrogram for the vocal by the fast fourier transform method have a pretty good accuracy, the average accuracy of the four instruments is 75%. errors in the process of visualization so that the results of the program do not know the vocal tone.
Based on the results and discussion presented in the previous chapter, the following conclusions can be drawn:
-
a. A real-time pitch detection program has been created using the Fast Fourier Transform (FFT) algorithm which can later be used to visualize the sound frequency of sounds.
-
b. In testing, real time pitch detection for vocal tuning with the Fast Fourier Transform method produces an accuracy value of 75%, an error in the visualization process so that the final results in the program do not know the vocal tone.
References
-
[1] spectrum analyzer — academo.org - free, interactive, education., 2019.
-
[2] Dave Kuhlman. A python book: Beginning python, advanced python, and python exercises. Dave Kuhlman Lutz, 2009.
-
[3] Kreyszig, E.,2006., Advanced Engineering Mathematics (9th Edition)., United States: John Wiley & Sons, Inc.
-
[4] La Dini, Budiani., 2009., Penentuan Periode Curah Hujan Kabupaten Manokwari
Menggunakan Transformasi Fourier dan Wavelet. Skripsi. Jurusan Fisika FMIPA Universitas Negeri Papua Manokwari
-
[5] Trio Safaat. Implementasi fast fourier transform pada pengenalan nada piano berba- sis android. Tekik Informatika, Fakultas Sains Dan Teknologi, Universitas Islam Maulana Malik Ibrahim, Malang, 2016.
-
[6] Harun Sujadi, Ii Sopiandi, and Agis Mutaqin. Sistem pengolahan suara menggunakan algoritma fft (fast fourier transform). 2017.
-
[7] Arif Syaifuddin and Suryono Suryono. Fast fourier transform (fft) untuk analisis sinyal suara doppler ultrasonik. Youngster Physics Journal, 3(3):181–188, 2014.
332
Discussion and feedback