Prediction of User Loyalty Using the Naive Bayes Method in the 'Goprint' Online Printing Marketplace
on
p-ISSN: 2301-5373
e-ISSN: 2654-5101
Jurnal Elektronik Ilmu Komputer Udayana
Volume 8, No 3. February 2020
Prediction of User Loyalty Using the Naive Bayes Method in the "Goprint" Online Printing Marketplace
Gede Widiastawana1, I Gusti Agung Gede Arya Kadyanana2
aInformatics Department, Udayana University Bali, Indonesia 1gedewidiastawan@gmail.com 2gungde@unud.ac.id
Abstract
Goprint is an Online Printing Marketplace that connects printing services with users who want to print documents quickly without the need to queue. In the span of time from April 2019 to September 2019 it was found that the number of Goprint users reached 407 users, 24 partners, and 256 orders. From transactions that have been carried out by users, not a few orders are often canceled due to ineffective Goprint features or poor partner performance. This causes Goprint users to feel dissatisfied with the services provided by the Goprint application. The Naive Bayes algorithm is one of the algorithms used for classification or grouping of data, but can also be used for decision making. With this algorithm and the problems that occur, the authors make a system to predict the loyalty of Goprint users to anticipate users who stop leaving Goprint because they are not satisfied or loyal users. The data used as training data is 20 and testing data is 10. From the test results it is found that the value of precision is 80%, 100% recall, and 90% accuracy.
Keywords: Naïve Bayes Classifier, Big Data, Rest API, Printing, Loyality
Goprint is a mobile application where this application is a bridge that connects students with other students who have a printer at their boarding house, or it can also be a printing place near them. With this application students can easily and quickly to print reports or assignments that may be needed quickly due to the close deadline as well, besides that printing places sometimes more than 7 nights are closed, this causes students to not be able to print their assignments on that night too. With the Goprint application, students only need to upload documents and the user will get a recommendation for the nearest and cheapest printing place that is ready to accept printing requests that have been previously described by the user. There are currently 213 users registered in the Goprint app and 17 users registered as partners. As many as 55 orders from users over the past month. Factors that can affect the number of orders are the service of the Goprint itself, printing costs, and the number of printing sites that exist.
Service is one of the main factors that can affect the number of orders by users. Services can be in the form of features provided and the speed of partner response when a user makes a printing order. If the features provided are less effective then the user will find the application itself less useful for solving problems in terms of document printing. Similar to the speed of partner response, when users search for printing sites or wait for printouts, if the response from partners is slow then the user might be switched to another printing place even if the case is more than once then it is certain the user will finish using the application Goprint.
Forecast or prediction of user loyalty is needed by the Goprint itself to determine whether there are users who will finish using Goprint or not. Based on the explanation above, the writer makes a user loyalty prediction application using the Naive Bayes method where the data taken is from the Rest API Goprint. The Naive Bayes algorithm predicts future opportunities based on past experience so it is known as the Bayes Theorem. The main characteristic of the Naïve Bayes Classifier is a very strong assumption (naive) of independence from each condition / event [4].
With this prediction, Goprint can follow up on cases obtained by the user before the user finishes using the Goprint application or does not return to using the application.
Previous tests using Naive Bayes have been conducted by Bahrawi As'ad to be able to show predictions from each experiment with different levels of prediction accuracy in each method used. The results of the test found that the accuracy and performance of machine learning is very dependent on existing data and understanding of the methods used [3]. The research that discusses the predictions of customers who have the potential to open deposit deposits conducted by Alvino Dwi Rachman Prabowo and Muljono. The results of this study were obtained prediction accuracy of customers using Naive Bayes by 82% [2]. For testing with other methods there is research conducted by Adi Sucipto and Akhmad Khanif Zyen, namely Development of Support Models of Vector Machines (Svm) by Increasing Datasets for Forex Business Prediction Using the Kernel Trick Method. From these results it was found that with a period of every 1 minute from May 12, 2016 at 09.51 to May 13, 2016 at 12:30 as many as 1689 datasets produced a fairly large prediction accuracy that reached 97.86% [1].
The method used in this study is CRISP-DM (Cross-Industrial Standard Process Model for Data Mining). This process is an interesting one for finding interesting and interesting patterns in data. As well as involving several scientific disciplines, such as Statistics, Machine Learning, Artificial Intelligence, Pattern Recognition, and Data Mining. One of the advantages of using this process is explaining the most common steps in the process. There are 6 that are displayed on CRISP-DM, which are explained in the image below [5]:
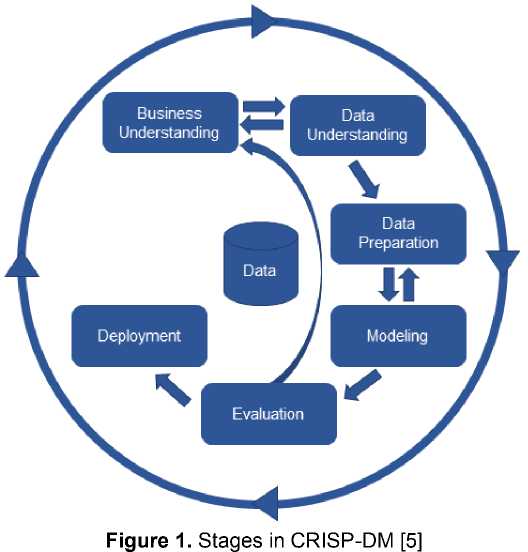
This is the first stage in CRISP-DM and includes a vital part of the research and during the work in the next process. At this stage there needs to be an understanding of goals and needs within the scope of the business or research unit, translating this knowledge into data mining problems [5].
-
2.2. Data Understanding
This stage provides an analytical foundation for a study by summarizing and identifying potential problems in the data. This stage must also be done carefully and not in a hurry like collecting data, if the data comes from more than one database then the data integration process is carried out. Furthermore, understanding data, identifying data quality, checking data and cleaning invalid data or data cleaning processes [5]. Summary or summary of the data can be useful to confirm whether the data is distributed as expected, or reveal unexpected deviations that need to be handled at a later stage, namely Data Preperation.
At this stage, there is a process for collecting data that will be used for the next stage or data selection process. Selecting variables to be analyzed, preparing initial data so that it is ready for modeling or data transformation [5]. This stage clearly requires considerable thought and a high enough effort to ensure the right data for the algorithm used. This stage is also a stage that is often reviewed when finding problems during the construction of the model. So iterates until it finds something that matches the data.
This stage includes the selection and application of various modeling techniques to get the optimal value. There are several different techniques applied to the same data mining problem and there are also modeling techniques that require special data formats [5]. For this reason the selection of the algorithm greatly influences the results of the research conducted.
After having a model, then we must determine whether the model is in accordance with the objectives at an early stage (business understanding) [5].
In this stage the knowledge or information that has been obtained is presented [5]. This stage aims to make what is produced in research easily understood by users and researchers further.
This research case study was conducted at Startup Goprint, which had been established since early April 2019. Startup Goprint itself is a startup engaged in the marketplace where online printing is wrapped in a mobile application. The purpose of this research is to predict whether Goprint users are loyal or not. This is certainly very useful for the Goprint to study user behavior to anticipate users switching to other printing service applications and to ensure the right promotion targets to users.
This study uses user order data obtained from the Goprint API, where the data obtained is data from April 2019 to September 2019. From these data it is found that the number of users is 407, 256 orders and partners 24.
At this stage, the researcher makes a feature selection of the order data obtained. The following is a list of features described in tabular form.
Table 1. Feature Selection Results
|
No |
Fitur Name |
Information |
|
1 |
most_used_feature |
The dominant feature is used by users. The values are Single (Printshop Recommendation) and Pick) or All (Print and Pick) |
|
2 |
most_response_speed |
The dominant partner response speed is obtained by the user. The value is Fast or Slow |
|
3 |
most_printing_speed |
Print speed of partner documents. The value is Fast or Slow |
|
4 |
total_transaction |
Represents the total transactions made by users |
|
5 |
canceled |
Represents total orders that have been canceled by the user. Possible order canceled due to lack of partner performance or features in Goprint |
In the training and testing process at Naïve Bayes, there were 20 data tranining data where this data was obtained based on interviews with Goprint users, and 10 testing data used to obtain accuracy values from the prediction process. The results of the training data and testing data are displayed in the table below, where f is most_used_feature, rv is most_response_speed, pv is most_printing_speed.
Tabel 2. Training Data
|
No |
f |
rv |
pv |
total_transaction |
canceled |
loyality |
|
1 |
All |
Fast |
Fast |
20 |
0 |
1 |
|
2 |
All |
Fast |
Slow |
15 |
1 |
1 |
|
3 |
All |
Slow |
Fast |
5 |
0 |
1 |
|
4 |
All |
Slow |
Slow |
20 |
1 |
1 |
|
5 |
Single |
Fast |
Fast |
30 |
1 |
1 |
|
6 |
Single |
Fast |
Slow |
12 |
2 |
1 |
|
7 |
Single |
Slow |
Fast |
3 |
0 |
1 |
|
8 |
Single |
Slow |
Slow |
6 |
0 |
1 |
|
9 |
All |
Fast |
Fast |
10 |
1 |
1 |
|
10 |
All |
Fast |
Slow |
10 |
8 |
0 |
|
11 |
All |
Slow |
Fast |
8 |
2 |
1 |
|
12 |
All |
Slow |
Slow |
6 |
3 |
0 |
|
13 |
Single |
Fast |
Fast |
7 |
0 |
1 |
|
14 |
Single |
Fast |
Slow |
5 |
3 |
0 |
|
15 |
Single |
Slow |
Fast |
12 |
9 |
0 |
|
16 |
Single |
Fast |
Fast |
30 |
2 |
1 |
|
17 |
Single |
Fast |
Slow |
7 |
4 |
0 |
|
18 |
Single |
Slow |
Fast |
20 |
15 |
0 |
|
19 |
Single |
Slow |
Slow |
10 |
9 |
0 |
|
20 |
All |
Slow |
Fast |
8 |
4 |
0 |
Tabel 3. Data Testing
|
No |
f |
rv |
pv |
total_transaction |
canceled |
|
1 |
Single |
Fast |
Slow |
12 |
0 |
|
2 |
Single |
Slow |
Fast |
17 |
0 |
|
3 |
Single |
Slow |
Slow |
6 |
4 |
|
4 |
All |
Fast |
Fast |
10 |
1 |
|
5 |
All |
Fast |
Slow |
10 |
8 |
|
6 |
All |
Slow |
Fast |
8 |
5 |
|
7 |
All |
Slow |
Slow |
6 |
5 |
|
8 |
Single |
Fast |
Fast |
5 |
0 |
|
9 |
Single |
Fast |
Slow |
13 |
6 |
|
10 |
Single |
Fast |
Fast |
12 |
1 |
At this stage, the method used to predict Goprint users is the Naïve Bayes Classifier. Classification using the Naïve Bayes Classifier is a classification with probabilistic and statistical methods, calculating the probability of a hypothesis, calculating the probability of a class from each group of attributes, and determining which class is the most optimal, known as the Bayes Theorem. The theorem is combined with Naïve where it is assumed that conditions between attributes are mutually independent [6]. Classification uses the Naïve Bayes Classifier based on the Bayes Theorem with Probability (B to A) equal to Probability (A and B) compared to Probability (A) based on equation 4 [7].
-
(1)
( I ) v (X)
Information:
-
a. X is data with an unknown class
-
b. H is a data hypothesis X where X is a specific class
-
c. P (H | X) is the probability of H based on condition X (posteriori probability)
-
d. P (H) is the probability of H (prior probability)
-
e. P (X | H) is the probability of X based on the conditions in the hypothesis H
-
f. P (X) is the probability of X
The classification process requires a number of clues to determine what class is suitable for the sample being analyzed. Therefore, Bayes' Theorem is adjusted to Equation 5 [7].
P(C|F1 ...Fn) - ^^^l.^
(2)
-
v 1 j P (Fl...Fn)
Information:
-
a. C is a class representation
-
b. F1 is a representation of the characteristics of the instructions in doing the classification c. P is an opportunity
Opportunities for the entry of certain characteristic samples in class C (Posterior) are the opportunities for the emergence of class C (before the entry of the sample, called Prior), multiplied by the chance of the appearance of sample characteristics in class C (called Likelihood), divided by the probability of the appearance of sample characteristics globally (called Evidence). Therefore, the previous formula was written into equation 6 [7].
r. ι . Likelihood∗Prior
(3)
=
Evidence
Evidence values are always fixed for each class in one sample. The value of Posterior will be compared with the value of Posterior of other classes, to determine in what class a sample will be classified [7].
To evaluate the method used, the precision value is sought which is the level of accuracy between the information requested by the user and the answer given by the system, recall is the success rate of the system in finding back an information and accuracy, namely the level of closeness between the predicted value and the actual value. The formula to find the value of precision is written in equation 4, recall in equation 5 and accuracy in equation 6 [8].
=
=
TP+FP
TP
TP+FN
=
TP+TN
TP+FP+TN+FN
(4)
(5)
(6)
Information:
-
a. TP is a True Positive or Correct Result
-
b. FP is a False Positive or Unexpected Result
-
c. FN is False Negative or Missing Result
-
d. TN is True Negative or Correct Absense of Result
From the evaluation stage, it was found that the value of precision is 80%, recall 100% and accuracy of 90%. After testing the method used based on the training data used, the subsequent implementation of the method for all transaction data contained in the Goprint is to determine the user's loyalty prediction. From the results of the implementation of the method it is found that the "Loyalty" class is smaller than the "Not Loyalty" class, namely 23 "Loyalty" and 54 "Not Loyalty".
At this stage, the implementation or research results are visualized in the form of a web base to facilitate the Goprint for user management and find out user loyalty predictions. In this case the web base was built using React JS and using the Firebase database, the use of React JS and Firebase is intended so that later it can be integrated directly into the Goprint system itself.
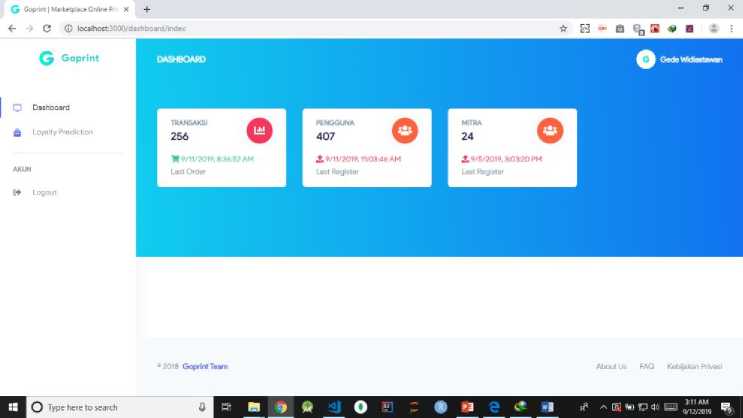
Figure 2. Web Dashboard
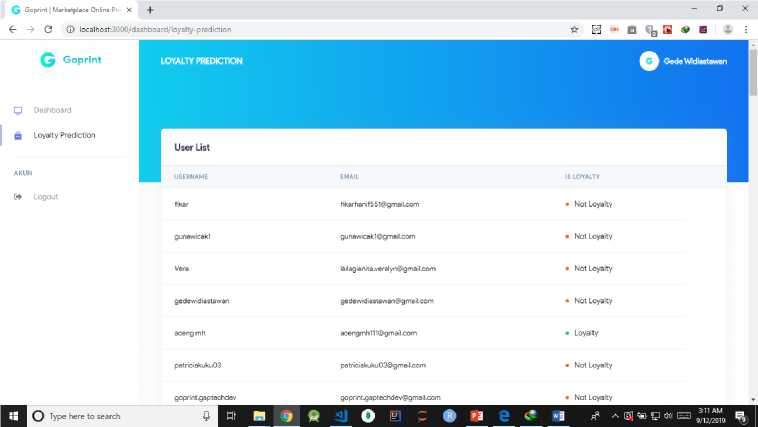
Figure 3. Prediction Results
From the results of the research conducted, it was found that the Naïve Bayes method is very good for the classification process of users, especially on startup Goprint. By using 20 training data and 10 testing data, the evaluation results show that the precision value is 80%, 100% recall and 90% accuracy. The results of this evaluation indicate that the use of the Naïve Bayes method is very appropriate in terms of classifying data with little training data but a high degree of accuracy. After evaluating using data testing, the method is implemented on all existing data. The result of the implementation of all data in web form is that the "Loyalty" class is smaller than the "Not Loyalty" class, which is 23 "Loyalty" and 54 "Not Loyalty", it can be concluded that the problem regarding a small transaction on Goprint can be known because of user loyalty down or less. This decrease in loyalty is caused by, among others, features that are frequently used, speed of response of partners, speed of printing documents with partners, total transactions and total canceled transactions. For this reason the existence of user predictions can easily find out or predict users who are not loyal and know the factors that cause users are not loyal, in addition it can facilitate the Goprint to anticipate user irregularities by conducting appropriate promotions on users.
Suggestions for further research is to select features that will be used using feature selection techniques to get the attributes that most influence the results. In addition it is necessary to compare the amount of training data used, in order to find out the maximum level of accuracy.
References
-
[1] Akhmad Khanif Zyen Adi Sucipto. PENGEMBANGAN MODEL SUPPORT VECTOR MACHINES (SVM) DENGAN MEMPERBANYAK DATASET UNTUK PREDIKSI BISNIS FOREX MENGGUNAKAN METODE KERNEL TRICK. JOURNAL OF INFORMATION TECHNOLOGY, UK, 3 (1), 2017.
-
[2] Muljono, Alvino Dwi Rachman Prabowo. Prediksi Nasabah yang Berpotensi Membuka Simpanan DepositoMenggunakan Naive Bayes Berbasis Particle Swarm Optimization. Techno.COM, 17 (2), 2018.
-
[3] Bahrawi As'ad. Prediksi Keputusan Menggunakan Metode Klasifikasi Naïve Bayes, OneR, dan Decision Tree. Journal of Communication Research and Public Opinion, 20 (1), 2016.
-
[4] INFORMATICALOGI. Naive Bayes algorithm, 2017. Via the link:
https://informatikalogi.com/algoritma-naive-bayes/ accessed 25 August 2019.
-
[5] Tikaridha Hardiani, Selo Sulistyo, Rudy Hartonto. Segmentasi Nasabah Tabungan Menggunakan Model RFM (Recency, Frequency,Monetary) dan K-Means Pada Lembaga Keuangan Mikro. Seminar Nasional Teknologi Informasi dan Komunikasi Terapan (SEMANTIK), 2015.
-
[6] S. Shukla dan S. Naganna, (2014). A review on k-means data clustering approach, Int. Journal of Information & Computation Technology, Vol. 4, No. 17, PP. 1847-1860.
-
[7] Adriyendi. 2015. PREDIKSI CLUSTERING, CALCULATION DAN CLASSIFICATION
FRUIT AND VEGETABLE CONSUMPTION. Jurnal Sainstek IAIN Batusangkar. Vol 7, No 2.
-
[8] Aang Alim Murtopo. 2015. Prediksi Kelulusan Tepat Waktu Mahasiswa STMIK YMI Tegal Menggunakan Algoritma Naïve Bayes. Journal Computer Science Research and Its Development. Vol 7, No 3.
234
Discussion and feedback