Identification of Active Antioxidant Compounds from Ungu Leaf Ethanol Extract (Graptophyllum pictum L. Griff)
on
Journal of Health Sciences and Medicine, Vol. 2 No. 1, February 2018
Identification of Active Antioxidant Compounds from Ungu Leaf Ethanol Extract (Graptophyllum pictum L. Griff)
Ni Luh Rustini1, Ni Komang Ariati2
Departement of Chemistry
Udayana University
Denpasar, Bali rustini.niluh@yahoo.co.id
Departement of Chemistry
Udayana University
Denpasar, Bali komangariati@yahoo.co.id
Abstract
This study was conducted to determine the chemical compounds contained in ungu leaf ethanol extract that has antioxidant properties. Ungu leaf powder (2000 g) was extracted with 10,000 mL of 96% ethanol yielding 51.77 g thick purple-green viscous extract. The result of phytochemical test on ungu leaf ethanol extract showed that the extract contained flavonoid, saponin, phenolic and steroid, with the highest content being steroid. The separation of the ethanol extract was carried out by column chromatography using silica gel as a stationary phase and a mixture of n-hexane: dichloromethane: ethyl acetate (2: 1: 1) as the mobile phase, yielding 10 fraction groups. Fraction F1 is relatively pure, then identified with UV-Vis, IR, and GC-MS spectrophotometers. The results of identification with UV-Vis, IR, and GC-MS spectrophotometers showed that ungu leaf ethanol extract containing antioxidant activity contained stigmasterol compounds, namely: stigmasta-5,22-dien-3-ol and stigmast acid-5-en-3-ol.
Keywords: Ungu leaves, UV-Vis, IR, GC-MS, stigmasterol.
-
I. INTRODUCTION1
Free radicals are a compound produced normally in metabolic processes. The compound contains an unpaired electron in its outermost orbital. Free radicals can be either Reactive Oxigen Species (ROS) or oxygen radicals such as O2. , OH. , ROO. and H2O2 (David, 2000). The chemical compounds are highly unstable and readily react with both organic and inorganic chemicals. Proteins, lipids, carbohydrates and nucleic acids can be damaged by the chemical reactivity of free radicals. Such damage in the long run can lead to various degenerative diseases, such as cancer, heart, atritis, cataracts, diabetes and impaired liver function. The risk of the disease can be reduced by the use of antioxidant compounds capable of capturing free radicals (Halliwell, 2007).
Naturally the body has a defense mechanism against free
radicals. The body's natural defenses or molecules against free radicals are called antioxidants. The antioxidants in the body (endogenous antioxidants) are mostly in the form of enzymes such as superoxide dismutase (SOD) enzymes, glutathione peroxidase (GPx) and catalase (CAT) (Chiang et al., 2006).
The body does not have an excessive antioxidative defense system, so if there is exposure to excess free radicals, the body needs exogenous antioxidants. Concerned about the side effects of synthetic antioxidants, natural antioxidants become an alternative choice (Zhang, 2011). . There are many foods that are a source of natural antioxidants. Most natural sources of antioxidants are herbs. Plants that can produce natural antioxidants one of them is a ungu leaf (Graptophyllum pictum L. Griff). Determination of antioxidant activity of various fractions and extract of ungu leaf ethanol has been done in previous research. Extract of ethanol, ethylacetate and n-butanol of ungu leaves have the ability to reduce free radical DPPH with IC50 value of 83.25 ppm; 271,04 ppm; 385.82 ppm.
ungu leaves chloroform extract did not have the ability to reduce free radical DPPH because it has IC50 value more than 500 ppm that is equal to 1365,73 ppm. The results show that ungu leaf ethanol extract has the highest antioxidant activity (Rustini and Ariati, 2017). Therefore, further research is required to isolate and identify the active compounds of ungu leaf ethanol extract as a potential antioxidant.
-
II. MATERIALS AND METHOD
-
A. Materials
The materials used in this study are ungu leaves obtained from Dalung area, North Kuta, Badung. The chemicals used are ethanol (technical and p.a), chloroform (technical and p.a), ethyl acetate (technical and p.a), n-butanol (technical and p.a), methanol, and dichloromethane.
The equipment used in this research is a set of glassware, blender, sieve, extractor, rotary vacum evaporator, centrifuge, analytical balance, micro pipette, dropper dropper, measuring flask, syringe, UV-vis spectrophotometer, infrared spectrophotometer, and GC-MS.
-
B. Methods
Extraction
One kilogram of dried ungu leaf powder is macerated with ethanol for 24 hours. The extract is filtered, while the dregs are macerated back with ethanol until the compounds contained therein are extracted. The obtained filtrate was evaporated by rotary vacum evaporator to obtain concentrated ethanol extract. The ethanol concentrated extract was further tested phytochemically, separated and purified, then identified with UV-Vis, IR, and GC-MS spectrophotometers.
Phytochemical Test
The class test of flavonoid compounds was performed by adding Wilstater reagents (concentrated HCl solution added 2 Mg pieces). A positive reaction is characterized by a change of color from orange to red or red creamsom and or cream into magenta depending on the type of flavonoid.
The saponin group test was performed by foam test. Slightly isolates dissolved in water, heated, then shake strongly. The incidence of stable foams with the addition of concentrated HCl indicates positive saponins.
The phenolic compound group test was performed by adding a FeCl3 solution. Positive reaction if there is a change of color from green to purple. Group tests of steroid or triterpenoid compounds were performed by adding Lieberman-Burchard reagents (acetic acid anhydride added concentrated H2SO4). If there is a change in green-blue color indicates a positive steroid, and a change in purple red indicates positive triterpenoid.
Separation, Purification, and Identification
Extract ungu leaf ethanol extracts were separated by column chromatography using silica gel60 stationary phase and the n-hexane motion phase: dichloromethane: ethyl acetate (2: 1: 1). Eluat accommodated every 3 mL. Eluats that have the same separation pattern are combined. A single stained fraction is tested for its purity by TLC using several eluent types. The relatively pure fraction of TLC was carried out by analysis using UV-Vis, IR, and GC-MS spectrophotometers.
-
III. RESULT AND DISCUSSION
-
A. Extraction and Phytochemical Test
Extraction of ± 2000 g of ungu leaf powder with 10000 mL of 96% ethanol yielded 51.7724 g ethanol-concentrated extract of purple green. The concentrated ethanol extract was then subjected to phytochemical test. The results of the phytochemical tests are presented in Table 1, which shows that the ungu leaf ethanol extract contains flavonoids, saponins, phenolics, and steroids, with the most content being steroids
TABLE 1
Phytochemical test results of ungu leaf ethanol extract
|
No |
Phytochemical Test |
Reagents |
Color Changes |
Conclution |
|
1 |
Flavonoid |
Wilstater |
Red |
+ |
|
2 |
Saponin |
Hot water |
Foam |
+ |
|
3 |
Fenolik |
FeCl3 |
Purple |
+ |
|
4 |
Triterpenoid/Steroid |
Lieberman-Burchard |
Blue |
++ |
-
B. Results of ungu Leaf Ethanol Extract Separation The ungu leaf ethanol extract was separated by column chromatography, using silica gel 60 stationary phase and the n-hexane motion phase: dichloromethane: ethyl acetate (2: 1: 1), yielded 10 fractions (Table 2)
TABLE 2
Results of ungu leaf ethanol extract separation by column chromatography
|
Fraction (F) Number of spo |
t Harga Rf | |
|
F1 (1-10) |
1 |
0,84 |
|
F2 (11-26) |
2 |
0,78 |
|
0,86 | ||
|
F3 (27-32) |
3 |
0,66 |
|
0,72 | ||
|
0,77 | ||
|
F4 (33-39) |
2 |
0,68 |
|
0,78 | ||
|
F5 (40-53) |
2 |
0,56 |
|
0,67 | ||
|
F6 (54-75) |
2 |
0,4 |
|
0,51 | ||
|
F7 (76-82) |
3 |
0,33 |
|
0,41 | ||
|
0,50 | ||
|
F8 (83-145) |
2 |
0,33 |
|
0,41 | ||
|
F9 (146-179) |
2 |
0,41 |
|
0,46 | ||
|
F10 (180-200) |
0 |
- |
Fraction F1 produces a single and purified stain by TLC, so it follows by identification using a UV-Vis, IR, and GC-MS.
C. Result of Analysis by GC-MS, UV-VIS, and IR
The results of F1 isolate analysis with gas chromatography are shown in Figure 1.

Fig. 1 Chromatogram Gas of Isolat F1
Chromatogram isolate fraction of one (F1) shows the absorption peak with retention time (tR) as follows: peak 1 tR 14,769 min, peak 2 tR 17,137 min, peak 3 tR 19,291 min, peak 4 tR 21,448 min, peak 5 tR 21,559 minutes, peak 6 tR 21,615 minutes, peak 7 tR 21,882 minutes, peak 8 tR 26,297 minutes, peak 9 tR 27,377 minutes, and peak 10 tR 28.707 minutes.
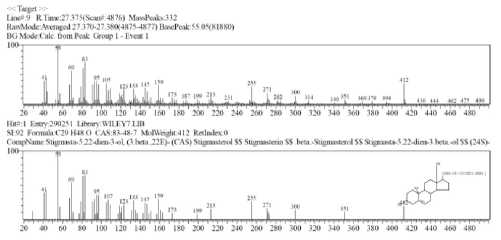
Identify peak 9 tR 27,377 minutes

Fig. 2 Peak 9 of mass spectrum
Based on the data base approach (WILEY7, L.), The probability of the compound at peak 9 is stigmasta-5,22-dien-3-ol with the molecular formula C29H48O and molecular weight 412.
Identify peak 10 tR 28.707 minutes
Based on the data base approach (NISTO8, L.), The possible compound at peak 10 is the stigmast-5-en-3-ol acid with the molecular formula C29H50O and molecular weight 414
I iiIgci »
LuK H∣ RTutK 28.7l0tScan≈ 5143) MassPcaks J 17
RnALxJc Aseiagcd 28 TOMtJlft5142-5144) RswPeak 41 05(14477«
BG Mode i nk from Peak Citoup I - Event 1

IO 50 50 70 SO IIO UO IM 170 190 210 250 250 270 290 510 530 550 370 590 410 450 450 470 490
IhV I lΛry 2913W> Litray «TLEY7 UB
StSJ FaraaihCNH-MO CAS-83-47-6 MolVRuht -Ii 4 Rctlndcxli
CrtnpXame StignsW-?-en-’-oi, («beta 24S)- (CAS) Cliomsierol SS 24S-S HGMAST-5-LV J IiE IA -OL SS Camnia-Sitoslerol SS Fueosterol beta -d⅛yι

IO 50 50 70 90 IIO 150 IM 170 190 210 250 250 270 290 510 550 550 370 390 410 430 450 470 490
Hit=’ Inoy 17185’ IjhraryMSTORUB
SI 93 FonnuhCNHftlO CAS8M7-6 MoIUeight 414 RetIndex 2731
( OrnpX-Bne gumma Srto-Ien-I SS SlφnM-5-eo-3-d. (3 beta 24S> SS Stigmast-'-en-’ beta ail (24SF SS CllOiirWefoI SS FteaMHoL beta -dJlxdfo- SS 2

IO 30 50 70 90 IIO 130 IM 170 190 210 250 250 270 290 310 330 350 370 390 410 430 450 470 490
Fig. 3 Peak 10 of mass spectrum.
Identification of F1 isolate with Infrared Spectrophotometer
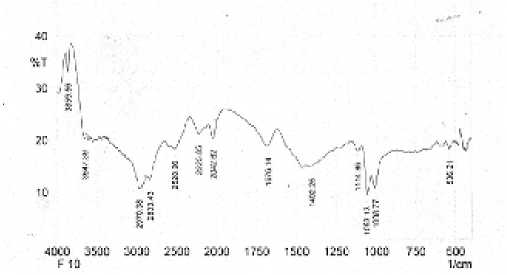
The result of identification of F1 isolate with infrared spectrophotometer is shown in Figure 4, while data of wave number, shape of band, intensity, and related group placement are presented in Table 3.
Table 3.
Infrared spectra of F1 isolate
|
Wave Numbers Spectra (cm-1) |
Wave Numbers Library (cm-1) |
Functional group |
|
3647 |
4000-3200 |
-O-H |
|
2970 |
3000-2850 |
-CH |
|
2833 |
3000-2840 |
-CH |
|
1676,14 |
1680-1620 |
-C=C |
|
1402,25 |
1465-1400 |
-CH |
|
1114,86 |
1300-1000 |
-C-OH |
|
1053,13 |
1300-1000 |
-C-OH |
|
1008,77 |
1300-1000 |
-C-OH |
The widening absorption in the wave number region 3647,39 cm-1 is allegedly the vibration of the OH group which is derived from the alcohol and not from the carboxylic acid. This assumption is reinforced by the absorption of C-O in the region of 1114.86 cm-1, 1053.13 cm-1 and 1008.77 cm-1, and the absence of C = O absorption.
The uptake of the 2970,38 cm-1 and 2833 cm-1 regions is thought to be caused by the resistive vibration of aliphatic C-H, which is amplified by the presence of uptake in 1402.25 cm-1 regions due to the aliphatic C-H bending vibrations out of the non-aromatic rings. The absorption

Fig. 4. Infrared spectrum of F1 isolate.
peak at 1676,14 cm-1 is a vibratory vibration of the unconjugated C = C group (Silverstain, et al., 1981). The results of identification with infrared spectrophotometer showed that the isolates probably contained of O-H, C-H aliphatic, and C-C aliphatic unconjugated, and the functional group was also owned by steroid group steroid compounds. Thus ungu leaf isolates may contain steroid group steroids. It is also supported by GC-MS spectral data, that F1 isolates contain sterol compounds, namely stigmasterol.
[1]
[2]
[3]
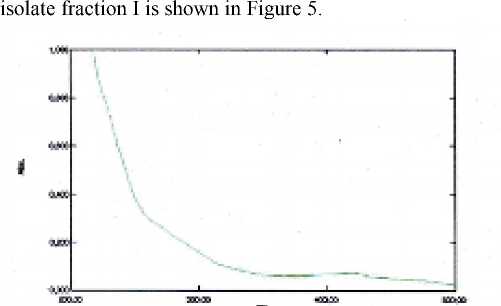
Identification of Isolate with UV-Vis Spectrophotometry The analysis with UV-Vis spectrophotometer from

Figure 5. The result of UV-Vis spectrophotometer isolate fractionI
Isolates of fraction I absorb UV-Vis at a wavelength of 420.06 nm. This absorption is thought to be due to the transition of n to the star sigma by an auxochrome -C -O alcohol. This conjecture is supported by a peak that appears with strong intensity at wave number 1114,86 cm-1 in infrared spectra. The results of IR spectrophotometer, UV-Vis, and GC-MS analyzes suggest that ungu leaf isolate is a steroid group of stigmasterol.
[4]
[5]
[6]
[7]
[8]
[9]
[10]
[11]
[12]
[13]
IV. CONCLUSIONS
The results of spectroscopic analysis using UV-
Vis, FTIR , and GC-MS and supported by phytochemical [14]
screening, show that the compound contained in ungu leaf ethanol extract are stigmasterol, namely: stigmasta-5,22-dien-3-ol and stigmast-5-en-3-ol acid.
[15] V. SUGGESTION
Further research needs to be done to determine the structure of the compounds contained in ungu leaf ethanol extracts that have antioxidant activity using NMR [16]
VII. ACKNOWLEDGMENTS
We would like to thank to the to the Ministry of Research and Technology DIKTI and Chairman of LPPM Udayana University who have provided financial support through Grants Research Products. We also expressed his gratitude to all parties who participated in assisting in the process of completion of this research.
REFERENCES
Cai, Y., Luo, Q., Sun, M., Corke, H. 2004. Atioxidant Activity and Phenolic Compound of 112 Traditional Cinese Medicine Plants Associated with Anticancer. Life Sci, 74: 2157-2184
David, G.B., Erik, E.A., Rohini, S., and Alfins. 2000. Antioxidant Enzyme Expression and ROS Damage in Prostatic Intraephitelial Neoplasia and cancer. Cancer, 89: 124-134
Halliwell, B., Gutterige, J.M.C. 2007. Free Radical in Biology and Medicine, 3rd edition. London: Oxford University Press
Harbone, J.B., 1987, Metode Fitokimia: Penuntun Cara Modern Menganalisis Tumbuhan, Jilid II, ITB, Bandung.
Heyne, K. 1987. Tumbuhan Berguna Indonesia. Jilid 1. Cetakan I. Badan Litbang Kehutanan. Ruygrok & Co. Jakarta..
Montgomery, R. 1993. Biokimia Suatu pendekatan Berorientasi Kasus. Yogyakarta. Gadjah Mada University Press.
Osawa, T., and Namiki, M. 1981. A Novel Type of antioxidant Isolated from Leaf Waxof Eucalyptus Leaves. Agric. Biol.Chem, 45: 735-739
Osawa, T., and Namiki, M. 1981. A Novel Type of antioxidant Isolated from Leaf Waxof Eucalyptus Leaves. Agric. Biol.Chem, 45: 735-739
Purnawati, L. Suryanto, E. dan Yudistital, A. 2012. Aktivitas Antioksidan dari Ekstrak Tongkol Jagung (Zea mays L.). Journal Unsrat. I (2).
Rice-Evans, C. A.; Miller, N. J.; Paganga, G. 1996. Structure Antioxidant Activity Relationships of Flavonoids and Phenolic Acids. Free. Rad. Biol. Med, 20: 933-956
Rustini, N. L. and Ariati, N. K. 2017. Antioxidant Activity of Ungu Leaf Ethanol Extract (Graptophyllum pictum L. Griff. Ckra Kimia. 5. 2: 145-151
Silverstein, R. 2005. Spectrometric Identification of Organic Compounds. New York : Wiley. ISBN 0471134570
Tang, S.Y., Whitemen, M., Peng, Z.F., Jenner, A., Yong, E.L, Halliwell. 2004. Characeization of Antioxidant and Antiglycation Properties and Asolation of Active Ingredient from Traditional Chinese Medicine. Free Radioc Biol Med, 36: 1575-1587
Upston, J.M., Niu, X., Brown, A.J., Mashima, R., Wang, H., Senthilmohan, R., Kettle, A.J., Dean, R.T., and Stocker, R. 2002. Disease Stage-dependent Accumulation of Lipid and Protein Oxidation Products in Human Atherosclerosis. Am J Pathol, 160: 701–710 Williams, G.M., Latropoulus, M.J., Whysner, J. 1999. Safety Assessment of Butylated Hydroxyanisole and Butylated Hydroxyltoluene as Antioxidant Food Additives. Food Chem.Toxicol, 37: 1027-1038
Zhang, L., Ravipati, A.S., Koyyalamudi, S.R., Jeong, S.C., Reddy, N., Smith, P.T., Bartlett, J., Shanmugan, K., Unch, D.G., Wu, M.J. 2011. Antioxidant and Antiinflammatory Activities of Selected Medicinal Plants Containing Phenolic and Flavonoid Compounds. J Agr Food Food Chem, 59: 1261-1267
12
Discussion and feedback