Global and Country-Specific Geopolitical Risks and Exchange Rate Volatility: New Empirical Evidence from Indonesia
on
pISSN : 2301 – 8968
JEKT ♦ 15 [1] : 225-239
eISSN : 2303 – 0186
Global and Country-Specific Geopolitical Risks and Exchange Rate Volatility: New Empirical Evidence from Indonesia
Abdul Khaliq
ABSTRACT
This paper investigates the conditional predictability of geopolitical risks (GPR) on the rupiah-dollar exchange rate volatility, using 447 monthly observations spanning January 1985 to March 2022. The paper utilizes asymmetric GARCH (1,1) combined with various asymmetric GARCH models, including the integrated GARCH (I-GARCH), the exponential GARCH (E-GARCH), and the threshold GARCH (T-GARCH), and the power asymmetric GARCH (A-PARCH). This study finds convincing evidence that GPRI has a consistent effect on exchange rate volatility, either symmetric GARCH models or asymmetric GARCH models. Interestingly, the global geopolitical risks (GPR) heterogeneously affect the exchange rate volatility of Indonesia. These empirical findings imply that the rupiah-dollar exchange rate volatility is more vulnerable to domestic GPRI than global GPR.
Keywords: Geopolitical risk, Exchange rate volatility, Indonesia, GARCH
JEL Classification: C58, F31, G17
INTRODUCTION
Exchange rate volatility is an essential feature for the valuation of options, investment decisions, and hedging options hence the instability of the exchange rate has been a vast discussion topic among academicians, policymakers, and investors in the financial markets (Caporale et al., 2015; Salisu, 2020). Many works of literature
theoretically and empirically discuss the drives of the volatility of the exchange rate (Barunik et al., 2016; Benavides & Capistrán, 2012; Bush & López Noria, 2021; Rapach & Strauss, 2008).
Examining exchange rate dynamics persists puzzling. Debate remains about the sources of exchange rate dynamics and the fundamental drivers of unpredicted information
(uncertainty) about policy or financial, and economic data. Bush & López Noria (2021) emphasize the role of uncertainty on the exchange rate dynamic. Moreover, Bartsch et al. (2019) and Chen et al, (2020) detect the contribution of uncertainty in economic policy (EPU) to exchange rate volatility either contemporaneously or with a lag. Previously, Pástor & Veronesi (2013) contributed to uncertainty empirics and theorized a model of asset volatility response to political news. They show that empirical evidence of political uncertainty in asset volatility is consistent with predictions.
Among ongoing research topics of uncertainty in the exchange rate literature is geopolitical risks (GPR) on exchange rate volatility. Caldara & Iacoviello (2022b) argues that central bankers, commercial investors, and financial consultants consider GPR one of the critical factors in investor decisions to invest in exchange rate derivatives or predict future exchange rates. Geopolitical risks are likely to
affect the exchange rate volatility (Balcilar et al., 2018; Salisu, 2020).
Based on a theoretical perspective, GPR could influence the exchange rate volatility in some ways, such as financial markets or portfolio flows (Al Mamun et al., 2020; Aysan et al., 2019; Chiang, 2021; Hoque et al., 2021; Su et al., 2020) and international trade flows (Balcilar et al., 2018; Ding et al., 2021). Meanwhile, from empirical findings, the effect of GPR on the exchange rate volatility is examined through relevant methodologies, such as the time-varying parameter vector autoregressive-the TVP-VAR model (Ding et al., 2021), GARCH-MIDAS-X (Salisu, 2020), and nonparametric causality-in-quantiles tests (Balcilar et al., 2018). However, the impact of GPR on the exchange rate volatility is still debatable among academicians.
To the extent of my knowledge, relatively few inquiries have been recorded that examine the effect of GPR on rupiah-dollar exchange rate volatility. Hence this study can fill this research gap. In the most recent papers,
Hui (2020, 2021a, 2021b) studies the effect of GPR on exchange rates in Indonesia, Korea, and ASEAN countries. Using the autoregressive distributed lag (ARDL) approach to cointegration, Hui (2020) found that GPR has a significant role in the short-run and long-run of the rupiah-dollar exchange rate over the former period January 1998 to July 2019. This study has limitations since ARDL is unable to capture the autoregressive conditional heteroscedasticity (ARCH) effect in a more significant number of long-run financial data series. Such severe errors can produce misleading inferences. Therefore, using an appropriate model with proper assumptions leads to better conclusions for the empirical findings on the exchange rate volatility of Indonesia.
This paper aims to develop the exchange rate volatility literature by examining 1) whether a link between GPR and rupiah-dollar exchange rate volatility and 2) whether global GPR and domestic GPR have different detectible effects on exchange rate
volatility. Our strategy is to implement the symmetric GARCH and asymmetric GARCH models. The GARCH family models are well known as prominent tools to capture the changes in exchange rate volatility. The decision to examine the GPR and the rupiah-dollar exchange rate volatility is due to, over the period January 1985 to September 2021, 1) the fact that geopolitical situations are quite challenging, such as in particular various changing governmental institutions, terror attacks, etc., 2) the exchange rate regime is also altering from managed float regime to floating exchange rate, 3) a variety of financial market tensions (bull, normal, and bear), and 4) Indonesia has experienced COVID-19 since March 2020.
The main findings show that in general GPR is sought to have a consistent effect on exchange rate volatility, either symmetric GARCH models or asymmetric GARCH models. Global- and domestic-GPR has contributed to a destructive impact on the volatility of the rupiah-dollar exchange rate. Interestingly, the global
and country-specific geopolitical risk heterogeneously affects the exchange rate volatility of Indonesia. These empirical findings imply that the rupiah-dollar exchange rate volatility is more vulnerable to domestic GPR than global GPR.
The layout of this paper is ordered as follows. Section 2 communicates data and proposed research methods using symmetric along with asymmetric GARCH models. Section 3 discusses the empirical findings. Section 4 involves robustness tests. The final section completes the paper.
RESEARCH METHODS
Data
This research utilizes monthly information data on geopolitical risks (Caldara & Iacoviello, 2022a), gold price (The World Gold Council, 2022), and rupiah-dollar exchange rate (Bank Indonesia, 2022). The data have 447 observations covering January 1985 to March 2022. Since the nominal rupiahdollar exchange rate series is nonstationary, it is misleading for
analysis. Hence, this study converts the rupiah against the dollar exchange rate series into the rate return on the exchange rate as bellows
rt = In (-^rr-∖ or rt = ln(ert) — ln(er∣^) ∖ert-1∕
(1)
where: rt stands for exchange rate return at period t, ert and ert-1 stand for the nominal rupiah-dollar exchange rate at period t and t — 1.
Estimation Techniques
This study essentially investigates the effect of geopolitical risks on exchange rate volatility in both symmetric and asymmetric GARCH models. The symmetric GARCH model reflects the exchange rate volatility by the magnitude of the financial return series, meanwhile, the asymmetric GARCH model indicates the exchange rate volatility by both the magnitude and the positive or negative sign of the financial return series (Ma, Du, & Lai, 2014).
In formulating the GPR and the exchange rate volatility, this paper proposes the following specification:
σt — a + β qG P Rt + βιG P RIt + λX t + v t
(2)
where σt indicates the standard deviation of monthly returns for the rupiah-dollar exchange rate at period t. GPRt stands for global geopolitical risks at period t. GPRIt refers to Indonesian geopolitical risks at period t. Moreover, Xt is a set of monthly control variables.
The symmetric ARCH/GARCH Model
This study begins with the
autoregressive conditional
heteroskedastic (ARCH) model
pioneered by Engle (1982). The ARCH
(1) model is as follows:
^t — Vt√ht, Vt ~ Hd(0,1) (3)
Bollerslev (1986) modifies the ARCH model by introducing moving average (MA) ARCH terms, called GARCH model. The symmetric GARCH (1,1) model is formulated by
ht = η + aε2-1 + βht-1 (4)
where η > 0, a ≥ 0, β ≥ 0, and a + β < 1. The GARCH model involves one ARCH term indicated by of 1 and one
GARCH term signified by ht-1. The
GARCH (1,1) model shows that the shock in εt > 0 or εt < 0 has no differential effect. Since the GARCH model reflects the shocks deterioration at a fast exponential rate, it converts misplaced when expressing long memory events (Bentes, 2015) and neglects to enlighten the leverage effect of exchange rate volatility (Murari, 2015).
The asymmetric GARCH model
To manage the weaknesses of the symmetric GARCH model, some academicians developed asymmetric GARCH models, such as IGARCH (Engle & Bollerslev, 1986), EGARCH (Nelson, 1991), TGARCH (Glosten et al., 1993), and APARCH (Murari, 2015; Tse, 1998).
Engle & Bollerslev (1986) proposed Integrated GARCH (IGARCH) model. The IGARCH (1,1) model is specified by ht = η + aεf-ι + (1 — a)ht-ι (5)
where {a + (1 — a)} — 1 and 0 < a < 1.
The IGARCH model was criticized by Baillie et al., (1996) because of inapplicable in the real world for
infinite memory and has tendencies to being misspecified. To capture the asymmetric response of positive and negative shock effect volatility inversely, Nelson (1991) developed the exponential GARCH (EGARCH) model. The construction of EGARCH (1,1) model as follows
Inht = η +a |^=| + γ (j=) + βlnht-1
(6)
where γ is the leverage effect of the
asymmetry parameter. a is the magnitude of shock. β captures the persistency. In the EGARCH model, there is no need for restricted
nonnegativity.
Following EGARCH model, Zakoian (1994) and Glosten et al., (1993) advised the Threshold GARCH (TGARCH) model. The TGARCH model tolerates the positive and negative shocks differently on volatility. The TGARCH (1,1) model as bellows
ht = η + aεt-1 + γdt-1aε2-1 +
1>ifεt-1<0
βht-1, dt-1 {0, ^ εt-1 ≥ o (7)
where the parameters a, β, and γ are non-negative restrictions. In the TGARCH (1,1) model, εt-1 < 0 (bad news) and εt-1 > 0 (good news) deliver variance effect on volatility. Positive shocks (good news) have a effect on volatility and negative shocks (bad news) have (a + γ) effect on volatility. The γ is well-known as the leverage effect.
The other authors (see Murari, 2015; Tse, 1998) initiated the asymmetric power GARCH (APARCH). The APARCH (1,1) is represented by
h? = η + a(lεt-1l - γεt-1)δ + βht-1
(8)
where η > 0, a ≥ 0, β ≥ 0, and ∣γ∣ < 1. The δ signifies the power parameter that entails the condition δ > 0 and the γ confines the asymmetric effect or leverage effect. A positive (negative) γ triggers higher volatility than negative (positive) shocks.
RESULTS AND DISCUSSION
Table 1 clearly exhibits the summary statistics for the monthly rupiah dollar exchange rate. Despite the
inclusion of the Asian financial crisis (AFC) in 1997/1998, the global financial crisis (GFC) in 2007/2008, and the Covid-19 in 2020/2021 crisis periods in the sample, the rupiah dollar exchange rate returns have undergone positive mean. The mean and median of the nominal rupiah dollar exchange rate are 7716.78 and 9015, respectively. Meanwhile, the mean and median of the
difference in logarithmic rupiah dollar exchange rate are 0.00578 and 0.0030, separately. Moreover, the skewness and kurtosis are 4.482 and 28.272, correspondingly. Since kurtosis of the difference in logarithmic rupiah dollar exchange rate is greater than 3, the rupiah dollar exchange rate in the sample data is noted as abnormally distributed
Table 1 Descriptive statistics
|
Monthly rupiah per dollar |
Δ(ln(Monthly rupiah per dollar) | |
|
Mean |
7716.776 |
.0057955 |
|
Median |
9015 |
.0029566 |
|
Maximum |
16367 |
.8025322 |
|
Minimum |
1082 |
-.3486958 |
|
Std. Dev. |
4638.882 |
.0624473 |
|
Skewness |
-.1355643 |
5.310592 |
|
Kurtosis |
1.617251 |
70.22745 |
|
Observations |
447 |
446 |
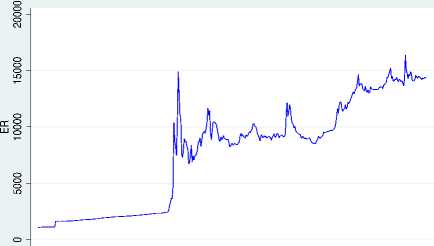
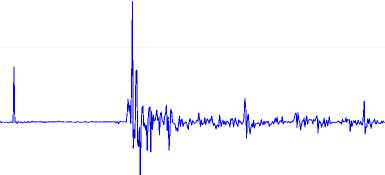
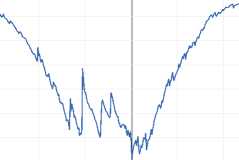
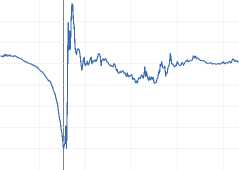
Figure 1 represents the log difference of rupiah dollar exchange rate, there gives the impression to be marginal tendencies of rupiah-dollar exchange rate volatility. The spotlight
on the rupiah dollar exchange rate is inconclusive. Econometric analysis is required to further verify the causes of the volatility of the rupiah dollar exchange rate data.
1985m1 1990m1 1995m1 2000m 1 2005m 1 201 Om 1 2015m1 2020m 1 month
Figure 1 Rupiah per dollar and log difference of rupiah per dollar
1985m1 1990m1 1995m1 2000m 1 2005m 1 201 Om 1 2015m1 2020m 1 month
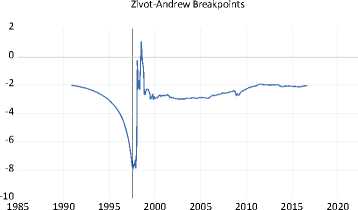
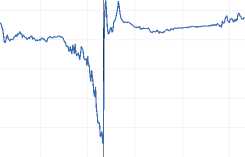
Table 2 presents the Augmented Dickey-Fuller (ADF), Phillips-Perron (PP), and Zivot-Andrews (ZA) unit root test. Results from ADF fail to refuse the null hypothesis of a unit root at a 5 percent significance level, inferring that all variables are non-stationary at the level. Then findings from PP neglect to reject the null hypothesis of a unit root for exchange rate, but accept for GPR
and GPRI at a 5 percent significance level. Moreover, the results from ZA contain a unit root accepting for one endogenously defined structural break by choosing optimal lag through a t-test. The ZA tests in Table 2 and Figure 2 identify the breakpoint of the exchange rate at 1997m08, GPR at 2001m09, GPRI at 2005m02, and gold price at 1997m08.
Table 2 Augmented Dickey-Fuller, Phillips-Perron, and Zivot-Andrews Unit Root Tests
|
lnER lnGPR lnGPRI lnGold |
Augmented Dickey-Fuller (ADF) with trend and intercept
|
Level First differenced |
-1.875696 -5.023188 -2.157524 -3.057617 -6.005458*** -13.71274*** -9.469755*** -15.12200*** Philip-Peron with trend and intercept |
|
Level First differenced |
-2.012289 -7.276805*** -14.33071*** -2.864379 -19.01133*** -31.70752*** -100.2665*** -16.60158*** Zivot-Andrews (ZA) Allowing for One Break |
|
Lag included Minimum statistics Break year |
4 2 4 2 t- -7.967845*** -6.627277*** -8.360450*** -5.011411*** 1997m08 2001m09 2005m02 1997m08 |
lnER
-4.4
lnGPR
Zivot-Andrew Breakpoints
-4.8
-5.2
-5.6
-6.0
-6.4
-6.8
1985
1990 1995 2000 2005 2010 2015 2020
-5.6
lnGPRI
Zivot-Andrew Breakpoints
-6.0
-6.4
-6.8
-7.2
-7.6
-8.0
-8.4
1985
1990 1995 2000 2005 2010 2015 2020
Figure 2 Zivot-Andrews Unit Root Test Allowing for One Break
lnGold
Zivot-Andrew Breakpoints
-1.5
-2.0
-2.5
-3.0
-3.5
-4.0
-4.5
-5.0
-5.5
1985
1990 1995 2000 2005 2010 2015 2020
In attempting to answer the question of the projecting capability of global geopolitical risks (GPR) and Indonesia-specific geopolitical risks (GPRI) for rupiah dollar exchange rate volatility, we present the symmetric and asymmetric GARCH models in Table 3. In general, we estimate GARCH, GARCH-M, APARCH, EGARCH, TGARCH, and IGARCH using quasimaximum likelihood estimation with Gaussian normal error distribution. The model parameters include the
unconditional mean for the return of the rupiah dollar exchange rate (η); the ARCH coefficient (α); the GARCH coefficient (β) the leverage effect (y); the power effect (5); and the long-run constant term (c). The sum of the ARCH coefficient and GARCH coefficient (α + β) is more than unity in all cases, which is a symptom of the impact of global geopolitical risks (GPR) and Indonesia-specific geopolitical risks (GPRI) on rupiah dollar exchange rate volatility would be permanent. This is consistent
across GARCH models employed. Moreover, these results indicate a high degree of persistence of global geopolitical risks (GPR) and Indonesia-
specific geopolitical risks (GPRI) in the models which is equivalent to a high degree of rupiah dollar exchange rate volatility.
Table 3 Estimated results of Model
|
Variables |
Symmetric Measurement |
Asymmetric Measurement | ||||
|
GARCH(1,1) |
GARCH-M(1,1) |
APARCH(1,1) |
EGARCH(1,1) |
TGARCH(1,1) |
IGARCH(1,1) | |
|
C |
0.006832*** |
0.003695*** |
0.006146*** |
0.004021*** |
0.003016*** |
0.000203 |
|
(0.000556) |
(0.000590) |
(0.000504) |
(0.001279) |
(0.000668) |
(0.000346) | |
|
∆GPR |
-0.007962*** |
0.006187*** |
-0.008650*** |
0.000986 |
0.006062*** |
0.002251 |
|
(0.002666) |
(0.001932) |
(0.001764) |
(0.002990) |
(0.001836) |
(0.001423) | |
|
∆GPRI |
0.039550*** |
0.012914 |
0.037998*** |
0.016771 |
0.004848 |
0.022699 |
|
(0.015163) |
(0.015254) |
(0.012987) |
(0.020130) |
(0.015561) |
(0.015113) | |
|
∆Gold |
0.194780*** |
0.206116*** |
0.168426*** |
0.261953*** |
0.181107*** |
0.485643*** |
|
(0.012555) |
(0.012268) |
(0.012492) |
(0.015738) |
(0.011841) |
(0.005279) | |
|
Regime |
-0.009578*** |
-0.006738*** |
-0.009904*** |
-0.008834*** |
-0.007069*** |
-0.006907*** |
|
(0.001035) |
(0.000960) |
(0.000852) |
(0.001805) |
(0.000856) |
0.000947 | |
|
R |
2.09E-05** |
1.93E-05*** |
0.000179 |
-1.810679*** |
1.94E-05*** | |
|
(8.58E-06) |
(5.28E-06) |
(0.000200) |
(0.087846) |
(4.80E-06) | ||
|
a |
2.054521*** |
2.536208*** |
1.598838*** |
1.241797*** |
1.980186*** |
0.278442*** |
|
(0.217940) |
(0.289613) |
(0.327835) |
(0.070020) |
(0.236572) |
(0.015836) | |
|
β |
0.272866*** |
0.214588*** |
0.323316*** |
0.856969*** |
0.187887*** |
0.721558*** |
|
(0.022828) |
(0.021282) |
(0.055174) |
(0.010737) |
(0.021637) |
(0.015836) | |
|
Y |
0.190976*** |
-0.180667*** |
2.147052*** | |||
|
(0.044955) |
(0.058042) |
(0.607012) | ||||
|
S |
1.398671*** | |||||
|
(0.275209) | ||||||
|
a + β |
2.327387 |
2.750796 |
1.922154 |
2.098766 |
2.168073 |
1.000000 |
|
Log likelihood |
997.1273 |
997.8608 |
1003.109 |
977.6852 |
1005.110 |
883.3321 |
|
AIC |
-4.435548 |
-4.434353 |
-4.453405 |
-4.343880 |
-4.466860 |
-3.934225 |
|
SIC |
-4.362000 |
-4.351611 |
-4.361469 |
-4.261138 |
-4.384118 |
-3.879063 |
|
Test Diagnostics | ||||||
|
ARCH - LM Test |
0.038664 |
0.035265 |
0.003037 |
0.010085 |
0.015647 |
2.517490 |
|
(0.8442) |
(0.8511) |
(0.9561) |
(0.9201) |
(0.9005) |
(0.1133) | |
|
Wald Test |
4219.423 |
2979.713 |
3875.897 |
28582.59 |
2330.161 |
6434.692 |
|
(0.0000) |
(0.0000) |
(0.0000) |
(0.0000) |
(0.0000) | ||
Note: ***, **, * is statistical significant at the 1%, 5%, and 10%, correspondingly. The standard errors are in parentheses. Then, the numbers in parentheses under the ARCH LM test and Wald test are p-value.
Moreover, specifically, Table 3 presents the ARCH and GARCH coefficients a and β for the sixth different GARCH models. The GARCH shows the highest coefficient a and the
EGARCH presents the highest coefficient β. The sum of the two coefficients is higher than 1 for all GARCH family models. This reveals a higher degree of continuity from
exogenous shocks in the sixth GARCH model which corresponds to a higher degree of rupiah-dollar exchange rate volatility. Since these coefficients are bigger than 1, a Wald test is adopted to seek if the sum is unity is necessary. The Wald test rejects the hypothesis for all cases at 1% significant level which confirms that all GARCH models are correctly specified and none of the conditional heteroscedasticity in the models is integrated.
The impact of global geopolitical risks (GPR) and Indonesia-specific geopolitical risks (GPRI) on exchange rate volatility is defined by the statistical significance of the slope coefficients of GPR and GPRI, respectively. The slope coefficients of Indonesia-specific geopolitical risks (GPRI) are found to be positive and consistent for both symmetric and asymmetric GARCH models but not all statistically significant. However, the global geopolitical risks (GPR) heterogeneously affect the exchange rate volatility of Indonesia based on the GARCH models adopted. Interestingly,
the slope coefficients of global geopolitical risks (GPR) are found to be positive for all across GARCH models except for GARCH(1,1) and APARCH(1,1) which showed significantly negative coefficients. These findings support Hui (2020) who studied the global geopolitical risks effect to exchange rate volatility in Indonesia using the autoregressive distributed lag (ARDL) approach. Hui (2020) states that rupiah assets move away from US dollar assets as higher geopolitical risks happen. Additionally, empirical results validate that gold can perform as a safe haven to hedge the rupiah-dollar exchange rate volatility. This paper also shows the negative correlation between the exchange rate regime and exchange rate volatility.
ROBUSTNESS CHECK
It is critical to note that the findings discussed so far may tend to be inconsistent. In order to investigate whether the results are consistent or not, we do a robustness test. Our approach employs the global historical geopolitical risk (GPRH) and Indonesia-
specific historical geopolitical risk
checking results are presented in Table
(GPRHI). By doing so, the robustness 4.
Table 4 Robustness Check
|
Variables |
Symmetric Measurement |
Asymmetric Measurement | ||||
|
GARCH(1,1) |
GARCH-M(1,1) |
APARCH(1,1) |
EGARCH(1,1) |
TGARCH(1,1) |
IGARCH(1,1) | |
|
C |
0.004140*** |
0.004127*** |
0.005448*** |
0.004037*** |
0.003418*** |
0.000854* |
|
(0.000587) |
(0.000601) |
(0.000535) |
(0.001211) |
(0.000669) |
(0.000404) | |
|
∆GPR |
0.007426*** |
0.007367*** |
-0.009864*** |
0.004667** |
0.006608*** |
0.005756*** |
|
(0.001479) |
(0.001506) |
(0.001670) |
(0.002241) |
(0.001429) |
(0.001385) | |
|
∆GPRl |
-0.002983*** |
-0.003216 |
0.004230 |
-0.001095 |
-0.000875 |
-0.007519 |
|
(0.004755) |
(0.004767) |
(0.006076) |
(0.007089) |
(0.004585) |
(0.006246) | |
|
∆Gold |
0.200881*** |
0.203022*** |
0.151702*** |
0.258451*** |
0.177689*** |
0.487364*** |
|
(0.012819) |
(0.012895) |
(0.011649) |
(0.014904) |
(0.013133) |
(0.006147) | |
|
Regime |
-0.007084*** |
-0.007113*** |
-0.009680*** |
-0.009145*** |
-0.007180*** |
-0.007547*** |
|
(0.000955) |
(0.000972) |
(0.000846) |
(0.001756) |
(0.000851) |
(0.001017) | |
|
R |
1.50E-05*** |
1.54E-05*** |
1.45E-05 |
-1.786346*** |
1.54E-05*** | |
|
(4.73E-06) |
(4.80E-06) |
(3.17E-05) |
(0.094459) |
(4.40E-06) | ||
|
a |
2.591077*** |
2.575873*** |
2.712163*** |
1.288289*** |
2.048930*** |
0.269952*** |
|
(0.284275) |
(0.284970) |
(0.863561) |
(0.075538) |
(0.236867) |
(0.015221) | |
|
β |
0.215624*** |
0.215146*** |
0.216554*** |
0.864697*** |
0.191141*** |
0.730048*** |
|
(0.021677) |
(0.021688) |
(0.064190) |
(0.012283) |
(0.022501) |
(0.015221) | |
|
Y |
0.236630*** |
-0.199922*** |
2.027786*** | |||
|
(0.040656) |
(0.059960) |
(0.585970) | ||||
|
S |
1.955916*** | |||||
|
(0.479400) | ||||||
|
a + β |
2.806701 |
2.791019 |
2.928717 |
2.152986 |
2.240071 |
1.000000 |
|
Log likelihood |
1003.970 |
1001.713 |
1003.697 |
979.3547 |
1008.710 |
883.8153 |
|
AlC |
-4.466232 |
-4.451628 |
-4.456041 |
-4.351366 |
-4.483002 |
-3.936392 |
|
SlC |
-4.392683 |
-4.368886 |
-4.364105 |
-4.268624 |
-4.400260 |
-3.881230 |
|
Test Diagnostics | ||||||
|
ARCH - LM Test |
0.046197 |
0.044916 |
0.022763 |
0.011232 |
0.035480 |
2.630732 |
|
(0.8299) |
(0.8323) |
(0.8801) |
(0.9156) |
(0.8507) |
(0.1055) | |
|
Wald Test |
3580.673 |
3125.692 |
2311.434 |
22580.83 |
2453.836 |
6576.716 |
|
(0.0000) |
(0.0000) |
(0.0000) |
(0.0000) |
(0.0000) |
(0.0000) | |
Note: ***, **, * is statistical significant at the 1%, 5%, and 10%, correspondingly. The standard errors are in parentheses. Then, the numbers in parentheses under the ARCH LM test and Wald test are p-value.
CONCLUSION
Using symmetric GARCH and various asymmetric GARCH models, this study examines the vulnerability of rupiah-dollar exchange rate volatility to global geopolitical risks (GPR) and
Indonesia-specific geopolitical risks (GPRI) with a timeframe data ranging from January 1985 to March 2022. Remarkably, the global and countryspecific geopolitical risk heterogeneously affects the exchange
rate volatility of Indonesia. These empirical findings imply that the rupiah-dollar exchange rate volatility is more vulnerable to domestic GPR than global GPR. Moreover, empirical results verify that gold can perform as a safe haven to hedge the rupiah-dollar exchange rate volatility. Finally, this paper shows the negative correlation between the exchange rate regime and exchange rate volatility.
REFERENCES
Al Mamun, M., Uddin, G. S., Suleman, M. T., & Kang, S. H. (2020).
Geopolitical risk, uncertainty and Bitcoin investment. Physica A: Statistical Mechanics and Its Applications, 540, 123107.
https://doi.org/10.1016/j.physa.20 19.123107
Aysan, A. F., Demir, E., Gozgor, G., & Lau, C. K. M. (2019). Effects of the geopolitical risks on Bitcoin returns and volatility. Research in International Business and Finance, 47, 511–518.
https://doi.org/10.1016/j.ribaf.201 8.09.011
Baillie, R. T., Bollerslev, T., & Mikkelsen, H. O. (1996). Fractionally integrated generalized autoregressive
conditional heteroskedasticity.
Journal of Econometrics, 74(1), 3–30. https://doi.org/10.1016/S0304-4076(95)01749-6
Balcilar, M., Bonato, M., Demirer, R., &
Gupta, R. (2018). Geopolitical risks and stock market dynamics of the BRICS. Economic Systems, 42(2),
295–306.
https://doi.org/10.1016/j.ecosys.20 17.05.008
Bank Indonesia. (2022). Statistik Ekonomi Keuangan Indonesia.
Retrieved April 1, 2022, from
https://www.bi.go.id/id/default.a spx
Bartsch, Z. (2019). Economic policy uncertainty and dollar-pound exchange rate return volatility. Journal of International Money and Finance, 98, 102067.
https://doi.org/10.1016/j.jimonfin. 2019.102067
Barunik, J., Krehlik, T., & Vacha, L.
(2016). Modeling and forecasting exchange rate volatility in timefrequency domain. European Journal of Operational Research, 251(1), 329– 340.
https://doi.org/10.1016/j.ejor.2015 .12.010
Benavides, G., & Capistrán, C. (2012). Forecasting exchange rate volatility: The superior performance of conditional combinations of time series and option implied forecasts. Journal of Empirical Finance, 19(5), 627–639.
https://doi.org/10.1016/j.jempfin. 2012.07.001
Bentes, S. R. (2015). Forecasting volatility in gold returns under the GARCH, IGARCH and FIGARCH frameworks: New evidence. Physica A: Statistical Mechanics and Its
Applications, 438, 355–364.
https://doi.org/10.1016/j.physa.20 15.07.011
Bollerslev, T. (1986). Generalized autoregressive conditional
heteroskedasticity. Journal of Econometrics, 31(3), 307–327.
https://doi.org/10.1016/0304-4076(86)90063-1
Bush, G., & López Noria, G. (2021).
Uncertainty and exchange rate volatility: Evidence from Mexico. International Review of Economics and Finance, 75(March), 704–722.
https://doi.org/10.1016/j.iref.2021. 04.029
Caldara, D., & Iacoviello, M. (2022a). Geopolitical Risk Index. Retrieved April 1, 2022, from
https://www.policyuncertainty.co m/gpr.html
Caldara, D., & Iacoviello, M. (2022b). Measuring Geopolitical Risk. In American Economic Review (Vol. 212).
https://doi.org/10.1257/aer.20191 823
Caporale, G. M., Menla Ali, F., &
Spagnolo, N. (2015). Exchange rate uncertainty and international portfolio flows: A multivariate GARCH-in-mean approach. Journal of International Money and Finance, 54, 70–92.
https://doi.org/10.1016/j.jimonfin. 2015.02.020
Chen, L., Du, Z., & Hu, Z. (2020). Impact of economic policy uncertainty on exchange rate volatility of China. Finance Research Letters, 32(109), 1–5. https://doi.org/10.1016/j.frl.2019.0 8.014
Chiang, T. C. (2021). Geopolitical risk, economic policy uncertainty and asset returns in Chinese financial markets. China Finance Review
International, 11(4), 474–501.
https://doi.org/10.1108/CFRI-08-2020-0115
Ding, Q., Huang, J., & Zhang, H. (2021). The time-varying effects of financial and geopolitical uncertainties on commodity market dynamics: A TVP-SVAR-SV analysis. Resources Policy, 72(January), 102079.
https://doi.org/10.1016/j.resourpo l.2021.102079
Engle, R. F. (1982). Autoregressive Conditional Heteroscedasticity with Estimates of the Variance of United Kingdom Inflation. Econometrica,
https://doi.org/10.2307/1912773
Engle, R. F., & Bollerslev, T. (1986).
Modelling the persistence of conditional variances. Econometric Reviews, 5(1),1–50.
https://doi.org/10.1080/074749386 08800095
Glosten, L. R., Jagannathan, R.,&
Runkle, D. E. (1993). On the Relation between the Expected Value and the Volatility of the Nominal Excess Return on Stocks. The Journal of Finance, 48(5), 1779– 1801.
https://doi.org/10.1111/j.1540-6261.1993.tb05128.x
Hoque, M. E., Zaidi, M. A. S., & Hassan, M. K. (2021). Geopolitical uncertainties and malaysian stock market returns: Do market
conditions matter? Mathematics,
9(19), 1–16.
https://doi.org/10.3390/math9192 393
Hui, H. C. (2020). Does Geopolitical Risk Affect Exchange Rates? The Case of Indonesia. SSRN Electronic Journal.
https://doi.org/10.2139/ssrn.36359 59
Hui, H. C. (2021a). Impact of Geopolitical Risk on Foreign Exchange Markets: Indonesia and South Korea Compared. The Empirical Economics Letters, 20(1).
Hui, H. C. (2021b). The long-run effects of geopolitical risk on foreign exchange markets: evidence from some ASEAN countries.
International Journal of Emerging Markets.
https://doi.org/10.1108/IJOEM-08-2020-1001
Ma, M., Du, J., & Lai, K. K. (2014). Modeling volatility of exchange rate of Chinese Yuan against US Dollar based on GARCH models. Proceedings - 2013 6th International Conference on Business Intelligence and Financial Engineering, BIFE 2013, (71473155), 295–299.
https://doi.org/10.1109/BIFE.2013. 63
Murari, K. (2015). Exchange Rate
Volatility Estimation Using
GARCH Models, with Special
Reference to Indian Rupee Against World Currencies. IUP Journal of Applied Finance, 21(1), 22–37.
Nelson, D. . (1991). Conditional
Heteroskedasticity in Asset returns: A New Approach. Econometrica, 59(2), 347–370.
https://doi.org/0.2307/2938260
Pástor, Ľ., & Veronesi, P. (2013). Political uncertainty and risk premia. Journal
of Financial Economics, 110(3), 520– 545.
https://doi.org/10.1016/j.jfineco.2 013.08.007
Rapach, D. E., & Strauss, J. K. (2008). Structural breaks and GARCH models of exchange rate volatility. Journal of Applied Econometrics, 23(1), 65–90.
https://doi.org/10.1002/jae.976
Salisu, A. A. (2020). Geopolitical Risks and Historical Exchange Rate Volatility of the BRICS. (November).
Su, C. W., Qin, M., Tao, R., Shao, X. F., Albu, L. L., & Umar, M. (2020). Can Bitcoin hedge the risks of geopolitical events? Technological Forecasting and Social Change, 159(February), 120182.
https://doi.org/10.1016/j.techfore. 2020.120182
The World Gold Council. (2022). Gold Price. Retrieved April 1, 2022, from https://www.gold.org/
Tse, Y. K. (1998). The Conditional Heteroscedasticity of the YenDollar Exchange Rates. Journal of Applied Econometrics, 13(1), 49–55.
https://doi.org/10.1002/(SICI)1099 -1255(199801/02)13:1<49::AID-JAE459>3.0.CO;2-O
Zakoian, J. M. (1994). Threshold
heteroskedastic models. Journal of Economic Dynamics and Control,
18(5), 931–955.
https://doi.org/10.1016/0165-1889(94)90039-6
239
Discussion and feedback