Analysis Evaluation Management Information System Audit Internal Quality
on
Journal of Electrical, Electronics and Informatics, Vol. 5 No. 1
5
Analysis Evaluation Management Information System Audit Internal Quality
Dewa Ayu Putri Wulandari1, and Made Dona Wahyu Aristana2
-
1,2 Informatics Departement, STMIK STIKOM Indonesia Denpasar – BALI, Indonesia
putri.wulandari@stiki-indonesia.ac.id.
Abstract- Information systems are very important in this globalization era. Information systems generally can be used as a reference for decision making or to monitor the progress of an activity process. In high education, information systems are no less important than information systems within the company. Higher education is an institution that uses information systems to monitor work systems to improve quality. Higher Education Institute STMIK STIKOM Indonesia has implemented an internal quality assurance system (SPMI). An example of its application is by carrying out an internal quality audit (AMI). To ensure the quality of the application meets the standards and needs of the user, it can be done by performing software testing based on the ISO 25010 standard.
Index Terms—Information System, ISO 25010, Software, Testing.
Information systems are very important in this globalization era. Every organization and company cannot be separated from the role of information systems. Many information systems have been created to assist activities in organizations and companies. Information systems are used to support and improve the progress of a company. Information systems generally can be used as a reference for decision making or to monitor the progress of an activity process. In Higher Education the information system is very important to the information system in the company. Higher Education Institutions are institutions that use information systems to monitor work systems to improve quality. Higher Education Institutions as well as STMIK STIKOM Indonesia will not be able to realize their vision and mission properly if they ignore aspects of quality management.
In education the concept of quality audit has also been stated in the Law of the Republic of Indonesia Number 20 of 2003 concerning the National Education System. The existence of an internal quality audit has an effect on the quality of higher education. The Indonesian Institute of Higher Education STMIK STIKOM has implemented an internal quality assurance system (SPMI), for example by carrying out an internal quality audit (AMI) [1]. Internal quality audit is able to provide information on the strengths and weaknesses of the institution so that all members of the
higher education unit can take corrective steps to achieve the desired quality level.
STMIK STIKOM Indonesia utilizes an internal quality audit management information system, which is expected to be able to achieve the predetermined plan. The internal quality audit management information system at STMIK STIKOM Indonesia uses the Laravel framework. To ensure the quality of the application meets standards and user needs, software testing can be carried out. One of the popular standards for performing software testing is ISO 9126 due to its flexibility and general nature however, this standard has now been replaced by ISO 25010 [2]. To ensure that the information system used is of high quality and meets standards, research is carried out to analyze the quality of the system in the Internal Quality Audit Management Information System of STMIK STIKOM Indonesia using the ISO 25010 quality standard.
Research related to software testing has been carried out entitled "Analisa Evaluasi Aplikasi Augmented Reality Untuk Informasi Kebudayaan Bali Berdasarkan Standar ISO 25010" which has conducted an Evaluation Analysis with ISO 25010 quality standards on Android-based applications and in Compatibility testing, 27 Android-based smartphones were installed. with various specifications, and the results obtained that the installation on all devices was
successful with a percentage of 100% and no error messages appeared [3].
The research was conducted with the title " Evaluasi
Kualitas Website Bandung Smart City Menggunakan ISO/IEC 25010 Quality-in-Use Model " in which this study discusses the evaluation of website quality using standard methods to evaluate the quality of use by paying attention to the user's perspective, including effectiveness, efficiency, level website satisfaction in meeting user needs, and the results of research conducted in the form of a prototype [4].
The research entitled "SOAQM: Quality Model for SOA Applications based on ISO 25010" analyzes the important contributions contained in ISO 25010 regarding SOA applications and compared to ISO 9126, the result is that most of the quality attributes produced by ISO 25010 can be applied to SOA to a degree. certain. However, some of these quality attributes must be adapted when applied to SOA projects [5].
Methods and instruments in this evaluation are used to assist in analyzing the quality of the STMIK STIKOM Indonesia Internal Quality Audit Management Information System which was developed, the method used in this evaluation is the ISO 25010 quality standard which focuses on four (4) characteristic aspects including:
-
A. Functional Suitability Aspect
Quality analysis on the aspect of functional suitability testing is carried out by observing and experimenting with functions using the test case instrument. Each test case describes whether a function can run properly or not. To get a firm answer to whether the functions that are running are as expected, testing with the test case instrument uses the Guttam scale. The results of the test are then analyzed using (1) and (2).
∑x
— × 100% ... (1) n
∑y
— × 100% . (2) n
Annotation:
n : The total number of functions available
∑x : Number of functions that are running well
∑y : Number of functions that are running is not good
The results of these calculations indicate the percentage of most functions that are running well or not. Testing on the functional suitability aspect, the system is said to be good if the percentage of X (number of functions that are running well) is more than Y (number of functions that are not running well). The test results were also compared with the standard functional suitability criteria set by Microsoft in the Microsoft Certification Logo program (James Bach & Micahael Bolton, 2013: 34-35) [6]. The standards determined by Microsoft in the Microsoft Certification Logo program are described in the Table I.
TABLE I
Standar Microsoft Certification Logo
Pass Criteria
Each primary function tested is running as it should. The support function tested did not work properly, but it was not a serious error and had no effect on normal use
Failure Criteria
There is one primary function being tested is not working properly. There is a support function that was tested not running properly and it is a serious error that affects normal use.
-
B. Usability Aspect
Analysis of the quality from the usability testing aspect was carried out using a questionnaire method. The questionnaires distributed were given to Lecturers of STMIK STIKOM Indonesia as a research location from the usability aspect. The questionnaire used refers to the System Usability Scale (SUS) questionnaire by John Brooke. In the questionnaire, the answer to each question item uses a Likert scale which has a very positive gradation and a very negative gradient. The score conversion from the Likert scale on the questionnaire is in the Table II
TABLE II
Conversion of Answers to Questionnaire Items
|
Answer |
Score |
|
Strongly Disagree |
1 |
|
Disagree |
2 |
|
Doubtful |
3 |
|
Agree |
4 |
|
Strongly agree |
5 |
To calculate the score on the questionnaire, SUS has its own rules. For odd-numbered questions, the score answered on the questionnaire is reduced by one. While statements with an even number, the number five is reduced by the score of the answered value. Then all the scores are added up and then multiplied by the number 2.5. The SUS score ranged from 0-100 and the mean score was 68 [7]. The SUS score obtained from all respondents was then calculated the average value using (3):
_
X =
_
∑X
TV
.(3)
Annotation :
X : Average Score
∑X : Total score
V : Number of Respondents
A range of values that can be used to assist in determining whether the SUS score obtained indicates that an application is acceptable or not in terms of usability. In this study, after knowing the SUS average score, the score was compared with the range of values. SUS score ranges and their interpretations are shown in the Table III.
TABLE III
SUS Score and Its Interpretation
|
Skor SUS |
Interpretasi |
|
< 50 |
Not Acceptable |
|
50 - 70 |
Marginal |
|
> 70 |
Acceptable |
-
C. Performance Efficiency Aspect
Testing from the aspect of performance efficiency is carried out by load testing using the GTmatrix software. The test results on the aspect of performance efficience with GTmatrik software include a page speed score and a Yslow score as well as a detailed page that includes the full load time. Total page size and request. In testing the aspect of web performance efficiency, it is said to be good if the load time is at least less than 10 seconds [8]. The results are then compared with the Hoxmeier scale regarding user satisfaction with the response time proposed by Hoxmeier and DiCesare (2000) [9]. The Hoxmeier scale can be seen in Table IV.
TABLE IV
Hoxmeire scale
Response Time Predicate
(Seconds) < 3 3-9 9-12 >12
Very Satisfied Satisfied Quite Satisfied Not Satisfied
-
D. Portability Aspect
Quality testing on the portability aspect is carried out by observing and running the STMIK STIKOM Indonesia internal quality audit information system on several browsers. The browser on a PC / Desktop is used to perform cross browser testing or system checking with various browsers..
In this study, testing was carried out to obtain results from systems that meet the standards. Although the system can do what was planned beforehand, namely displaying the information system results from monitoring and evaluation of the Internal Quality Audit Management Information System STMIK STIKOM Indonesia, however, to ensure the system is running with standards, it is necessary to do usability testing. The results of the four aspects of the test are as follows
-
A. Functional Suitability Aspect Testing
Testing the functional suitability quality aspect is carried out by conducting tests on each function contained in the STMIK STIKOM Indonesia internal quality audit management information system. Functional suitability testing is assisted by a test case. The summary of the functional suitability test case test can be seen in the Table V.
From table above, it proves that all the functions tested in the internal quality audit management information system are running well so that:
γes = 7^÷ × 100% = 16 × 100% = 100%
Max 16
No = ^a÷ × 100% = -0× 100% = 0%
Max 16
It can be concluded that the results obtained are said to pass according to the standard criteria for functionality aspect on the Microsoft Certification Logo because every function that runs on the system can run as it should. Then from the percentage results, the software quality obtained from the functional suitability aspect is in accordance with the functionality attribute and has a very high scale because all functions have been running well.
-
B. Usability Aspect Testing Results
The usability aspect test was carried out using a questionnaire method. The questionnaire used is a system usability scale (SUS) questionnaire. In the system usability scale (SUS) questionnaire, there are 10 questions that will be given to respondents. The questionnaire was given to 20 respondents, namely lecturers at STMIK STIKOM Indonesia. The analysis of the results obtained is shown in Table VI.
Based on the calculation of the results of the questionnaire, the average SUS score was 71.1. The mean SUS score was then compared with the table regarding the SUS score. The average result of SUS 71.1 is in the acceptable category, this shows that the application developed can be accepted by end users well, it can be seen from the usability aspect.
TABLE V
Functional Suitability Test Results
|
No |
Test Name |
Result |
|
1 |
Login.php |
pass |
|
2 |
Bidang.php |
pass |
|
3 |
Jabatan.php |
pass |
|
4 |
Pegawai.php |
pass |
|
5 |
User.php |
pass |
|
6 |
User_data.php |
pass |
|
7 |
Proses.php |
pass |
|
8 |
Index.blade.php |
pass |
|
9 |
Audit.php |
pass |
|
10 |
Audit_detil.php |
pass |
|
11 |
Laporan.blade.php |
pass |
|
12 |
Temuan.blade.php |
pass |
|
13 |
Temuan_Rekap.blade.php |
pass |
|
14 |
Role.php |
pass |
|
15 |
Tx_akt.php |
pass |
|
16 |
Tx_akt_bukti.php |
pass |
-
C. Performance Efficiency Aspect Testing Results
Testing on the aspect of performance efficiency is carried out by load testing using the GTmatrix software which is tested on each page of the internal quality audit management information system. The test results can be seen in Table VII.
Obtained an average time of Page Speed 100% (Grade A), Yslow of 76% (Grade C) and load time of 2.1 seconds. The web is said to be good if the load time is at least less than 10 seconds. The results of the test load time of 2.1 seconds are then compared by using the Hoxmeier Scale Table about user satisfaction with the response time, these results are included in the very satisfying category because they are less than 3 seconds..
TABLE VI
Usability Test Results
|
!Respondents |
Question Item |
Score SUS | |||||||||
|
Ql |
q2 |
q3 |
q+ |
qs |
qfi |
q? |
qβ |
q’ |
qlθ | ||
|
rl |
3 |
3 |
3 |
4 |
3 |
3 |
1 |
4 |
3 |
2 |
70 |
|
r2 |
3 |
0 |
4 |
3 |
4 |
3 |
4 |
4 |
4 |
4 |
32.5 |
|
r3 |
3 |
2 |
4 |
3 |
3 |
3 |
4 |
4 |
3 |
2 |
'03 |
|
r4 |
3 |
1 |
3 |
2 |
2 |
3 |
3 |
2 |
2 |
1 |
60 |
|
r5 |
2 |
2 |
3 |
3 |
3 |
2 |
3 |
2 |
3 |
3 |
60 |
|
rd |
4 |
3 |
4 |
4 |
3 |
3 |
4 |
4 |
4 |
3 |
90 |
|
r7 |
3 |
0 |
3 |
4 |
2 |
2 |
3 |
4 |
3 |
3 |
67.5 |
|
r8 |
3 |
0 |
4 |
2 |
2 |
3 |
3 |
3 |
3 |
4 |
67.5 |
|
r9 |
4 |
3 |
4 |
4 |
3 |
3 |
4 |
3 |
4 |
4 |
90 |
|
rlθ |
3 |
2 |
3 |
4 |
3 |
2 |
3 |
3 |
2 |
2 |
67.5 |
|
ill |
3 |
2 |
2 |
4 |
2 |
3 |
2 |
1 |
3 |
1 |
57.5 |
|
112 |
2 |
2 |
4 |
4 |
2 |
2 |
2 |
2 |
2 |
2 |
60 |
|
113 |
2 |
1 |
3 |
2 |
2 |
1 |
3 |
3 |
3 |
4 |
60 |
|
rl4 |
3 |
3 |
4 |
2 |
3 |
3 |
4 |
3 |
3 |
3 |
70 |
|
rl5 |
4 |
3 |
4 |
3 |
4 |
2 |
4 |
3 |
4 |
2 |
82.5 |
|
116 |
3 |
1 |
3 |
4 |
2 |
3 |
3 |
3 |
3 |
4 |
■2.5 |
|
rl7 |
2 |
2 |
3 |
4 |
2 |
3 |
2 |
4 |
3 |
4 |
■2.5 |
|
rl8 |
4 |
4 |
5 |
2 |
4 |
1 |
5 |
2 |
5 |
3 |
70 |
|
119 |
2 |
3 |
3 |
3 |
2 |
2 |
2 |
2 |
3 |
3 |
62.5 |
|
120 |
1 |
4 |
4 |
4 |
4 |
4 |
3 |
4 |
4 |
1 |
32.5 |
|
Count |
1.442.5 | ||||||||||
|
Average Score SUS |
71.1 | ||||||||||
TABLE VII
Performance Efficiency Aspect Testing Results
|
No |
Page |
Testing Result | ||
|
Page Speed |
Yslow |
Time | ||
|
Administrator | ||||
|
1 |
Login |
100 |
76 |
2.6 |
|
2 |
Home |
100 |
76 |
2.4 |
|
3 |
Bidang |
100 |
76 |
2.5 |
|
4 |
Jabatan |
100 |
76 |
2.5 |
|
5 |
Pegawai |
100 |
76 |
2.6 |
|
6 |
User |
100 |
76 |
2.5 |
|
7 |
Proses |
100 |
76 |
3.0 |
|
8 |
Jadwal Audit |
100 |
76 |
2.8 |
|
9 |
Halaman Laporan |
100 |
76 |
2.7 |
|
Employees | ||||
|
1 |
Login |
100 |
76 |
2.4 |
|
2 |
Home |
100 |
76 |
2.7 |
|
3 |
Auditor |
100 |
76 |
2.7 |
|
4 |
Auditie |
100 |
76 |
2.5 |
|
Average |
100 |
76 |
2.1 | |
-
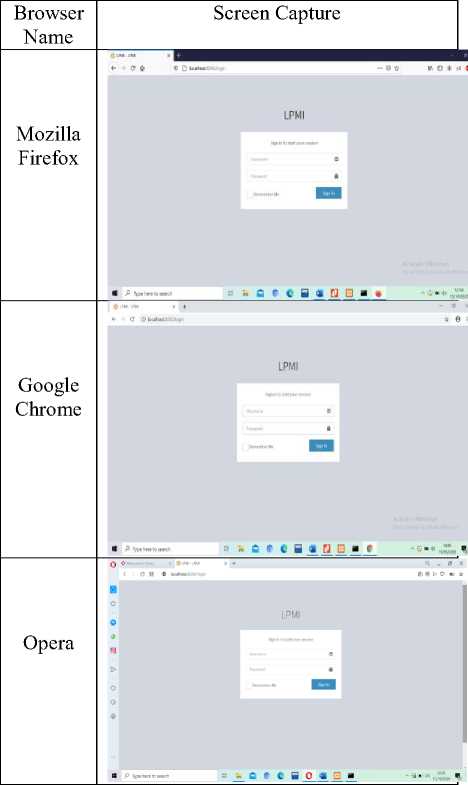
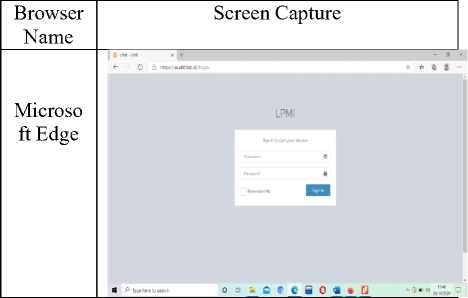
D. Portability Testing Results
Testing from the aspect of protability to be done by operating the internal quality audit information system STMIK STIKOM Indonesia in several different browsers.
TABLE VIII Portability Testing Result
|
No |
Browser Name |
Version |
Result |
|
1 |
Mozilla Firefox |
81.0.2 |
Runs well without error messages |
|
2 |
Google Chrome |
74.0.3729.108 |
Runs well without error messages |
|
3 |
Opera |
71.0.3770.271 |
Runs well without error messages |
|
4 |
Microsoft Edge |
86.0.622.51 |
Runs well without error messages |
The documentation of the results of testing the portability aspects of the developed internal quality audit management information system is shown in the Table IX.
Based on the test results above, it is known that the internal quality audit management information system STMIK STIKOM Indonesia can run well on several types of web browsers. So it can be concluded that the internal quality audit management information system STMIK STIKOM Indonesia has met the quality criteria in terms of the aspect of protection..
The browsers used for testing are Mozilla Firefox, Google Chrome, Opera and Microsoft Edge. The test results are shown in the Table VIII.
TABLE IX
Screen Capture Portability Testing Results
This study shows that the results of the analysis using the ISO 25010 quality standard in testing the four characteristic aspects of the internal quality audit management information system as a whole, the system is functioning properly, in terms of the results of the Functional Suitability test, all functions are running well. Based on the usability aspect, it was acceptable with an average score of sus 71.1. and the average response time generated by the system is 21 seconds, indicating that these results fall into the very satisfying category When compared to the user satisfaction table for the response time.
Acknowledgment
This research supported by STMIK STIKOM Indonesia.
References
-
[1] I Putu Adi Pratama, I. G. T. S. 2017. "Rancang Bangun Sitem Monitoring Pelaksanaan Dan Hasil Audit Mutu Internal". Jurnal S@CIES Volume 7, Nomor 2.
-
[2] Martino, C.-, dan Andry, J. F. 2020. "Testing Aplikasi Business Activity Monitoring Pada Internet Service Provider Menggunakan Iso 25010". Jurnal Teknoinfo, 14(1), 35.
https://doi.org/10.33365/jti.v14i1.451.
-
[3] Andika, I. G., dan Yanti, C. P. 2018. "Analisis Evaluasi Aplikasi Augmented Reality Untuk Informasi Kebudayaan Bali Berdasarkan Standar ISO 25010". Jurnal RESISTOR (Rekayasa Sistem Komputer),1(1),34–40.
https://doi.org/10.31598/jurnalresistor.v1i1.241.
-
[4] Afiah, H., Darwiyanto, E., dkk. 2019. "Evaluasi Kualitas Website Bandung Smart City Menggunakan ISO / IEC 25010 Quality-in-Use Model", 6(2), 8830–8837.
-
[5] Soares, M. S. 2015. "SOAQM : Quality Model for SOA Applications based on ISO 25010", 60–70.
-
[6] Kuswidiardi, J. 2015. "Sistem Informasi Perpustakaan Berbasis Microsoft Visual Di Perpustakaan Smk Ypkk 1 Sleman Library Information System Based on Microsoft Visual Basic6 . 0 With". Sistem Informasi Perpustakaan.... (Jenar Kuswidiardi), 1–11.
-
[7] Bramantara, R. 2015. "Pengembangan dan Analisis Kualias Aplikasi Finding Moo Sebagai Pemetaan Lokasi Museum di Yogyakarta Berbasis Android", 1–9.
-
[8] Setiawan, H., dan Jati, H. 2012. "ANALISIS KUALITAS SISTEM INFORMASI PANTAUAN PEMBENTUKAN KARAKTER SISWA DI SMK N 2 DEPOK SLEMAN".
-
[9] Nur Islam, M. A., Muslim, M. A., dkk. 2018. "Analisis dan Perancangan Geographic Information System pada Pelacakan Lokasi Kurir Secara Real Time". Techno.Com, 17(2), 186–196.
Discussion and feedback