Balinese Mask Characters Classification using Bag of Visual Words Model
on
Journal of Electrical, Electronics and Informatics, Vol. 5 No. 1
25
Balinese Mask Characters Classification using Bag of Visual Words Model
Komang Budiarta1, Dewa Made Wiharta2, and Komang Oka Saputra3
-
1,2,3Master of Electrical Engineering Program, Faculty of Engineering
Udayana University
Denpasar – Bali, Indonesia
Abstract—Mask, often known by Balinese as “Tapel”, is made of pule wood. It depicts the representation of characters in the “badbad” or legend. Bali has many types of mask dances that are often performed, which makes tourists interested in visiting Bali. Unfortunately, many tourists do not know the information contained in Balinese masks. The most important information contained in the character of the Balinese masks. The characters of each mask are different even though they have the same type. As mask art is also a cultural heritage from generation to generation, it needs to be preserved. It is necessary to have information in the form of technology that can distinguish the characters from Balinese masks. In this study, bag of visual word method in the classification process of Balinese mask characters is used, where in this method, there are several algorithms used, namely SURF as feature detection, K-Means as a clustering process to get the value of feature quantization, and SVM as a classification of Balinese mask character. The result of the accuracy level obtained from the testing process is 80%.
Index Terms—Balinese Mask, SURF, K-Means, SVM
Mask, or what is often known by the Balinese people as “Tapel”, is made of wood media. The types of wood that are usually used for making masks include cananga and pule woods. Usually the character of the mask that is made is taken from the representation of the characters in "badbad" or a legend which emphasizes how the characterization of the character is performed in Balinese mask dance. In the mask dance, each performance or the dancer appears in a special outfit and wears a mask accompanied by the art of percussion (gamelan). So it can be said that Balinese mask art has a strong connection with dance and the art of percussion (gamelan) because every Balinese mask dance performance is always followed by Balinese dances and gamelan [1]. Balinese masks can be classified into 5, namely: bagus manis (sweet and handsome) mask, aeng (scary) mask, bagus seram (handsome and scary) mask, lucu (funny) mask and galak manis (fierce and sweet) mask [2].
With that many types of masks in Bali, tourists are interested in visiting Bali [3]. Tourists can find Balinese masks in traditional markets such as Sukawati markets, museums or mask dance performances, but many tourists do not know the information contained in Balinese masks. One information contained in Balinese masks is the character of Balinese masks. The characters of each mask are different even though they have the same type. So it is necessary to have information in the form of technology that can
distinguish the characters from Balinese masks. In addition, mask art is also a cultural heritage from generation to generation, so it needs to be preserved as stated in Pergub (Governor Regulations) No. 4 of 2014 concerning the Preservation of Balinese Cultural Heritage. One step to preserve Balinese culture is by combining art with technology.
Balinese masks have various patterns but also there are many similarities. To be able to classify the character of Balinese masks, the first thing to do is to identify the patterns or characteristics of each image. Then with the identification information of the pattern, the image classification process is carried out. The classification process aims to determine groups or categories of patterns based on the characteristics of the pattern so that it can distinguish between images. For this reason, the authors seek several research sources that are similar in the proposed research.
There are several studies related to this research such as Image Classification Using Bag Of Visual Words Model With FAST And FREAK [4]. This research explains that using the FAST and Freak feature in the feature detection process is very helpful in the image recognition process where the level of accuracy of the image classification reached 90.8%.
Research [5] detected weeds growing between plants. There are 2 detection features used, namely SIFT and SURF. The resulting accuracy rate in this study is 96.5%.
Research [6] used the SURF method as feature detection and SVM as recognition. SURF has a faster process than SIFT with the same advantages. The resulting accuracy rate is 97.87%.
In this study, we propose to use the bag of visual word method in the classification process of Balinese mask characters, where in the bag of visual word method, there are several algorithms used, namely SURF as feature detection, K-Means as a clustering process to get the value of feature quantization, and SVM as a classification of Balinese mask characters.
Until now, there are only a few research on masks in Indonesia, especially in Bali. In this study, the authors want to perform research which can later be used as a reference in developing the Balinese mask classification system in the future. This is considered important because it is a documentation of the introduction of Balinese art in the field of information technology on the classification of Balinese masks. Thus later Balinese, and also others, can recognize the classification of Balinese masks.
In conducting research, a research flow is needed to determine the steps in carrying out this research, as shown in Figure 1.
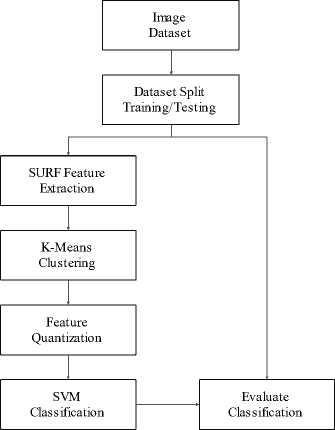
Fig. 1. Research Methods for Classification Balinese Mask Character.
-
A. Image Dataset
Balinese mask image data was collected using a digital camera with the same distance and lighting data resolution settings. The image then subjected to a preprocessing process to give better results in the classification process. The preprocessing process was carried out by cropping the image to focus the image on the mask shape and changing the ratio of the input image to 200 x 250 pixels. The image that has been processed was then sorted based on the 5 characters of
Balinese masks, namely. bagus manis (sweet and handsome), seram (scary), bagus aeng (handsome and scary), lucu (funny) and galak manis (fierce and sweet).
-
B. Dataset Split
The dataset used was split into 2 groups, where 70% of the sample data was used in the training process and 30% of the sample data used in the testing process. In the training process, the SURF Feature Extraction, K-Means Clustering, Feature Quantization, SVM Classification and Evaluate Classifier processes were carried out. In the testing process, the Evaluate Classifier process is carried out from the testing sample data with the model generated during the training process.
-
C. SURF Feature Extraction
The SURF algorithm aims to detect the local features of an image reliably and quickly. This algorithm is partly inspired by the SIFT (Scale-invariant feature transform) algorithm, especially at the scale space representation stage. The SURF algorithm uses a combination of an integral image algorithm and blob detection based on the determinant of the Hessian matrix [7]. In its implementation, the SURF algorithm is divided into several stages as follows [8]:
Interest Point Detection is used to select points that contain a lot of information and are stable against local or global disturbances in digital image. In the SURF algorithm, a point of interest detector that is invariant to the scale is selected, namely the blob detection. A blob is an area in a digital image that is constant or varies within a certain range. To compute this blob detection, the Determinant of the Hessian (DoH) matrix of the image is used. Given the point x = (x, y) in image I, the Hessian matrix H (x, σ) at x with the scale σ is defined as:
rJTf γ [ Lxx (x,σ)Lxy(x,σ)
^(x,σ) = [kyχ(x^) kyy(x^)∖ (1)
Where Lxx(x,σ) is the convolution of the second derivative of the Gaussian function ∂ ^ 2 / [∂x] ^ 2 g (σ) with image I at point x. This definition also applies to Lxy (x, σ) and Lyy(x,σ). In the SURF algorithm, the determinant of the Hessian matrix is calculated from the Haar wavelet using its optimal image integral. The determinant of the Hessian matrix is used as the basis for the SURF algorithm because of its scale invariance, stability and repeating easily.
Feature Description is a feature defined as a part that contains a lot of information in an image, and this feature is used as a starting point for object detection algorithms. The purpose of this feature detection process is to obtain a description of the features in the observed image. The first step is to look at the dominant orientation of the point of interest contained in the image, then build an area that will be taken in value and look for the correspondence features in the comparison image. In determining the orientation of an image, we use the Haar wavelet filter. Here the level of slope of an observed feature can be determined (Fig. 2)
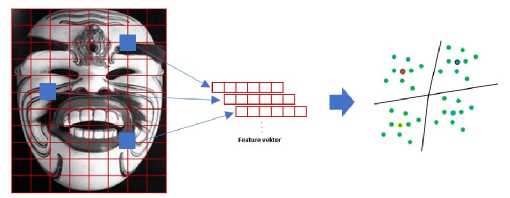
Fig. 2. SURF Extraction Feature.
-
D. K-Means Clustering
K-Means is a popular algorithm used in cluster analysis and is applied in various fields such as machine learning, pattern recognition, image analysis, information retrieval, and bioinformatics. The idea of k-means is to group numbers of n data into k clusters, where n is the part of the cluster with the closest distance or mean value [9]. The K-means grouping process is as follows. First, an initial K centroid is selected, where K is defined by the user and indicates the number of clusters desired. Each point in the data is then assigned to the nearest centroid, and each collection of points assigned to the centroid forms a cluster. The centroid of each cluster is then updated based on the points assigned to that cluster. This process is repeated until there are no cluster change points [9][10]. (Fig. 3)
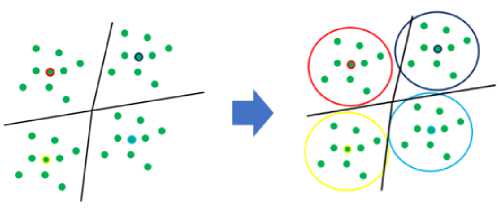
Fig. 3. K-Means Clusstering Process.
-
E. Feature Quantization
Clusters generated from the K-Means process are referred to as visual vocabulary where each result from the center of the cluster is visualized to construct a visual word occurrence histogram using Euclidean distance. Each extracted feature is allocated to its closest visual word (closest neighbor). A visual word histogram is then created by counting the number of features assigned to each visual word [11]. The length of the histogram is equal to the number of cluster centers generated by k-means clustering, where the value to n on the histogram is occurrence of the visual word to n. This process is commonly known as feature quantization (Fig. 4)

Fig. 4. Visual Word Occurences of Feature Quantitazion Process.
-
F. SVM Classification
Support Vector Machine (SVM) [12][13] is a technique to do prediction, both in regression and classification . The SVM Technique is used to get the optimal split function (hyperplane) to divide the observation which has different target variable values. This hyperplane can be in form of a line on two dimensions and can be a flat plane on multiple dimensions.
-
G. Evaluation Classifier
Evaluation Classifier[14][15] is the process of evaluating the results of the classification process to obtain an accuracy level using a sample of test data and a sample of training data. This process is used as a reference for the success rate in the classification of Balinese mask characters. The equations used in the Evaluation Classifier process can be seen in equation 2
Accuracy =
TP+TN
TP+FP+TN+FN
(2)
Where TP is true-positive, FP is false-positive, TN is truenegative and FN is false-negative.
The feature detection process using the SURF method produces the best number of features in each character category as 1343. So that the total number of features obtained in the training dataset of 1343 × 5 Balinese mask characters is 6715. In the clustering process there is a parameter used in determining the number of clusters called the vocabulary size. By default, this will be set at 500. Based on the number of vocabulary sizes used, each sample will have 500 features which are depicted in the form of a histogram as shown in Figure 4. Based on the features that have been obtained, the classification stage is carried out using SVM to produce a model of recognition. This model is evaluated using a test dataset so as to produce a test accuracy matrix.
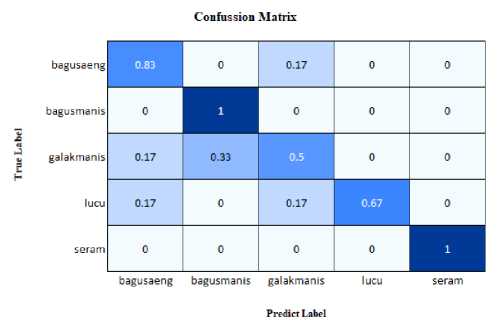
Fig. 5. Confusion matrix result of classification data testing.
Based on the results of confusion matrix (Fig 5), it can be seen the level of success in the classification of Balinese mask characters. The value of the accuracy level from the test results can be calculated as follows:
Accuracy = 0.83+1+p.5+0.67+1 × 100 % = 80 %
Testing at the next stage is to change the number of vocabulary used to determine the effect on the level of accuracy in classification. The number of vocabulary parameters used includes 100, 250, 500, 750 and 1000. The results of accuracy level and processing time required for training and testing can be seen in table I
|
TABLE I Level of Accuracy and Time on Training and Testing |
|
Training Testing Vocabulary Accuracy Accuracy Size Time (s) Time (s) Level Level |
|
100 |
89 % |
33.47 |
67 % |
2.5 |
|
250 |
91 % |
37.01 |
70 % |
2.38 |
|
500 |
99 % |
39.87 |
80 % |
2.48 |
|
750 |
99 % |
45.99 |
77 % |
2.55 |
|
1000 |
99 % |
39.79 |
77 % |
2.74 |
In table I, it can be seen how the effect of vocabulary size on the level of accuracy of training and testing. At the training stage, the vocabulary size can have an effect on increasing the results, the level of accuracy and time required in training also increases. At the testing stage, the vocabulary size has no significant effect when the vocabulary used has reached 500. Based on these results it can be concluded that the vocabulary size 500 can provide good results in terms of the level of accuracy of training and testing. Besides that, the time needed is better than other vocabulary sizes.
Based on the discussion of the results achieved by the bag of visual words method in the classification of Balinese mask characters, it can be concluded that the feature detection obtained in the SURF process was 6715 features, where the clustering process was carried out using a vocabulary amount of 500 to get the quantization feature for each sample. Thus
later the classification process can be carried out using SVM. The results shown that the testing process reached 80% accuracy. In addition, when the number of vocabularies are varied, the level of accuracy did not give a better result than vocabulary of 500.
References
-
[1] I. W. Dibia, “71 I Wayan Dibia,” pp. 71–85, 2016.
-
[2] I. W. Suardana, “75 struktur rupa topeng bali klasik,” vol. 4, no. 1,
2006.
-
[3] J. Witabora, K. S. Adidharma, L. C. Luzar, M. Meilani, and N. Soedarso, “Usability, Design, and Content Issues of Mobile Apps for Indonesia Cultural Art Promotion: A Balinese Mask,” Humaniora, vol. 7, no. 4, p. 427, 2016, doi: 10.21512/humaniora.v7i4.3596.
-
[4] N. Singhal, N. Singhal, and V. Kalaichelvi, “Image classification using bag of visual words model with FAST and FREAK,” Proc. 2017 2nd IEEE Int. Conf. Electr. Comput. Commun. Technol. ICECCT 2017, 2017, doi: 10.1109/ICECCT.2017.8117861.
-
[5] H. K. Suh, J. W. Hofstee, J. Ijsselmuiden, and E. J. Van Henten, “ScienceDirect Sugar beet and volunteer potato classification using Bag-of-Visual-Words model , Scale-Invariant Feature Transform , or Speeded Up Robust Feature descriptors and crop row information,” Biosyst. Eng., pp. 1–17, 2017, doi:
10.1016/j.biosystemseng.2017.11.015.
-
[6] B. Anand, “Face Recognition using SURF Features and SVM Classifier,” vol. 8, no. 1, pp. 1–8, 2016.
-
[7] X. Wang, X. Lv, L. Li, G. Cui, and Z. Zhang, “A New Method of Speeded Up Robust Features Image Registration Based on Image Preprocessing,” 2018 Int. Conf. Inf. Syst. Comput. Aided Educ., pp. 317–321, 2018.
-
[8] M. Paul, N. I. T. Silchar, and N. I. T. Silchar, “Image Hashing based on Shape Context and Speeded Up Robust Features ( SURF ),” 2019 Int. Conf. Autom. Comput. Technol. Manag., pp. 464–468, 2019.
-
[9] X. Zhang, K. Jiang, Y. Zheng, J. An, Y. Hu, and L. Jiao, “Spatially Constrained Bag-of-Visual-Words for Hyperspectral Image
Classification,” pp. 501–504, 2016.
-
[10] V. Mehra, “Hand Gesture Recognition using Support Vector Machine and Bag of Visual Words model Feature Selection / Engineering,” pp. 5–8, 2018.
-
[11] H. Kato and T. Harada, “Image reconstruction from bag-of-visual-words,” Proc. IEEE Comput. Soc. Conf. Comput. Vis. Pattern Recognit., pp. 955–962, 2014, doi: 10.1109/CVPR.2014.127.
-
[12] M. Yao and C. Zhu, “SVM and Adaboost-based classifiers with fast PCA for face reocognition,” 2016 IEEE Int. Conf. Consum. Electron. ICCE-China 2016, pp. 0–4, 2017, doi: 10.1109/ICCE-
China.2016.7849742.
-
[13] B. U. Umar, J. Agajo, O. M. Olaniyi, A. Aliyu, O. S. Owolabi, and J. G. Kolo, “Human Detection Using Speeded-Up Robust Features and Support Vector Machine from Aerial,” 2017.
-
[14] E. Kremic and A. Subasi, “Performance of random forest and SVM in face recognition,” Int. Arab J. Inf. Technol., vol. 13, no. 2, pp. 287– 293, 2016.
-
[15] R. Senthilkumar and R. K. Gnanamurthy, “Performance improvement in classification rate of appearance based statistical face recognition methods using SVM classifier,” 2017 4th Int. Conf. Adv. Comput. Commun. Syst. ICACCS 2017, 2017, doi:
10.1109/ICACCS.2017.8014584.
Discussion and feedback