Analysis of Sales Forecasting on Galah Kopi Using the Fuzzy Time Series Method
on
Journal of Electrical, Electronics and Informatics, p-ISSN:2549-8304 e-ISSN:2622-0393
1
Analysis of Sales Forecasting on Galah Kopi Using the Fuzzy Time Series Method
Christina Purnama Yanti1, Kadek Listy Mas Setya Devi2, Santi Ika Murpratiwi3, Theresia Hendrawati4
-
1,2,3,4Faculty of Technology and Informatics
Institut Bisnis dan Teknologi Indonesia
Bali, Indonesia
Abstract - Galah Kopi is one of the coffee shops in Tabanan. Addressed at Jl. Raya Babadan Senganan No. 13, Penebel District, Tabanan Regency. Galah Kopi's sales only use previous sales data as a benchmark without the aid of calculations using a more accurate scientific method. The coffee shop also experienced erratic sales problems. The solution that can be used is to do forecasting. This study uses the Fuzzy Time Series method for sales forecasting. The results of this study show that the model method has an accuracy value where the results of the coffee category with an MSE value of 901,917, MAE 27,715 and MAPE 6,115, the Chen model with an MSE value of 4939,505, MAE 57,952 and MAPE 12,574. Fuzzy time series model Singh in the non-coffee category with MSE values of 3249.019, MAE 50.177 and MAPE 6.96, with the Chen model with MSE values of 23536.2, MAE 125.904 and MAPE 19.00. Fuzzy time series model Singh for the Food category with MSE values of 1286.453, MAE 32.187 and MAPE 8.211, with the Chen model with MSE values of 14175.61, MAE 98.273 and MAPE 103.45. Fuzzy Time Series Singh model in snack category with MSE value of 1285.114, MAE 30.845 and MAPE 41.967, with the Chen model with MSE value of 14175.61, MAE 98.273 and MAPE 103.45. So that the model method that has the smallest accuracy is the fuzzy time series Singh
Index Terms— Forecasting, Fuzzy Time Series, Sales
Along with the development of an increasingly modern era and the increasing needs of society, resulting in intense business competition. Competition in the business world between companies makes companies concentrate on the process of creating products and services. Concentration will produce a few products and services that have quality and competitiveness in the market, but it is difficult for other companies to perform efficiently so that production costs remain high. Currently, business in the field of coffee is very much in demand for teenagers. Many Indonesians consider drinking coffee as a way of life, both among the elite, middle class, and small communities.
Galah Kopi is one of the coffee shops in Tabanan. This coffee shop is located at Jl. Raya Babadan Senganan No. 13, Penebel District, Tabanan Regency. This coffee shop was founded in 2019 which has been running for almost 3 years. At the beginning of 2019 this coffee club was founded by 4 friends who had the desire to build a coffee shop without alcoholic beverages, so that all members of the public could visit and benefit the coffee shop owner.
Over time, the coffee shop business has grown and has 6 employees.
From the results of an interview with I Putu Hery Dana as the owner of Galah Kopi, the company has not applied the scientific method to determine monthly sales. Galah Kopi only uses previous sales data as a benchmark without the aid of calculations using a more accurate scientific method. Coffee shops are also experiencing problems with erratic sales, causing coffee shop owners to have difficulty in supplying existing raw materials and ensuring that the quality of taste and service is maintained. Purchases of raw materials are usually erratic from the owner, this allows for stockouts of raw materials when sales increase such as during holidays where more consumers come to the coffee shop and excess stocks of raw materials when sales decrease like last year during the Covid-19 pandemic which causes reduced income and erratic sales every month.
With these problems, careful planning is needed to be able to estimate sales of goods in the future to match the amount of raw material stock available so as not to experience losses at the coffee shop. Therefore, we need a technique that can be used in processing in the future. One method that is often used is forecasting techniques.
Forecasting techniques (forecasting) are activities that
aims to find out and predict what will happen in the future by using past history [1]. Sales forecasting is an activity to estimate sales of services by distributors in certain time periods and regions. One of the benefits of sales forecasting is being able to estimate sales accurately from time to time so that production plans can be made according to sales forecasts [2]. When sales are predicted accurately, business fulfillment can run well. The forecasting method that will be used in this research is the Fuzzy Time Series.
Fuzzy Time Series is a data forecasting method that uses fuzzy principles as its basis. Forecasting using this method can capture past data patterns and then use it to project future data [3] with the aim of overcoming this problem by estimating sales at Galah Kopi. The reason researchers use the Fuzzy Time Series method is because based on the data obtained, namely periodic data, this method is used to solve forecasting problems where historical data are linguistic values [4]. This research can help the owner of Galah Kopi in determining the exact amount of raw material inventory in the future so that Galah Kopi does not experience losses and reduced income.
-
A. State off The Art
In this study, five previous studies were used as comparison material and reference in the process of making research as the theory used was relevant. In the first study conducted by Suartini et al [5] with the title "Forecasting Using Fuzzy Time Series Cheng Forecasting Using Fuzzy Time Series Cheng Method". This study analyzes forecasting of the composite stock price index (IHSG), which is an indicator of stock price movements on the Indonesia Stock Exchange. The results of forecasting using the Fuzzy Time Series Cheng method on IHGS data for October 2016 amounted to 5,367.98 points and based on a MAPE value of 2.56% stated that the FTS Cheng method had a MAPE value below 10% with an accuracy value of forecasting results of 97 .44%.
In the second study conducted by Dhia Jannati et al [6] with the title "Analysis of Best Seller Coffee Needs Design to Meet Customer Demand at Kopi Titik Cafe by Using Forecasting Methods". The results obtained from this study are the best seller coffee sales pattern at Kopi Titik Cafe, namely a trend pattern which then uses the Double Exponential Smoothing method and gets each result from the best seller coffee with a MAPE value, namely milk coffee 0.268285274%, americano 0.36874754%, and cappuccino 0.38905617%.
In the third study conducted by Moch Rizal Kurniaan et al [7] with the title "Forecasting Coffee Sales with WebBased Exponential Smoothing Method". The test results of the system created stated the problem that the results of the program that had been made had sufficient results according to that as evidenced by the results of accuracy testing with MSE RMSE and MAPE copies on 6 types of coffee whose results were no more than 50% and functional
testing of the system with access as admin according to its function in the browser.
In the fourth study conducted by Nida Hafiyyam et al [8] with the title "Implementation of the Fuzzy Time Series Method in Forecasting Gold Prices in Indonesia". The research results obtained were the gold price forecast for the period July 1, 2022, of IDR 988,313 and the MAPE value of 0.60515%. The MAPE value indicates that Chen's fuzzy time series method is very good for predicting gold price data in Indonesia.
In the fifth study conducted by Ni Putu Adelia Indah Paramita [9] with the title "Comparative Analysis of the Single Moving Average and Double Exponential Smoothing Methods for Sales Forecasting at UD. Amerta Sedana". The results of calculating small pot number 1 using the 2-month Single Moving Average method show an MSE value of 56.1 and an MAD value of 4.942857. So, the best method for forecasting small pot number 1 is the 2-Month Single Moving Average method because it has the smallest accuracy value.
Of all the previous studies that have been described above, there are similarities and differences in this study. The difference from the research above is that this research only analyzes or does not design the system. Meanwhile, in this study, a forecasting system will be developed that can forecast the sales volume of food and beverage products at Galah Kopi using previous product sales data using the Fuzzy Time Series method.
-
B. Forecasting
Forecasting is the art and science of predicting events that will occur in the future using historical data that applies some form of mathematical model. Forecasting is an assumption based on forecasting variables based on historical time series of future demand [8].
The forecasting process is carried out using scientific methods and systematically. Qualitative properties such as feelings, experiences and others are important in the forecasting process besides using scientific or organized procedures. If you want to estimate a variable, it must be considered and studied in the past. To learn how the history of the development of a variable is, we will observe a series of variable values according to time [10].
Organizations use 3 main types of forecasting in planning operations for the future, namely Economic Forecast, Technological Forecast, and demand forecasting [1].
-
C. Time Series Method
Time Series is data that is arranged based on time sequence or data collected from time to time. The time used can be days, weeks, months, years, and so on. Thus, periodic data relates to statistical data that is recorded and investigated within certain time intervals, such as sales, prices, inventories, labor production, exchange rates (exchange rates), and stock prices [10]. Time series data is data that consists of one object but covers several time periods, for example daily, weekly, monthly, yearly data, and others [5].
-
D. Fuzzy Time Series Method
Fuzzy Time Series is a forecasting method that applies the fuzzy set concept as a basis for its calculations. The forecasting system used in this method works by capturing past data patterns to project future data [8]. Fuzzy Time Series is a new concept from Song and Chissom based on fuzzy set theory and the concept of linguistic variables. FTS is a concept that can be used in predicting problems with historical data formed into linguistic values. This can be interpreted that the previous data in the FTS is linguistic data, while the latest data generated is a real number.
The following are the steps in calculating the Fuzzy Time Series method according to Chen's algorithm.
-
1) Determination of the universal set (U) by using the following equation:
U = [Dmin ,Dmax] (1)
Where U is the universal set of historical data, Dmin is the data with the lowest (minimum) value and Dmax is the data with the highest (maximum) value.
-
2) Determination of intervals, namely dividing the universe set into several intervals with the same distance. To make it easier to determine the interval, the Sturges equation can be used as follows:
n= 1+3,3logW (2)
Where n is the number of intervals and N is the number of historical periods.
-
3) Determination of the length of the interval (l) by using the following equation:
I=Dmax-Dmin n (3)
Where l is the length of each interval and n is the number of intervals
-
4) Determination of the fuzzy set at each interval. Fuzzy sets can be interpreted as a class of numbers with fuzzy boundaries. If U is a universal set with U = [u1, u2, u3, … ,up]
-
5) Determination of Fuzzification, namely converting historical data in the form of numeric variables (non-fuzzy) into linguistic variables (fuzzy) based on predetermined fuzzy sets.
-
6) Determination of Fuzzy Logic Relationship (FLR). FLR is a relationship between data that has gone through the fuzzification stage on previous historical data. Two successive fuzzifications Ai (t-1) and Aj(t) can be converted into FLR with the notation Ai → Aj where Ai is the current state or left-hand side (LHS) and Aj is the next state or right hand side (RHS).
-
7) Determination of Fuzzy Logic Relationship Group (FLRG). Relations with the same fuzzy set on the left side (current state) will be grouped.
-
8) Defuzzification and forecast calculations.
There are two fuzzy time series methods used in this study.
-
1) Singh’s Fuzzy Time Series model, developed by Shiva Raj Singh in 2007. It was redeveloped to make it easier by minimizing the complexity in calculating fuzzy relational matrices and looking for an appropriate defuzzification process using a simple algorithm. Singh proposed a simple computational method for forecasting fuzzy time series by using a simple algorithm and has a linear order complexity. This method minimizes the complexity in calculating fuzzy relational matrices and looks for an appropriate defuzzification process and is expected to be able to provide better accuracy estimates [11].
-
2) Chen’s Fuzzy Time Series Model, Shyi-Ming Chen in 1996 again developed the FTS method by simplifying arithmetic operations at the stage of forming fuzzy relations. In the beginning, there was the Song and Chrissom method which had complicated calculations where the calculations used complex matrix operations even though the defuzzification results were the same. So Chen developed a method that was simpler than the previous method [8].
-
E. Forecasting Accuracy Measurement
Several methods have been used to show errors caused by a particular forecasting technique. Almost all these measures use the averaging of several functions of the difference between the actual value and the forecast value. The difference between the actual value and the forecast value is usually referred to as the residual. One way to evaluate forecasting techniques is to use a measure of the degree of difference between forecast results and actual demand. There are several forecasting performance measures [6].
-
1) Mean Square Error (MSE)
Mean Square Error (MSE) is calculated by adding up the squares of all forecasting errors in each period and dividing it by the number of forecasting periods.
MSE=Σ(At-Ft)2n (4)
Where At is the actual demand in the -t period, Ft is the forecast in the -t period, and n is the number of forecasting periods involved.
-
2) Mean Absolute Error (MAE)
Mean Absolute Error (MAE) is one of the methods used to measure the accuracy of forecasting models. The MAE value shows the average absolute error between forecasting or prediction results and real values.
MAE=Σ∖At-Ft∖n (5)
Where At is the actual demand in the -t period, Ft is the forecast in the -t period, and n is the number of forecasting periods involved.
-
3) Mean Absolute Percentage Error (MAPE)
Mean Absolute Percentage Error (MAPE) is the average error value taken from the average difference between the absolute difference between the actual value and the
forecast value and the actual value itself. MAPE is stated in the following statement:
MAPE=Σ∖At-Ft∖Atn x 100 (6)
Where At is the actual demand in the -t period, Ft is the forecast in the -t period, and n is the number of forecasting periods involved.
Forecasting results are said to be good if the MAPE value obtained is getting smaller. The MAPE criteria are as follows:
TABLE I
MAPE Criteria
|
MAPE |
Criteria Value |
|
x<10% |
Forecasting ability is very good |
|
10% ≤ x < 50% |
Good forecasting ability |
|
20% ≤ x < 50% |
Forecasting ability is quite good |
|
x ≥ 50% |
Poor forecasting ability |
-
III. RESEARCH METHOD
In order to structure this research, the authors apply a research flow that starts from literature studies, then collects data in the form of sales data on Galah Kopi, performs forecasting calculations using the Fuzzy Time Series method with manual calculations, evaluation calculations which will produce error values from calculations using MSE, MAE, MAPE, then the results of the conclusions from calculations using the Fuzzy Time Series method in forecasting product sales per category at Galah Kopi. The research flow can be seen in the following figure 1.
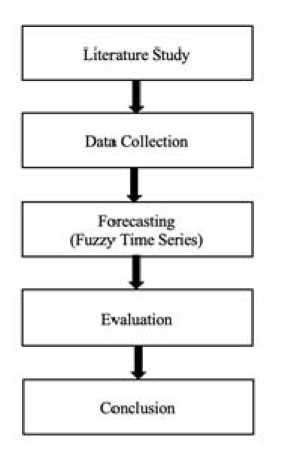
Fig. 1. Research Method
The place for conducting this research is at Galah Kopi which is located at Jl. Raya Babadan Senganan No. 13, Penebel District, Tabanan Regency. The time for conducting this research was from March-May 2022. In compiling the report, it is necessary to collect data to obtain
the information needed by the author in order to achieve the research objectives, so the authors do it using several data collection techniques including primary data collection methods consisting of interviews and observations. and secondary data collection methods consisting of documentation and literature. From data collection, the authors managed to document sales results for one year in Table II.
|
TABLE II Sales Data | ||
|
Category |
Items sold |
Gross sales |
|
Appetizer |
388 |
4667000 |
|
Burger |
20 |
500000 |
|
Dessert |
105 |
1185000 |
|
Hot Coffee |
158 |
2063000 |
|
Iced Coffee |
376 |
4095000 |
|
Main Course |
494 |
5732000 |
|
Manual |
15 |
148000 |
|
Brew | ||
|
Milkshake |
121 |
1815000 |
|
Non-Coffee |
582 |
5180000 |
|
Rice Bowl |
126 |
1934000 |
|
Signature |
4 |
88000 |
|
Drink | ||
|
Appetizer |
388 |
4667000 |
After getting all the data, proceed with calculating the Fuzzy time series to find out the forecasting results for each category and evaluate it by calculating MSE, MAE, and MAPE.
TABLE III
Galah Coffee Product Sales Data for April 2021-April 2023
Product Category
|
No. |
Period |
Coffee |
Non-coffe |
Food |
Snack |
|
1 |
Apr-21 |
185 |
223 |
241 |
118 |
|
2 |
Mei 2021 |
588 |
584 |
525 |
355 |
|
3 |
Juni 2021 |
500 |
513 |
405 |
297 |
|
4 |
Juli 2021 |
387 |
389 |
106 |
248 |
|
5 |
Agustus 2021 |
492 |
591 |
438 |
627 |
|
6 |
September 2021 |
458 |
597 |
572 |
373 |
|
7 |
Oktober 2021 |
586 |
692 |
472 |
404 |
|
8 |
Novenber 2021 |
418 |
484 |
439 |
318 |
|
9 |
Desember 2021 |
545 |
763 |
627 |
425 |
|
10 |
Januari 2022 |
502 |
769 |
551 |
434 |
|
11 |
Februari 2022 |
419 |
546 |
433 |
330 |
|
12 |
Maret 2022 |
417 |
594 |
501 |
380 |
|
13 |
April 2022 |
553 |
703 |
640 |
493 |
|
14 |
Mei 2022 |
435 |
582 |
886 |
64 |
|
15 |
Juni 2022 |
646 |
467 |
837 |
48 |
|
16 |
Juli 2022 |
421 |
544 |
985 |
66 |
|
17 |
Agustus2022 |
555 |
459 |
1222 |
136 |
|
18 |
September 2022 |
448 |
402 |
924 |
118 |
|
19 |
Oktober 2022 |
358 |
459 |
1190 |
64 |
|
20 |
November 2022 |
359 |
483 |
586 |
130 |
|
21 |
Desember 2022 |
324 |
461 |
1032 |
18 |
|
22 |
Januari 2023 |
393 |
500 |
1096 |
46 |
-
IV. RESULT AND DISCUSSION
-
A. Sales Data
Sales forecasting with the Fuzzy Time Series method on Galah Kopi aims to find out how good the forecasting results are with two Fuzzy models, namely Fuzzy Time Series Singh and Fuzzy Time Series Chen. In this study the application used to predict sales at Galah Kopi is R Studio. The data used in this forecasting calculation is sales data for 4 categories of Galah Kopi products from April 2021 to January 2023. Sales data can be seen in Table III.
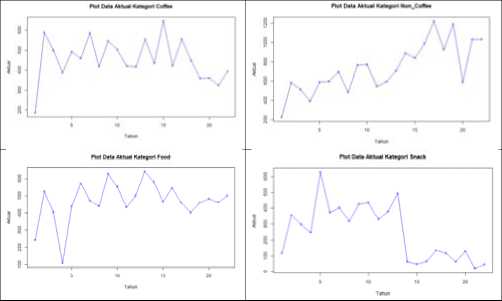
Fig. 2. Plot of Actual Coffee Galah Sales Data
From Figure 2, Galah Coffee shop sales have decreased significantly over a period and sales are classified as unstable and fluctuate. This becomes the focus to help carry out analysis in supporting decisions that must be taken in the future.
-
B. Prepare Data Set in R Studio
In forecasting using the Fuzzy Time Series method, the Singh and Chen models have 3 variables consisting of year, month, and actual data. The actual data used in this analysis is from April 2021-January 2023. Following are the steps for preparing the dataset in R Studio.
-
1) Import databases
The data in Table II will be imported into R Studio to carry out the forecasting process using the Fuzzy Time Series
2) Display databases
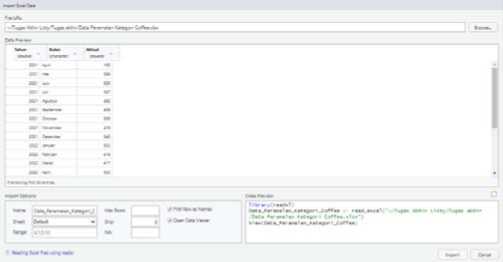
Fig. 3. Data Display in R Studio
In Fig. 3. The following is a display of the dataset which has been explained that importing the dataset can be done by clicking on the import dataset menu on the
environment menu. After that, select the type of dataset you have. In this study, researchers imported data from Excel files. Then, click From Excel
-
3) Dataset display in R Studio
Fig 4 is a display of the data in the console menu and the data corresponds to the original data imported from the computer's internal storage, which can be seen from the display of data starting from April 2021. The data above consists of 3 variables, namely 22 variables 'Year' with type data double, variable 'Month' with data type char and variable 'Actual' with data type double. After preparing the dataset, computational sales forecasting will be carried out using each method, namely Fuzzy Time Series Singh and Chen.
|
Tahun |
Bul an |
Aktual | |
|
<db7> |
<chr> |
<dbJ> | |
|
2021 |
Apri 1 |
185 | |
|
2021 |
Mei |
588 | |
|
2021 |
Juni |
500 | |
|
4 |
2021 |
Juli |
387 |
|
□ |
2021 |
Agustus |
492 |
|
2021 |
September |
458 | |
|
2021 |
Oktober |
586 | |
|
8 |
2021 |
November |
418 |
|
2021 |
Desember |
545 | |
|
10 |
2022 |
Januari |
502 |
|
# .. |
_ with |
12 more rows | |
# i Use 'print(n = ...)' to see more rows
Fig. 4. Dataset display in R studio
-
C. Implementation of Sales Forecasting with the Fuzzy Time Series Method.
In forecasting calculations using the fuzzy time series method for Galah Kopi, the researcher uses a model that corresponds to actual sales data. The fuzzy time series model used in this study is the Singh and Chen model. The researcher uses the Singh model because it is said to be better for forecasting and easier by minimizing the complexity in calculating fuzzy relational matrices and looking for an appropriate deflection process using a simple algorithm. This method minimizes the complexity of calculating fuzzy relational matrices and looking for defuzzification processes. Meanwhile, the Chen model simplifies arithmetic operations at the stage of forming fuzzy relations and develops a simpler method than the previous method. The following are the stages of performing calculations to obtain forecasting results using the Singh and Chen fuzzy time series model using R Studio.
In Figure 5 is a display of the dataset in R Studio. The first thing to do is create a new project and import the database. Because the data used in this study is in the form of an Excel file, use the following code so that you can read the data in the Excel file.
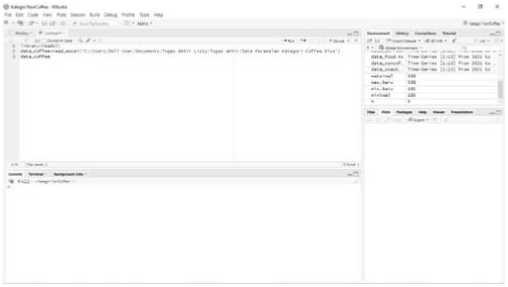
Fig. 5. Import Dataset
In Figure 6 below is a display of forecasting calculations using the Singh model fuzzy time series method. To analyze time series data and be able to produce forecasts, some code is needed as shown in Figure 6.
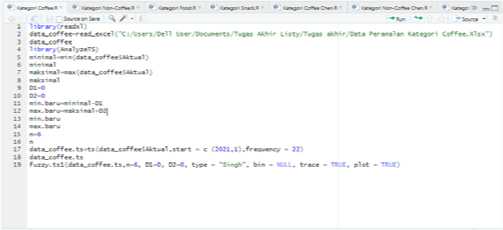
Fig. 6. Computational Forecasting with the Fuzzy Time
Series Model Singh Method
Figure 7 shows the forecasting results of Galah Coffee Sales using the singh model fuzzy time series method. In Figure 7 there is an image of actual data and fuzzy calculations where the actual value symbolized by A is defuzzified to become a forecast value. So, from this process the results of forecasting using this method have been obtained.
Jtabl e2
|
poi nt |
actual |
rel ati ve |
forecasted | |
|
1 |
(2021,1) |
L85 |
Al-X-NA |
MA |
|
2 |
(2021,2) |
355 |
A6<—Al |
MA |
|
3 |
(2021,3) |
3 00 |
A5<—A6 |
MA |
|
4 |
(2021,4) |
387 |
A3< -A5 |
359.7917 |
|
5 |
(2021,5) |
492 |
A4<—A3 |
450.9722 |
|
5 |
(2021,6) |
-3 5 |
A4<—A4 |
478.6543 |
|
7 |
(2021,7) |
586 |
A6<—A4 |
603.7917 |
|
5 |
(2021,8) |
418 |
A4<—A6 |
472.9533 |
|
5 |
(2021,9) |
3-3 |
A5<—A4 |
5Ξ2.25OO |
|
LO |
(2021,10) |
502 |
A5<—A5 |
553.0953 |
|
Ll |
(2021,11) |
4L9 |
A4<—A5 |
460.1833 |
|
L2 |
(2021,12) |
4L7 |
A4<—A4 |
441. 3167 |
|
L3 |
(2021,13) |
553 |
A5<—A4 |
514.3750 |
|
L4 |
(2021,14) |
435 |
A4<—A5 |
452.9722 |
|
L5 |
(2021,15) |
646 |
A6<—A4 |
607.5833 |
|
LL |
(2021,16) |
42L |
A4<—A6 |
456. 9535 |
|
L7 |
(2021,17) |
355 |
A5<—A4 |
550.7500 |
|
L3 |
(2021,18) |
448 |
A4<—A5 |
458. 9533 |
|
19 |
(2021,19) |
358 |
A3< -A4 |
379.3611 |
|
20 |
(2021,20) |
359 |
A3<—A3 |
367.4621 |
|
21 |
(2021,21) |
324 |
A2<—A5 |
305.3750 |
|
22 |
(2021,22) |
393 |
A3< -A2 |
3 67.0 208 |
Fig. 7. Forecasting results of the Fuzzy Time Series Model Singh method
The following is the result of the error rate, which in this study uses the Mean Squared Error (MSE), Mean Absolute Error (MAE), Mean Absolute Percent Error (MAPE). as a method of testing the level of accuracy is shown in Figure 8.
Jaccuracy
ME MAE MPE MAPE MSE RMSE U
Singh -2.78 27.715 -0.935 6.115 901.917 30.031 0.2540614
Fig. 8. The level of accuracy of the Fuzzy Time Series Model Singh Method
In Figure 6 below is a display of forecasting calculations using the Chen model fuzzy time series method. To analyze time series data and be able to produce forecasts, some code is needed as shown in Figure 9.

Fig. 9. Computational Forecasting with the Fuzzy Time Series Model Chen Method
|
Stable2 |
actual |
relative forecasted | |||
|
poi nt | |||||
|
1 |
(2021,1) |
185 |
Al-K |
-NA |
NA |
|
2 |
(2021,2) |
588 |
A6c- |
-Al |
607.5833 |
|
3 |
(2021,3) |
3 00 |
A5<- |
-A6 |
492.3333 |
|
4 |
(2021,4) |
387 |
ABc- |
-A5 |
453.9167 |
|
: |
(2021,5) |
492 |
A4c- |
-A3 |
377.0833 |
|
6 |
(2021,6) |
458 |
A4<- |
-A4 |
492.3333 |
|
(ΞO2L,7) |
586 |
Afrc- |
-A4 |
492.3333 | |
|
B |
(2021,8) |
418 |
A4C- |
-A6 |
492.3333 |
|
9 |
(2021,9) |
345 |
A5<- |
-A4 |
492.3333 |
|
10 |
(2021,10) |
302 |
A5<- |
-A5 |
453.9167 |
|
11 |
(2021,11) |
419 |
A4c- |
-A5 |
453.9167 |
|
12 |
(2021,12) |
417 |
A4<- |
-A4 |
492.3333 |
|
13 |
(2021,13) |
353 |
A5<- |
-A4 |
492.3333 |
|
14 |
(2021,14) |
435 |
A4c- |
-A5 |
453.9167 |
|
15 |
(2021,15) |
646 |
Afrc- |
-A4 |
492. 33 3 3 |
|
16 |
(2021,16) |
421 |
A4c- |
-A6 |
492.3333 |
|
17 |
(2021,17) |
555 |
A5<- |
-A4 |
492.3333 |
|
18 |
(2021,18) |
448 |
A4c- |
-A5 |
453.9167 |
|
19 |
(2021,19) |
358 |
ABc- |
-A4 |
492.3333 |
|
20 |
(2021,20) |
35 9 |
ABc- |
-A3 |
377.0833 |
|
21 |
(2021,21) |
324 |
AZc- |
-A3 |
377.0833 |
|
22 |
(2021,22) |
393 |
ABc- |
-A2 |
377.0833 |
Fig. 10. Forecasting results of the Fuzzy Time Series Model Chen method
Figure 10 shows the forecasting results of Galah Coffee Sales using the singh model fuzzy time series method. In Figure 10 there is an image of actual data and fuzzy calculations where the actual value symbolized by A is
defuzzified to become a forecast value. So, from this process the results of forecasting using this method have been obtained.
$accuracy
ME MAE MPE MAPE MSE RMSE U
Chen 0.134 57.952 -2.078 12.574 4939.505 70.281 0.4S79637
Fig. 11. The level of accuracy of the Fuzzy Time Series
Model Chen Method
Absolute Error), MAPE (Mean Absolute Percent Error). The results of this study indicate that the method model that has the smallest accuracy value is the Fuzzy Time Series Singh model for the coffee category with MSE values of 901,917, MAE 27,715 and MAPE 6,115, using the Fuzzy time series Chen model with MSE values of 4939,505, MAE 57,952 and MAPE 12,574. So that the model method that has the smallest accuracy is the fuzzy time series Singh. The research results can be seen in table IV.
The following is the result of the error rate, which in this study uses the Mean Squared Error (MSE), Mean Absolute Error (MAE), Mean Absolute Percent Error (MAPE). as a method of testing the level of accuracy in Figure 11.
In the next process, Figure 12 is the result of a comparative data plot from the results of forecasting using the Fuzzy time series Singh and Chen. It can be seen that the Singh model produces higher accuracy compared to Chen because the forecast data is close to the actual data.
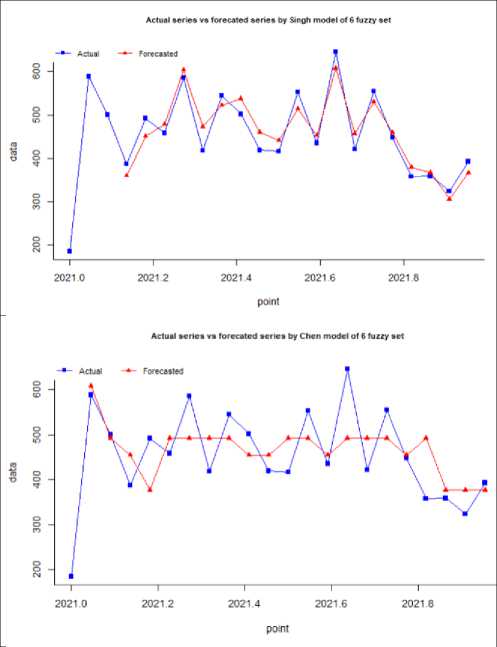
Fig. 12. Comparison of Actual Data Plots and Chen Model Forecasting Results
-
D. Comparison of MSE, MAE, MAPE Fuzzy Time Series Values of the Singh Model and the Chen Model.
From the calculation results of the Fuzzy Time Series method of the Singh model with the Fuzzy Time Series Model of Chen, a comparison result is obtained from the calculation of MSE (Mean Squared Error), MAE (Mean
TABLE IV
Comparison of MSE, MAE, and MAPE Values.
|
Comparison FTS Model FTS Model of Error Category Singh Chen Value | |||
|
MSE |
Coffee |
901.917 |
4939.505 |
|
Non-Coffee |
3249.019 |
23536.2 | |
|
Food |
1286.453 |
11602.87 | |
|
Snack |
1285.114 |
14175.61 | |
|
MAE |
Coffee |
901.917 |
4939.505 |
|
Non-Coffee |
3249.019 |
23536.2 | |
|
Food |
1286.453 |
11602.87 | |
|
Snack |
1285.114 |
14175.61 | |
|
MAPE |
Coffee |
901.917 |
4939.505 |
|
Non-Coffee |
3249.019 |
23536.2 | |
|
Food |
1286.453 |
11602.87 | |
|
Snack |
1285.114 |
14175.61 | |
-
V. CONCLUSION
Based on the existing data, forecasting calculations have been carried out using the Fuzzy Time Series method, the Singh model, and the Fuzzy Time Series Chen model, and the accuracy value of the method and each model has been calculated, the results are as follows:
-
1) The results of the calculation of the coffee category product using the fuzzy time series method of the Singh 22 model show MSE values of 901,917, MAE 27,715 and MAPE 6,115, with the fuzzy time series method the Chen 22 model monthly show MSE values of 4939,505, MAE 57,952 and MAPE 12,574. So, the best method for forecasting coffee category products is the Singh fuzzy time series method because it has the smallest accuracy value.
-
2) The results of the calculation of non-coffee category products using the Singh 22 fuzzy time series model show MSE values of 3249.019, MAE 50.177 and MAPE 6.96, using the Chen 22 fuzzy time series model method show MSE values of 23536.2, MAE 125.904 and MAPE 19.00. So, the best method for forecasting non-coffee category products is the Singh fuzzy time
series method because it has the smallest accuracy value.
-
3) The calculation results for food category products using the Singh fuzzy time series model show MSE values of 1286.453, MAE 32.187 and MAPE 8.211, with the Chen 22 fuzzy time series model methods showing MSE values of 11602.87, MAE 81.119 and MAPE 27.026. So, the best method for forecasting food category products is the Singh fuzzy time series method because it has the smallest accuracy value.
-
4) And the results of the calculation of the snack category product with the Singh 22 fuzzy time series model method show MSE values of 1285,114, MAE 30,845 and MAPE 41,967, with the Chen 22 fuzzy time series model method showing MSE values of 14175.61, MAE 98,273 and MAPE 103.45. so, the best method for forecasting food category products is the fuzzy time series Singh method because it has the smallest accuracy value.
-
5) The results of the four calculations show that the 22-month Fuzzy Time Series Singh method has a lower level of accuracy (error) so that it can be used as a reference for further sales calculations.
REFERENCES
-
[1] S. Alfarisi, “Sistem Prediksi Penjualan Gamis Toko QITAZ Menggunakan Metode Single Exponential Smoothing,” JABE (Journal Appl. Bus. Econ., vol. 4, no. 1, p. 80, 2017, doi: 10.30998/jabe.v4i1.1908.
-
[2] S. S. Beruru and E. Sediyono, “Peramalan Penjualan Dengan Metode Fuzzy Time Series Haneen Talal Jasim,” in Seminar Nasional Sains dan Aplikasi Komputasi (SENSAKOM), 2013, pp. 43–48.
-
[3] A. Latifudin, D. Suryani, and R. Wakhidah, “Peramalan Jumlah Pengunjung Wisatawan Mancanegara Menggunakan Metode Fuzzy Time Series Di Jawa Timur,” J. Inform. Polinema, vol. 8, no. 2, pp. 43–48, 2022, doi: 10.33795/jip.v8i2.525.
-
[4] Fendi Nurcahyono, “Pembangunan Aplikasi Penjualan Dan Stok Barang Pada Toko Nuansa Elektronik Pacitan,” J. Speed - Sentra Penelit. Eng. dan Edukasi, vol. 4, no. 3, pp. 15–19, 2012.
-
[5] M. Nor Hayati and dan Sri Wahyuningsih, “Peramalan Menggunakan Metode Fuzzy Time Series Cheng Forecasting Using Fuzzy Time Series Cheng Method,” J. EKSPONENSIAL, vol. 8, no. 1, pp. 51–56, 2017.
-
[6] S. Sari and D. Jannati, “Analisis Perancangan Kebutuhan Kopi Best Seller Untuk Memenuhi Permintaan Di Cafe Kopi Titik Dengan Menggunakan Metode Peramalan,” Bina Tek., vol. 17, no. 1, p. 9, 2021, doi: 10.54378/bt.v17i1.2729.
-
[7] M. R. Kurniawan, J. Dedy Irawan, and F. Santi Wahyuni, “Forecasting Penjualan Kopi Dengan Metode Exponential Smoothing Berbasis Web (Studi Kasus Kedai Psycoffee),” JATI (Jurnal Mhs. Tek. Inform., vol. 5, no. 2, pp. 517–525, 2021, doi:
10.36040/jati.v5i2.3739.
-
[8] N. Hafiyya, F. Virgantari, and M. Widyastiti, “Implementasi Metode Fuzzy Time Series Pada Peramalan Harga Emas Di Indonesia,” INTERVAL J. Ilm. Mat., vol. 2, no. 2, pp. 94–103, 2022, [Online]. Available: https://harga-emas.org/.
-
[9] C. P. Yanti, N. L. W. S. R. Ginantra, D. A. P. Wulandari, and N. P. A. I. Paramita, “Komparasi Metode Single Moving Average dan Double Exponential Smoothing untuk Peramalan Penjualan Produk Gerabah pada UD. Amerta Sedana,” JURIKOM (Jurnal Riset Komputer), vol. 9, no. 3. p. 536, 2022, doi: 10.30865/jurikom.v9i3.4143.
-
[10] D. A. Fyanda, M. Ula, and A. Asrianda, “Implementasi Fuzzy Time Series Pada Peramalan Penjualan Tabung Gas Lpg Di Ud. Samudera Lpg Lhokseumawe,” Sisfo J. Ilm. Sist. Inf., vol. 1, no. 1, pp. 1–25, 2017, doi: 10.29103/sisfo.v1i1.249.
-
[11] F. Rachim, T. Tarno, and S. Sugito, “Perbandingan Fuzzy Time Series Dengan Metode Chen Dan Metode S. R. Singh (Studi Kasus: Nilai Impor di Jawa Tengah Periode Januari 2014 – Desember 2019),” J. Gaussian, vol. 9, no. 3, pp. 306–315, 2020, doi: 10.14710/j.gauss.v9i3.28912.
Discussion and feedback