SPECTROPHOTOMETRIC DETERMINATION OF BORON IN FOOD PRODUCTS BY ESTER BORATE DISTILLATION INTO CURCUMIN
on
JURNAL KIMIA (JOURNAL OF CHEMISTRY) 15 (1), JANUARI 2021 DOI: https://doi.org/10.24843/JCHEM.2021.v15.i01.p10
p-ISSN 1907-9850
e-ISSN 2599-2740
SPECTROPHOTOMETRIC DETERMINATION OF BORON IN FOOD PRODUCTS BY ESTER BORATE DISTILLATION INTO CURCUMIN
R. E. Y. Adu 1*, R. Roto1 and A. Kuncaka2
1Faculty of Agriculture, Universitas Timor, Kefamenanu, Indonesia
2 Faculty of Mathematics and Natural Sciences, Universitas Gadjah Mada, Yogyakarta, Indonesia
*Email: adoe.risna@yahoo.com
ABSTRACT
Spectrophotometric determination of boron in food products by ester borate distillation into curcumin solution was studied. Boron was separated as triethyl borate by distillation in a vessel using ethanol solvent and it was reacted with curcumin solution. Triethyl borate was generated at proper temperature, time and pH to improve the sensitivity of curcumin method. Distillation system reached optimum condition at a temperature of 75oC and pH 5-6. Boron-curcumin complex was measured at 555 nm after 10 minutes of reaction. Separation of boron by distillation method complied with validation parameters. The standard curve was linier at a concentration range of 1.2-4.8 ppm (R2=0.9995) and had a molar extinction value (ε) of 4.7 x 10⁵ L mol-1 cm-1 for the high sensitivity level which is higher than the previous study. Percent recovery was found to be 96.09-104.92 %. Boron content in meatball and tofu products was in the range of 1.406-3.589and 0.010-1.085mg/kg. Ester borate distillation into curcumin solution has been successfully applied to determination of boron in food products because of its high sensitivity.
Keywords: boron, curcumin, distillation, ester borate, UV-Vis spectrophotometry
ABSTRAK
Penentuan boron secara spektrofotometri di dalam produk makanan melalui distilasi ester borat ke dalam larutan kurkumin telah dipelajari. Sensitivitas metode kurkumin dapat ditingkatkan melalui pembentukan ester borat pada suhu, waktu, dan pH yang tepat. Boron dipisahkan sebagai trietil borat melalui distilasi dalam wadah Teflon menggunakan pelarut etanol dan direaksikan dengan curcumin. Sistem distilasi mencapai kondisi optimal pada suhu 75oC dan pH 5-6. Kompleks boron-kurkumin diukur pada panjang gelombang 555 nm setelah 10 menit reaksi. Pemisahan boron dengan metode distilasi memenuhi parameter validasi. Kurva standar linier pada kisaran konsentrasi 1,2-4,8 ppm (R2= 0,9995) dan memiliki nilai absorptivitas molar (ε) 4,7x 10⁵ L mol-1 cm-1 untuk kategori sensitivitas tinggi dimana bernilai lebih tinggi daripada penelitian sebelumnya. Persen perolehan kembali berada pada rentang 96,09-104,92%. Kandungan boron dalam produk bakso dan tahu secara berturut-turut adalah 1,406-3,589 dan 0,010-1,085 mg/kg. Distilasi ester borat ke dalam kurkumin telah berhasil diterapkan pada penentuan boron dalam produk makanan karena sensitivitasnya yang tinggi.
Kata Kunci: boron, destilasi, ester borat, kurkumin, UV-Vis spektrofotometri
INTRODUCTION
One of the essential micronutrients for organisms is boron. However, boron excess or deficiency adversely affects reproductive function of living organisms (Farhat et al., 2013). Boron in the form of boric acid is often used as a food preservative. The addition of this preservative to food products has increased along with technological advances in the production of synthetic food additives. It causes the additives consumption by each person also has increased. The use of certain
additives that can cause chronic health problems is prohibited by the government. Minister of Health Regulation No. 33 of 2012 concerning Food Additives states that one of the banned materials used as food additives is boric acid and its derivatives.
Boric acid and its compounds are prohibited substances for food due to their toxic potential on human health. Thus, the existence of such materials in food products need to be controlled. Boric acid in food products is more easily monitored using sensitive, inexpensive and practical analysis
methods. Spectrophotometry is a practical and sensitive analytical technique to be used in routine boron analysis. Spectrophotometric analysis of boron is based on specific reactions between boron and organic dyes such as curcumin. Curcumin is commonly used as a reagent for boron determination by spectrophotometric method because of its reliability, sensitivity and stability (Pena-Pereira et al., 2020) and provides a better recovery for boric acid analysis in food samples compared to carminic acid (Siti-Mizura et al., 1991). Various parameters studied have shown that the curcumin method was superior to the carminic acid. The implementation of curcumin as a colorimetric reagent in analytical methods has been recommended in terms of green analytical chemistry (Lavilla et al., 2014). Boron determination using curcumin requires only a small amount of food sample (0.5 g) for good reproducibility and recovery. Colorimetric methods involving curcumin are usually based on the formation of rosocyanine, a 1:2 spiroborate ester from a natural antioxidant present in Curcuma longa L (Pena-Pereira et al., 2020). In the presence of oxalic acid, boron and curcumin can form a red solution containing the rubrocurcumin complex (Spicer and Strickland, 1958).
The presence of interferences in matrix samples requires several separation methods that can selectively isolate boron from sample matrix. Distillation is the most commonly methods used in separation of boron by generating ester borate, because alkyl borate production is more easily controlled and more stable against the moisture(Castillo et al., 1985a). Boron is converted into volatile alkyl borate [B(OCnH2n+1)3] by reacting boric acid with alcohol. Conventional boron distillation has been widely used, but it has major disadvantages i.e. less sensitive and efficient due to the tedious sample treatment procedures and use of large quantity of methanol (Spicer and Strickland, 1958), interference of ions such as Na, K and Li, and the need of complicated quartz design (Castillo et al., 1985). An in-situ matrix distillation system was developed for boron analysis using UV-Vis spectrophotometry. Thangavel et al. (2004) successfully distilled borate esters from various sample matrices (water, boron powder, uranyl nitrate and uranium oxide) into curcumin solution using methanol as the
sample solvent, followed by determination of boron concentration by spectrophotometry. However, the efficiency study of the distillation system was limited to the influence of water content, pH and several matrixes interferences.
In the present study we developed the Thangavel protocol to overcome distillation system efficiency problems. Several key factors (reaction lifetime, temperature and pH), all of which are critical factors in forming triethyl borate, were optimized. We consequently present a set of modifications that yield more sensitive and selective measurements of boron content. The proposed method was applied to determine boron content in tofu and meatballs.
MATERIAL AND METHOD
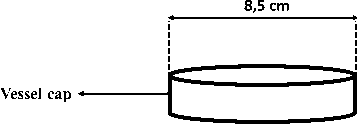
Reagent vessel (outer)
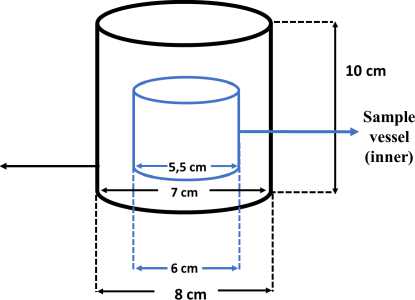
Figure 1. Distillation Chamber
Materials
The reagents were of analytical grades, i.e. curcumin, acetone, ethanol, boric acid, acetic acid, and oxalic acid (Merck).
Instrumentation
UV-Vis spectrophotometer (Spectronic 200) was employed to determine boron-curcumin absorbance. pH meter and thermometer were used to measure optimum pH and temperature respectively. Teflon vessel was used as a distillation chamber (Figure 1).
Procedure
Determination of Wavelength
Two ppm of H3BO3 was poured into the inner vessel, then the prepared 10 mL curcumin was added into the outer vessel. The outer distillation vessel was tightly closed and kept at room temperature for 24 hours. The inner vessel was removed by unscrewing the cap. Curcumin solution was heated in a water bath at +80oC until it dried completely, then it was dissolved in acetone and analyzed using UV-Vis spectrophotometer at wavelength of 450-650 nm against the blank after 10 minutes reaction.
The effect of distillation temperature
100 mg boric acid was distilled according to the previous procedure for optimization of the boron-curcumin wavelength complex. Variations were carried out at distillation temperatures of 25, 35, 45, 55, 65, 75 and 85oC for 4 hours. Distillation result was diluted with acetone in a 25 mL volumetric flask and absorbance was measured by UV-Vis Spectrophotometer at maximum wavelength and optimum time of complex formation to blanks.
The effect of distillation time and pH solution
100 mg boric acid was distilled according to the previous procedure. Evaluation of pH effect of boric acid solution was conducted under the pH of 4, 5, 6, 7, 8, 9 and 10. Meanwhile the effect of time on the reaction between boric acid and curcumin was studied over a time period of 6, 12, 24, 48 and 72 hours.
Boron analysis in food products
A 10 g sample was distilled under the obtained optimum conditions as described above. The distillate was diluted in acetone and analyzed using a UV-Vis spectrophotometer.
RESULT AND DISCUSSION
Wavelength of Boron-Curcumin Complex
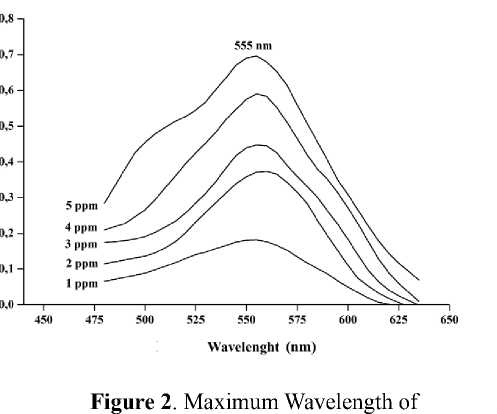
The wavelength value providing maximum absorbance was achieved by measuring boron-curcumin standard solution at a wavelength of 450-650 nm using 1 cm thick of cuvette. The maximum wavelength is
determined by plotting an absorbance curve (A) to the wavelength (λ) of boron-curcumin solution. Absorbance spectra of curcumin solution in acetone and boron-curcumin is displayed in Figure 2. It shows that curcumin in acetone has maximum absorption at a wavelength of 419 nm. While boron-curcumin complex has an optimum absorbance at 555 nm. The obtained wavelength of boron-curcumin is close to the maximum wavelength of 555 nm (Mohan and Jones, 2018), 550 nm (Ramanjaneyulu et al., 2008) and 543 nm(Liu & Lee, 2009b).
Boron-Curcumin
Evaluation of Distillation System
The sensitivity of spectrophotometric boron measurement through borate ester distillation is influenced by the conversion rate of the borate ester and distillation system. The higher the borate esters conversion rate, the more sensitive the measurement method. There are several key factors that can be evaluated to generate high yield of borate ester like temperature, time and pH. We evaluated the effect of reaction temperature between boric acid and alcohol over the temperature of 25, 35, 45, 55, 65, 75 and 85oC.
Absorbance value of boron-curcumin complex increased rapidly and reached a maximum absorbance at temperature of 75oC. At this temperature, ethanol vapor pressure (boiling point 78.29 oC) and ethyl borate (boiling point 118 o C) were 665.17 and 172.51 mmHg. It shows that in this condition, the boiling point of ethyl borate was not reached but the volatilization of ethyl borate into curcumin solution still occurs due to the high pressure of
ethyl borate vapor at this temperature. This reaction temperature is significantly higher than 50°C as proposed by Kumamaru et al. (1986), who generate methyl borate for boron analysis using ICP-AES. Distillation for 4 hours at temperatures 25, 35, 45, 55, 65, 75 and 85oC gave absorbance values of 0.298, 0.334, 0.361, 0.427, 0.441, 0.468 and 0.209 respectively.
Absorbance
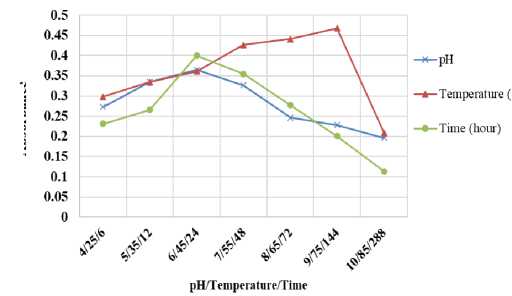
Figure 3. The Effect of pH, Time and Temperature to Distillation System
The distillation system at temperature of 85 oC resulted in the lowest absorbance value among other lower temperatures because of the ethanol vaporization at its boiling point before it reacted with boric acid completely.
The other parameters of the distillation system that can affect borate esters conversion rate are reaction time between boric acid and ethanol at 25oC and pH of sample solution. The results after observing the effect of those parameters are displayed in Figure 3. Absorbance values of 0.231, 0.266, 0.400, 0.354 and 0.277 were achieved when conducting reaction time for 6, 12, 24, 48 and 72 hours. Reaction between boric acid and alcohol reached a maximum within 24 hours. A decrease of absorbance value was observed at distillation time of 48 and 72 hours due to the poor stability of boron-curcumin complex. Boron-curcumin stability is quickly reduced by atmospheric moisture of the outer vessel. pH evaluation prior to the distillation process was carried out in the pH range of 4-10. An increase of absorbance value at pH 4-6 was observed, whereas at pH 7 to 10 absorbance value decreased. The optimum absorbance is reached at pH values near neutral (pH 6). Distillation process with pH value close to neutral will prevent the fluoroborate and alkali borate formation that can reduce the quantity
of ethyl borate thus the method sensitivity becomes lower.
Conversion of ethyl borate at pH7 causes ethyl borate hydrolyzed into boric acids and ethanol that can inhibit quantitative distillation of ethyl borate into curcumin. Sample solution with highly acidic pH (<5) can oxidize curcumin, while sample solution with pH greater than 7 can prevent the distillation of ethyl borates due to the formation of strong alkaline borates and precipitation of metal hydroxides (Thangavel et al., 2004).
Validation of Boron Analysis Methods
The UV-Vis spectrophotometer response was calibrated against a set of six standard solutions of known boron concentration
displayed in Figure 4.
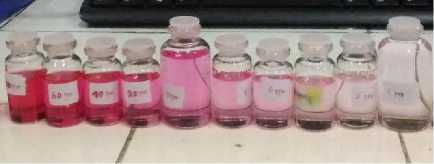
Figure 4. Boron Standard Solution
The correlation between absorbance and boron concentration was determined by using boron concentration of 1.2, 1.8, 3, 3.6, 4.2 and 4.8 ppm.
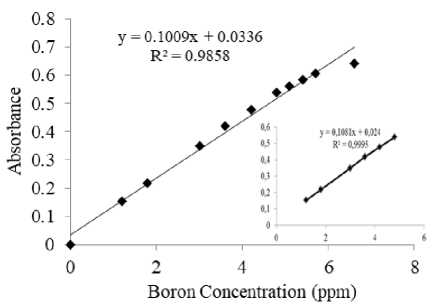
Figure 5. Calibration Curve of Boron-Curcumin Complex
Figure 4 depicts a good linear correlation coefficient (R2=0.9995) and a linear equation, y = 0.1081x + 0.024, where x is concentration (mg L-1) of boron and y is for absorbance. Based on the achieved correlation coefficient (R2), the equation can be categorized as a good linear regression equation (R2≥ 0.997)
(Harsojo, 2012). This indicated that boron analysis can be conducted at the boron concentration range of 1.2- 4.8 ppm.
Molar absorptivity value is 4.7x10⁵ Lmol-1cm-1. The obtained molar absorptivity was higher than that of previous study using methanol for uncatalyzed esterification (0,8x10⁵ L mol-1cm-1) (Thangavel et al., 2004). This value was at a high sensitivity level according to Savin (1979), namely ε>6 x 10⁴ L mol-1 cm-1. The molar extension value in the present study showed that boron analysis by spectrophotometry through the distillation of borate esters into curcumin was more sensitive than the undeveloped method. Borate esters generated at a temperature of 75oC with solution nearly neutral pH within 24 hours is preferable for spectrophotometric boron analysis.
The accuracy of the present protocol is expressed as % recovery and analyzed by spiking methods. A 100 mg boric acid standard was added to each of the test samples that had been previously analyzed. Table 1 presents a good agreement between measured boron concentrations and those calculated from the test samples. An acceptable % recovery is ranging from 96.09-104.62%.
Table 1. Recovery of Analytical Method
|
[B] added (mg/L) |
[B] found (mg/L) |
% Recovery |
|
586.44 |
616.10 |
104.62 |
|
588.78 |
603.45 |
102.27 |
|
592.48 |
593.28 |
99.98 |
|
588.78 |
573.85 |
97.42 |
|
592.12 |
569.53 |
96.09 |
|
588.01 |
569.53 |
96.76 |
This recovery rate is acceptable because it corresponds to the analyte concentration level as proposed by González et al.(2010) and Harmita (2004), who stated that the acceptable % recovery for sample matrix with 0.001<[A]≤ 0.1% 0. 001 < μ]≤ 0.1 (%) is 90-107%.
Boron Analysis in Food Products
Analysis of boron by UV-Vis spectrophotometry through the ethyl borate distillation into curcumin was performed on food products like meatballs and tofu. A total of 30 unwashed food samples from five food groups have been analyzed for boron content.
Boron content in food products is depicted in Figure 6. The concentration range of boron in meatballs and tofu is 1.406-3.589 and 0.010-1.085 mg/kg respectively. Boron content in meatballs was higher than that of tofu. It proves that borax and boric acid are generally used as additives in starch-containing foods (Kabay et al., 2015).
Boron content of those products indicates that boric acid and borates compounds may still be added to meat balls products although in relatively small concentrations. Boron can occur naturally in food as borate (B4O72-) or boric acid, so it cannot be concluded that the boron content in those food products is completely donated by boron preservatives. Concentration of boron in food products varies considerably according to type and source of food. The richest sources of boron include fruits, leafy vegetables, legumes, and nuts. Dairy products, fish, meats, and most grains are poor sources, therefore individual food preference greatly influences daily intake of boron (Naghi et al., 1996). Daily intake of boron usually differs considerably between any two individuals because of those reasons. The greatest boron exposure comes from oral intake of food, mainly fruits and vegetables. The World Health Organization (WHO) has estimated the average daily intake of the population is about 1.2 mg boron from diet, which falls well within the safe range of population mean intakes for adults (1.0-13 mg boron/day).
Boron doses that are greater than permissible boron level can cause many problems. Long-term consumption of water and food containing high boron content results in problems with cardiovascular, coronary, nervous and reproductive systems. Excess of boron can cause changes in blood composition, neurological effects, physical disorders and intellectual development of children, and can be particularly dangerous for pregnant women. Boron content greater than 500 mg/day may cause vomiting, and diarrhea, anorexia or weight loss, even though it has been reported that boron has a positive effect on functioning of many organs (Wolska and Bryjak, 2013).
CONCLUSION
Distillation method of borate ester produced into curcumin solution is suitable for
routine analysis of boron in food products. Borate esters generated at temperature of 75oC with solution nearly neutral pH within 24 hours is preferable for spectrophotometric analysis of boron.
The sensitivity of boron analysis can be improved through this proposed method and has a high sensitivity level with molar extinction value (ε) of 4.7 x 10⁵ L mol-1cm-1. Boron content in meatball and tofu products is in the range of 1.406-3.589 and 0.010-1.085 mg/kg respectively.
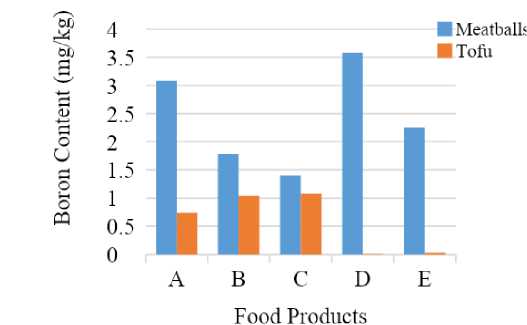
Figure 6. Boron Content in Food Products
REFERENCES
Castillo, J. R., Mir, J. M., Martinez, C. & Bendicho, C. 1985a. Determination of boron in waters by using methyl borate generation and flame atomic-emission spectrometry. The Analyst, 110(12): 1435.
Castillo, J. R., Mir, J. M., Martinez, C. & Bendicho, C. 1985b. Determination of Boron in Waters by Using Methyl Borate Generation and Flame Atomic-emission Spectrometry. 110(December): 1435–1438.
Farhat, A., Ahmad, F., and Arafat, H. 2013. Analytical techniques for boron quantification supporting desalination processes: A review. Desalination, 310, 9-17.
González, A. G., Herrador, M. Á. & Asuero, A. G. 2010. Intra-laboratory assessment of method accuracy (trueness and precision) by using validation standards. Talanta, 82(5): 1995–1998.
Harmita, H. 2004. Petunjuk Pelaksanaan Validasi Metode dan Cara
Perhitungannya. Majalah Ilmu Kefarmasian, 1(3): 117–135.
Harsojo. 2012. Analisis Makanan dan Lingkungan Secara Fisika Kimia. Pustaka Pelajar: Yogyakarta
Kabay, N., Bryjak, M. & Hilal, N. 2015. Boron separation processes. Amsterdam: Elsevier.
Kumamaru, T., Matsuo, H., Okamoto, Y., Yamamoto, M. & Yamamoto, Y. 1986. Inductively-coupled Plasma Atomic Emission Spectrometric determination of boron based on generation of methyl borate. Analytica Chimica Acta, 186: 267–272.
Lavilla, I., Romero, V., Costas, I. and Bendicho, C., 2014. Greener
derivatization in analytical chemistry. Trends in Analytical Chemistry, (61):1-10.
Liu, Y. & Lee, K. 2009a. Modifications of the curcumin method enabling precise and accurate measurement of seawater boron concentration. Marine Chemistry, 115(1–2): 110–117.
Liu, Y.-M. & Lee, K. 2009b. Modifications of the curcumin method enabling precise and accurate measurement of seawater boron concentration. Marine Chemistry, 115(1–2): 110–117.
Mohan, T. C. and Jones, A. M. E., 2018. Determination of Boron Content Using a Simple and Rapid Miniaturized Curcumin Assay. Bio Protoc.; 8(2).
Naghii, M. R., Wall, P. M. L. dan Saman, S., 1996, The Boron Content of Selected Food and The Estimation of Its Daily Intake Among Free -Living Subjects, J Am Coll Nutr, 15, 614-619.
Pena-Pereira, F., Velázquez, A., Lavilla, I., and Bendicho, C. 2020. A Paper-Based Colorimetric Assay with non-Instrumental Detection for Determination of Boron in Water Samples. Talanta. (208): 120365.
Ramanjaneyulu, P. S., Sayi, Y. S. & Ramakumar, K. L. 2008. Determination of boron in uranium–aluminum–silicon alloy by spectrophotometry and estimation of expanded uncertainty in measurement. Journal of Nuclear Materials, 378(2): 139–143.
Spicer, G. S. and Strickldan, J. D. H. 1939. Sficer and Strickland: The Structure of Rubrocurcurnin. I9521. (4650):
4650–4653.
Savin, S. B., 1979, Fundamental of Analytical Chemistry, Crit. Rev. Anal. Chem., 8, 55.
Siti-Mizura, S., Tee, E. S. & Ooi, H. E. 1991. Determination of boric acid in foods: Comparative study of three methods. Journal of the Science of Food and Agriculture, 55(2): 261–268.
Spicer, G. S. dan Strickldan, J. D. H., 1958, The Determination of Microgam and Sub-Microgam Amounts of Boron,
Part 1: Absorptiometric Determination using Curcumin, Anal. Chim. Acta, 18, 523-533.
Thangavel, S., Dhavile, S.M., Dash, K. & Chaurasia,S.C. 2004.
Spectrophotometric determination of boron in complex matrices by isothermal distillation of borate ester into curcumin. Analytica Chimica Acta, 502(2): 265–270.
Wolska, J. and Bryjak, M., 2013. Methods for boron removal from aqueous solutions — A review. Desalination, 310: 18-24.
73
Discussion and feedback