MAPPING OF OLDEMAN AGRO-CLIMATIC ZONE BASED ON CLIMATE HAZARDS GROUP INFRARED PRECIPITATION WITH STATION DATABASE IN SOUTHEAST SULAWESI
on
Mapping of Oldeman Agro-Climatic Zone...,
[Septianto Aldiansyah, dkk]
Mapping of Oldeman Agro-Climatic Zone Based on Climate Hazards Group Infrared Precipitation with Station Database in Southeast Sulawesi
Septianto Aldiansyah1*), Risna2)
1)Department of Geography, Faculty of Mathematics and Natural Sciences, Universitas Indonesia
2)Department of Microbiology, Faculty of Mathematics and Natural Sciences, Institut Pertanian Bogor
*Email: septiantoaldiansyah863@gmail.com
ABSTRACT
Long climate data information will be very useful for the sustainable agricultural sector in determining physiological processes, growth to plant productivity. The Climate Hazard Group Infrared Precipitation with Station (CHIRPS) data is used as a rainfall database for the latest Oldeman agro-climatic zone mapping in Southeast Sulawesi Province. CHIRPS data for 1981-2021 was processed using the Inverse Distance Weighted and Overlay interpolation methods through the Geographic Information System. The results showed that there were thirteen Oldeman agro-climatic zones in Southeast Sulawesi Province, namely B1 (23,71%), B2 (1,97%), B3 (0,22%), C1 (13,48%), C2 (23,21%), C3 (4,64%), D1 (7,36%), D2 (16,71%), D3 (1,28%), D4 (0,00%), E1 (2,92%), E2 (2,32%), dan E3 (2,18%). Zones B1, B2, and B3 are in the northwest, east, and southeast of the area which are very suitable for cultivating two paddy crops followed by planting various types of secondary crops (palawija) during the dry season. Zones C1, C2, and C3 which stretch from west to east are suitable for onetime planting of paddy and two crops of palawija crops. Zones D1, D2, D3, and D4 are spread from the northwest to the southwest to most areas of Muna Island and Buton Island which are suitable for one short-lived paddy planting and one paddy or palawija crop. The agro-climatic zones E (E1, E2, and E3) in the northwest and southwest are only suitable for one crop of palawija crop, depending on rain. The resulting agroclimate map can be used as a reference for cropping patterns that are suitable for the region of Southeast Sulawesi Province.
Keywords: Agro-Climatic; CHIRPS; Oldeman; Southeast Sulawesi
et al., 2018). Therefore, climate information, especially climate classification, is needed to help the agricultural sector, especially in every region of a largely agricultural country like Indonesia (Paski et al., 2017).
One type of climate classification that is suitable for the agricultural sector is the Oldeman method because it can help determine the planting period (Nasution & Nuh, 2018). This climate classification is based on the needs of agricultural crops,
namely paddy and palawija crops, relying on rainfall as the main influencing factor (Wredaningrum & Sudibyakto, 2014). Paddy is a food that produces rice which is a staple food for the majority of the Indonesian population. Meanwhile, Palawija crops are annual crops on dry land. Palawija means secondary crop and is a second crop besides rice. The term palawija crops developed among farmers to refer to types of crops other than paddy (Suparman, 2007). In this method, rainfall data becomes very important as the main parameter for making Oldeman classification climate information in a region.
Rainfall data were collected through weather and climate observation stations scattered in various regions by the Indonesia Meteorology, Climatology, and Geophysics Agency (BMKG, 2021). However, the data generated in several regions still have a very low level of spatial representation because the number of weather observation stations does not cover the area of observation (Paski et al., 2017; Bidiyono & Faisol, 2021). In addition, not all stations make observations with a duration of more than 30 years, so it is necessary to use other rain data in making climate classification information for better results (Paski et al., 2017).
Southeast Sulawesi Province has an area of 38,068 km² (BPS, 2022). Referring to the recommendations of the World Meteorological Organization (2014) regarding the coverage of observation sites, namely 1:100-1000 km2, Southeast Sulawesi Province does not have enough climate and weather observation stations that are ideal with only 4 main Technical implementation Unit stations (BMKG, 2021). The Technical Implementation Unit is a Station that has the duties and function of conducting upper-air meteorological observations.
Climate Hazards Group Infrared Precipitation With Station (CHIRPS) is global rain data generated from a combination of satellite recordings, rain station observations, and rainfall predictors (Funk et al., 2014). CHIRPS provides rainfall data from 1981 to the present with a duration of 5 days, 10 days, 1 month, 2 months, and 3 months with a spatial resolution of 5 km (Funk et al., 2014). CHIRPS data has good accuracy in estimating rainfall so it is suitable for use as an alternative to rain data due to the limitations of existing weather and climate observation stations in various regions in Indonesia (Faisol et al., 2020; Budiyono & Faisol, 2021).
On this basis and the need to update climate information due to global warming (As-syakur et al., 2010), this study aims to map the Oldeman agro-climatic zone in Southeast Sulawesi Province using CHIRPS data. The resulting agro-climatic map can describe the latest (current) climatic conditions of the regions in Southeast Sulawesi Province and their relation to agricultural crops suitable for cultivation. The agroclimate map can also be used as a reference in giving directions on appropriate cropping patterns for each region in the Southeast Sulawesi Province.
This research was conducted in Southeast Sulawesi Province which is located in the Southeastern Peninsula of Sulawesi Island. Geographically, Southeast Sulawesi is located at 02°45' – 06°15' S and 120°45' – 124°30' E with an area of 37.421 km2. Southeast Sulawesi Province has 15 Regencies and 2 Cities. Study area research can be seen in Figure 1.
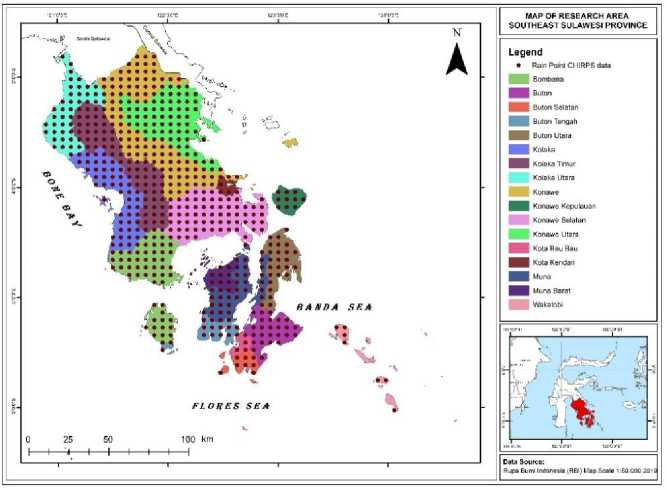
Figure 1.
Study Area
Oldeman agro-climatic zone mapping is based on CHIRPS monthly rainfall data with a spatial resolution of 0.05o. CHIRPS data is a quasi-global rainfall dataset spanning 50oS-50oN (including all longitudes) that builds on previous approaches to 'smart' interpolation techniques and high-resolution, long-term rainfall record estimates based on infrared Cold Cloud Duration (CCD) observation. CHIRPS data can be downloaded at the University of California, Santa Barbara website or the following URL: https://data.chc.ucsb.edu/. CHIRPS data show excellent performance for measuring the hydrological impacts of reduced rainfall and increased air temperature. Global and regional validation results demonstrate the effectiveness of CHIRPS in hydrological forecasting and trend analysis (Funk et al., 2014). CHIRPS data can be used to map agro-climatic zones in an area (Haftom et al., 2019; Faisol et al., 2022). Apart from excellent effectiveness. This data was chosen because it has a better resolution than other rain data such
as Global Satellite Mapping of Precipitation/GSMaP (10 km2), Global Precipitation Measurement/GMP (10 km2), Tropical Rainfall Measuring Mission/TRMM (30 km2), and NASA Power (50 km2). The CHIRPS data used is data for the last 4 decades from 1981 to 2021 because it can describe climate patterns or regularity as required by Oldeman (1980). In addition to the CHIRPS data, regional administrative data for the province of Southeast Sulawesi were also used in this study. Southeast Sulawesi provincial administrative data can be downloaded on the official Indonesia Geospatial Portal website with the following URL: https://tanahair.indonesia.go.id/.
The CHIRPS rain data in the form of raster data is extracted into point data using Geographic Information System (GIS) software. The processed CHIRPS data is in the form of 576 rain points data spread over the study area. The rainfall data represents the average monthly rainfall for 4 decades. Then, The data is
analyzed by interpolation and overlay methods. The rain point data is interpolated using the Inverse Distance Weighted (IDW) method. It is used to figure out how much a site that hasn't been assessed is worth by comparing it to the values of sites nearby (Fiannacca et al., 2017). IDW can estimate the value of rainfall in areas that are between raindrop data. IDW is used because it has good accuracy to provide the closest value to the sample data (Pramono, 2008; Arif, 2019). The interpolated data are classified based on the terms of the wet and dry months used in the Oldeman classification
method. IDW is calculated using the
following equation:
∑ι=ιzi․djn
=∑i=ι d[
where:
1)
Zq : The value that is currently expected to be linked with the variable z. I.
zi : The value that the sample at point i represents is denoted by zi .
di : The distance between the sample location and the estimate.
N : distance and weight coefficient
Oldeman's climate classification is based on the amount of water needed by plants, especially paddy and palawija crops (Dwiyono, 2009). In the Oldeman classification, the classification of climate types for each zone (Table 1) and climate interpretation (Table 2) are used as guidelines for determining climate types and their interpretations. The arrangement of the climate type is based on the number of consecutive wet months. Categories for wet months (if the average rainfall is more than 200 mm), moist months (if the average rainfall is 100 – 200 mm), and dry months (if the average rainfall is less than 100 mm) (Bayong, 2004).
Table 1. Oldeman Climate Classification Determination
|
Zone |
Wet Month (Rf > 200 mm) |
Sub-Zone |
Dry Month (Rf < 100 mm) |
|
A |
>9 Months |
1 |
< 2 Months |
|
B |
7-9 Months |
2 |
2-3 Months |
|
C |
5-6 Months |
3 |
4-6 Months |
|
D |
3-4 Months |
4 |
7-9 Months |
|
E |
< 3 Months |
5 |
> 9 Months |
Source: Oldeman (1980)
A1; A2
B1
B2; B3
C1
C2; C3; C4
D1
D2; D3; D4
E
Table 2. Oldeman Climate Classification Interpretation
Climate Zone Agricultural Systems/Cropping Patterns
Suitable for continuous paddy but less production due to generally low solar radiation flux density throughout the year
Suitable for continuous paddy with good early planting season planning high production when the dry season harvest
Suitable for planting paddy twice a year with short-lived varieties and a short dry season sufficient for palawija crop
Suitable for planting paddy once and palawija crop twice in a year
Suitable for planting paddy once and palawija crop twice in a year. The second
planting of the palawija crop should not be in the dry season
Suitable for growing short-lived paddy with high production due to the high radiation flux density and one palawija crop planted
Suitable for one planting of paddy or one palawija crop, depending on the supply of irrigation water
Suitable for planting palawija crop planted once, depending on the rain
Source: Oldeman (1980)
This research has several stages (Figure 2), namely: 1 extraction of CHIRPS rainfall raster data extracted into data points; 2) IDW interpolation and overlay based on rain point data; 3) classification based on wet and dry months to produce a classification of
monthly rainfall for 1981-2021; 4) overlay analysis to obtain an agroclimatic map. The resulting map was compared with the 1977 Oldeman agroclimate map to determine whether there were changes in agroclimatic zones in Southeast Sulawesi Province.
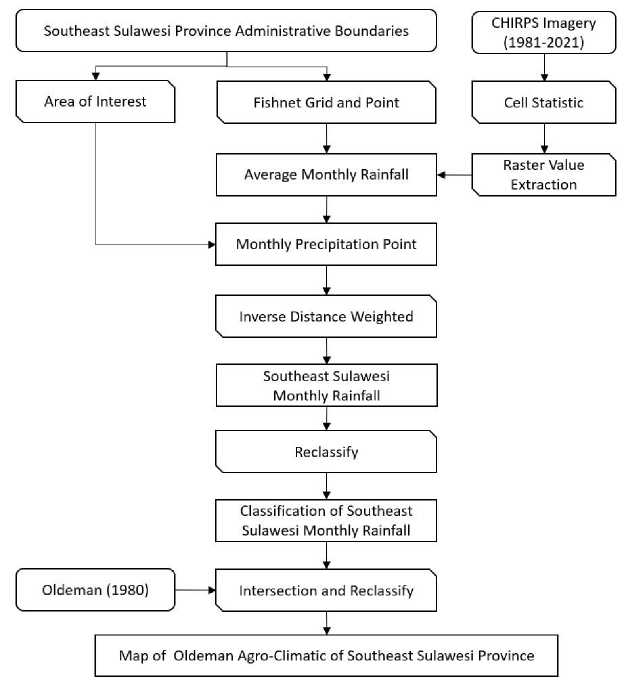
Figure 2. Flowchart
The distribution of monthly rainfall in Southeast Sulawesi Province during the 1981-2021 period is shown in the graph in Figure 3. The graph shows that the highest average rainfall occurs in April, which is 457 mm, and then decreases gradually from May to August. In August there is rainfall with the lowest average value, which is 195 mm. The average value of
rainfall then increases gradually from September to December. In January the average value of rainfall decreased again. A similar pattern is also shown from the lowest average rainfall values. However, May has the lowest average rainfall compared to June. Apart from that, July to October has relatively constant rainfall. From November to February, it tends to fluctuate. If we refer to the average value, the rainfall pattern shows an increase from January to May, then decreases until August, and increases again until December.
The map in Figure 4 shows the distribution of wet months (>200 mm), moist months (100-200 mm), and dry months (<100 mm) in Southeast Sulawesi Province. January, February, March, April, May, June, November, and October are classified into two types of months, namely wet months and moist months.
August, September, and October are also classified into two types of months, namely the wet months and the dry months. Meanwhile, the month of July is classified into three types of months, namely the wet month, the moist month, and the dry month. Thus, Southeast Sulawesi Province has more wet months than dry months.
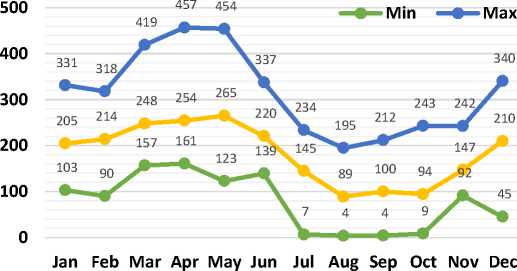
Figure 3.
Average Monthly Rainfall of Southeast Sulawesi Province 1981-2021
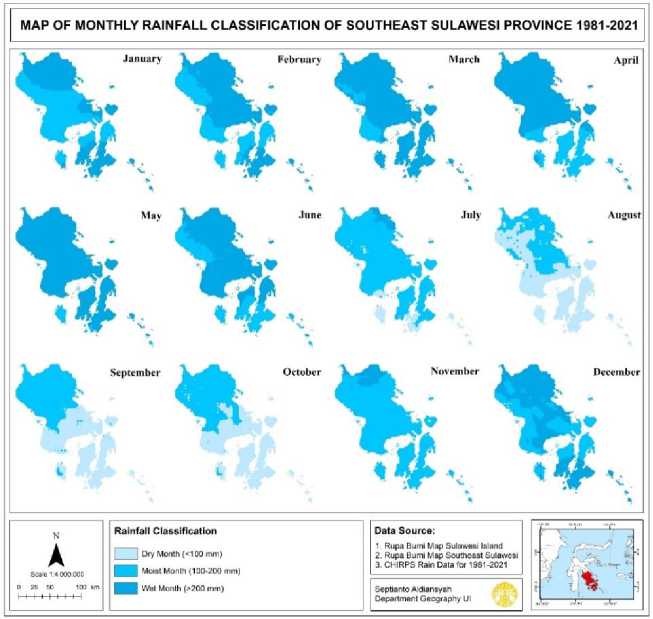
Figure 4.
Classification of Monthly Rainfall in Southeast Sulawesi Province 1981-2021
Based on the results of Oldeman's climate classification mapping from CHIRPS data (Figure 5), currently, Southeast Sulawesi Province is divided into thirteen agro-climatic zones, namely B1, B2, B3, C1, C2, C3, D1, D2, D3, D4, E1, E2, and E3. The climate zones B1 and C2 are the most dominant climates with an area of 8,872 km2 (23,71%) and 8,683 km2 (23,21%), respectively. Then
followed by the D2 climate zone of 6.252 km2 (16,71%), C1 of 5.004 km2 (13,48%), D1 of 2,753 km2 (7,36%), C3 of 1.737 km2 (4,64%), E1 of 1.093 km2 (2,92%), E2 867 km2 (2,32%), E3 816 km2 (2,18%), B2 737 km2 (1,97%), D3 477 km2 (1,28%) %), B3 of 81 km2 (0,22%), and D4 of 0.00014 km2 (0,00%). The thirteen Oldeman agro-climatic zones are spread across the province of Southeast Sulawesi as shown in Table 3.
Table 3. Percentage of Area Distribution of the Oldeman Agro-climate Zone, Southeast Sulawesi Province
|
Regency/ City |
B1 |
B2 |
B3 |
C1 |
C2 |
C3 |
D1 |
D2 |
D3 |
D4 |
E1 |
E2 |
E3 |
|
Bombana |
0.00 |
0.00 |
- |
0.03 |
1.51 |
- |
0.01 |
2.94 |
0.66 |
- |
0.03 |
1.83 |
2.12 |
|
Buton |
0.00 |
- |
- |
- |
3.54 |
0.92 |
- |
0.00 |
0.00 |
- |
- |
- |
- |
|
Buton Selatan |
0.00 |
- |
- |
- |
0.10 |
1.01 |
0.00 |
0.01 |
0.41 |
0.00 |
- |
- |
- |
|
Buton |
0.00 |
- |
- |
- |
0.63 |
0.50 |
0.00 |
0.99 |
0.16 |
- |
- |
0.00 |
0.06 |
|
Tengah Buton Utara |
0.00 |
0.00 |
- |
0.00 |
0.50 |
0.00 |
- |
4.20 |
0.04 |
- |
- |
- |
0.00 |
|
Kolaka |
0.00 |
- |
- |
0.99 |
0.09 |
- |
2.61 |
2.46 |
- |
- |
1.92 |
0.17 |
- |
|
Kolaka |
1.37 |
- |
- |
5.16 |
1.23 |
- |
2.41 |
0.32 |
- |
- |
0.07 |
0.01 |
- |
|
Timur Kolaka Utara |
2.63 |
- |
- |
1.01 |
0.00 |
- |
2.31 |
0.09 |
- |
- |
0.91 |
0.04 |
- |
|
Konawe |
9.68 |
0.62 |
- |
4.73 |
1.89 |
- |
0.02 |
0.00 |
- |
- |
- |
- |
0.00 |
|
Konawe |
- |
- |
- |
- |
1.75 |
0.13 |
- |
0.01 |
- |
- |
- |
- |
0.00 |
|
Kepulauan Konawe |
0.01 |
0.61 |
- |
0.69 |
10 |
0.02 |
0.00 |
0.25 |
0.00 |
- |
- |
- |
- |
|
Selatan Konawe Utara |
10.02 |
0.01 |
- |
0.88 |
0.39 |
- |
0.00 |
0.00 |
- |
- |
- |
0.00 |
0.00 |
|
Bau Bau |
- |
- |
- |
- |
0.03 |
0.76 |
- |
0.00 |
- |
- |
- |
- |
- |
|
City Kendari |
- |
0.73 |
- |
- |
0.00 |
- |
0.00 |
- |
- |
- |
- |
- |
- |
|
City Muna |
0.00 |
- |
- |
- |
1.50 |
0.04 |
0.00 |
3.50 |
- |
- |
- |
0.08 |
0.00 |
|
Muna Barat |
- |
0.00 |
- |
- |
0.04 |
- |
0.00 |
1.94 |
- |
- |
- |
0.19 |
0.00 |
|
Wakatobi |
- |
- |
0.22 |
- |
0.001 |
1.26 |
0.00 |
0.00 |
0.00 |
- |
- |
- |
0.00 |
Source: Data Analysis, 2022
The majority of the B1, B2, and B3 agro-climatic zones are located in the northwestern, eastern, and southeastern parts of Southeast Sulawesi Province, such as Konawe, Konawe Utara, Kendari City, and Wakatobi Regency, where these areas are very suitable for paddy cultivation. In zone B1, paddy cultivation activities can be carried out throughout the
year and production will be optimal when harvest time coincides with the dry season. This is due to the insufficient intensity of sunlight received by the paddy. Meanwhile, paddy cultivation activities in zones B2 and B3 can be carried out twice a year followed by the planting of various types of palawija crops during the dry season.
The agro-climatic zones C1, C2, and C3 stretch from west to east including the Kepulauan Konawe, the southern part of Muna Island, the southeastern part of Buton Island, and most of Wakatobi Regency. In zone C1 which includes Kolaka, Kolaka Timur, Konawe, and Konawe Selatan Regency, paddy cultivation activities can be carried out once and twice for the palawija crop in a year. Meanwhile, paddy cultivation activities in zones C2 and C3 which include Konawe, Konawe Selatan, Bombana, Baubau City, Buton, Buton Selatan, and Wakatobi Regency, can only be carried out once a year, and twice for palawija crop in a year. The planting of palawija crops should not be done in the dry season because the intensity of the sun and rainfall that the crops receive is insufficient.
The agro-climatic zones D1, D2, D3, and D4 are spread from the northwest to
the southwest to most of Muna Island and half of Buton Island. In the D1 agro-climatic zone which includes Kolaka, Kolaka Timur, and Kolaka Utara Regency, paddy cultivation can only be carried out on short-lived paddy plant species for one planting with high production due to the high radiation flux density, and one palawija crop. As for zones D2, D3, and D4, one paddy crop or one palawija crop can only be planted, depending on the supply of irrigation water. The areas in this zone are located in the Regency of Bombana, Muna, Muna Barat, Buton Utara, and Buton Tengah. The agro-climatic zone E (E1, E2, and E3) is in the northwest and southwest of Southeast Sulawesi Province. Zone E, which includes Kolaka, Kolaka Utara, Bombana, and a small part of Buton Selatan, is suitable for one crop of palawija crops, depending on rain.
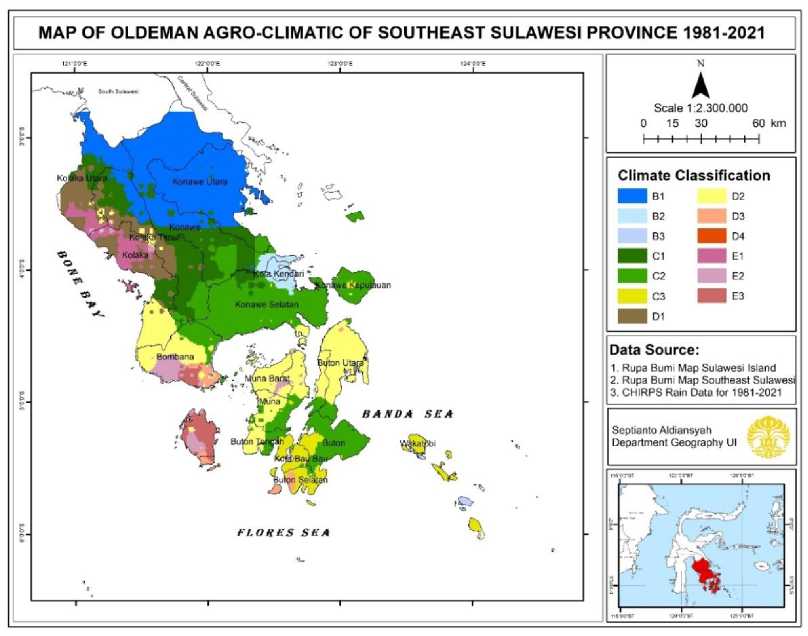
Figure 5.
Oldeman Agro-climate Map of Southeast Sulawesi Province 1981-2021
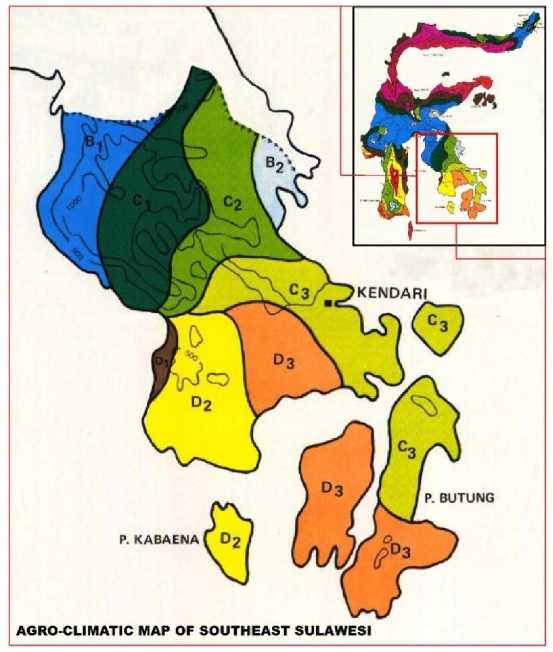
Figure 6.
Agro-climate Zone of Southeast Sulawesi Province
Based on the Agro-climate Map of Sulawesi Island (Oldeman & Sjarifuddin, 1977)
Oldeman's classification is considered valid if it refers to the Indonesian season zone for the period 1991-2020 which shows that Southeast Sulawesi is categorized into the monsoon-2 season zone where there are 2 seasons, namely the dry season and the rainy season. The seasonal zone distribution trend shows promising results and is similar to Figure 5 where the dry season starts from November to May, while the rainy season starts from June to October (BMKG, 2022).
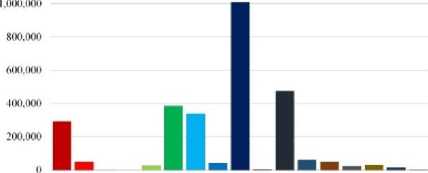
The above study is also supported by BPS data for 2011-2020 regarding the production of paddy and palawija crops (Corn, Soybean, Peanuts, Mung Beans, Cassava, and Sweet Potato) in Southeast Sulawesi. The highest paddy production was in Konawe Regency (1,010,793 tons), followed by Konawe Selatan Regency (474,418 tons), Kolaka Regency (383,967
tons), Kolaka Timur Regency (338,071 tons), and Bombana Regency (291,297 tons) (Figure 7). The high amount of paddy production in these five regions is supported by the percentage distribution of agro-climatic climates that are suitable for continuous paddy planting in the dry season and at least twice a year, respectively reaching 16.92%, 11.32%, 1.09%, 7.76%, and 1.54% of the total area of each climate. Meanwhile, the highest accumulated palawija crops production was in Muna Regency (306,573 tons), followed by Buton Regency (246,727 tons), Konawe Selatan Regency (202,813 tons), Wakatobi Regency (123,482 tons), and Buton Utara Regency (107,482 tons) (Figure 8). The high production of palawija is also supported by the percentage of agro-climatic distribution that is suitable for crops in the short dry
season and the availability of water from irrigation water and rainfall which respectively reached 5.12%, 4.45%, 11.56%, 1.48% and 4.74% of the total area of the climate considered suitable.
According to Abdin (2018), there are several sustainable base commodities in Southeast Sulawesi such as corn, peanuts, and cassava, apart from that rice and soybeans can only be short-term base
commodities. Among the regions that contribute the most to paddy and palawija production in Southeast Sulawesi, Konawe Selatan Regency contributes quite significantly to producing paddy and palawija products. The agricultural and forestry sectors are the leading sectors of the economy in Konawe Selatan Regency (Saputra et al., 2023).
Paddy
1,200.000
■ Bombann
■I Buton
Bulon Selatan
Buton Tengah
■ Buton Utara
■ Kolaka
■ Kolaka Tiniur
■ KolakaUtara
H Konawe
■ Konawe Kepulauan
■ Konawc Sclatan
H Konawc Utara
■ Bau Bau City
Kendari City
■ Muna
■ Muna Barai
■ Wakatohi
Figure 7.
Production of Paddy in Southeast Sulawesi Province in 2011-2021 (tons) (BPS, 2011-2021)
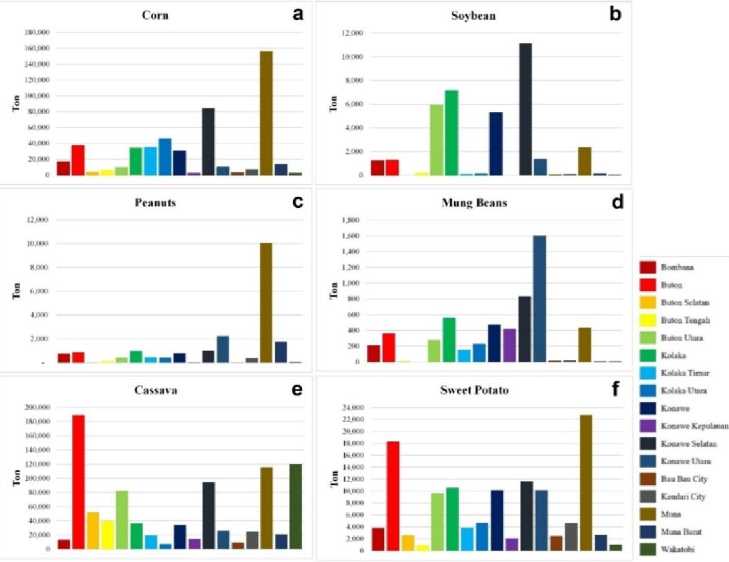
Figure 8.
Production of Palawija Crops in Southeast Sulawesi Province in 2011-2020 (tons): a) corn; b) soybean; c) peanuts; d) mung beans; e) cassava; and f) sweet potato (BPS, 2011-2021)
The agro-climatic zone in Southeast Sulawesi Province was mapped by Oldeman & Sjarifuddin (1977) (Figure 6). Based on the agro-climatic map produced by Oldeman & Sjarifuddin (1977), it is known that Southeast Sulawesi Province consists of B1, B2, C1, C2, C3, D1, D2, and D3. Zone B1 is on the northwest side, such as Kolaka Utara Regency and B2 is on the north side, such as Konawe Utara. Zones C1, C2, and C3 stretch from the center to the southeast of the province of Southeast Sulawesi. Zones C1 and C2 cover most of the regencies of Kolaka Timur, Konawe, and Kolaka. Zone C3 covers a small part of Konawe, Konawe Selatan, the entire Kepulauan Konawe Regency, Buton Utara, and a small part of West Muna Regency. Zones D1, D2, and D3 stretch from west to south of Southeast Sulawesi province. Zones D1 and D2 cover Bombana Regency (including Kabaena Kepulauan) and a small part of Kolaka Regency. Zone D3 is in Konawe Selatan, the whole Muna island (including Muna, most of Muna Barat, and Buton Tengah), Buton, Buton Selatan Regency, and Baubau City.
The agro-climatic zone in Southeast Sulawesi Province resulting from the mapping process is different from the agro-climatic map of the island of Sulawesi made by Oldeman & Sjarifuddin in 1977. There is a decrease in agro-climatic zones from B1 to D1 and E1, and D1 to D2 as in the Kolaka Regency. The greatest decrease in the zone occurred on Kabaena Island from zone D2 to E. An increase in the agro-climate zone also occurred in the Konawe Selatan and Konawe Kepulauan Regency, namely from C2 and D3 to C2 in most areas. An increase in the agro-climatic zone also occurred in the regency of Buton, Buton Selatan, and Baubau City from zones D3
to C2 and C3. The difference in the number of raindrops used in the mapping process is the most dominant factor influencing these changes, regardless of the impact of global warming, as As-syakur et al. (2010). The results of similar studies also explain that there is a trend of climate change in the world causing changes in rainfall and shifts in seasons (Prabaningrum & Emiliya, 2018; Matheus, 2019), as well as changes in temperature in the highlands and lowlands (Barung & Suwandi, 2017). This change can occur all over the world, without exception in Indonesia which can change the dry season to be prolonged or the rainy season period to be less and less.
The Oldeman agro-climatic zones mapped in Southeast Sulawesi Province consist of 13 zones. The climate zones B1 and C2 are the most dominant climates with an area of 8,872 km2 and 8,683 km2 respectively of the 37,421 km2 area of Southeast Sulawesi Province. Zones B1, B2, and B3 are located in the northwest, east, and southeast of the area which are very suitable for cultivating paddy twice a year, followed by planting various types of palawija crops during the dry season. Zones C1, C2, and C3 which stretch from west to east, including the Konawe Islands area, are suitable for cultivating paddy once and twice for the palawija crop in a year. Zones D1, D2, D3, and D4 are spread from the northwest to the southwest to most of Muna Island and half of Buton Island is suitable for the cultivation of short-lived paddy for one planting and one paddy plant or one palawija crop. Agro-climatic zones E (E1, E2, and E3) in the northwest and southwest are only suitable for planting once a palawija crop, depending on rain.
REFERENCE
Abidin, Z. 2018. Identifikasi komoditas unggulan wilayah dalam perspektif pertanian berkelanjutan di Sulawesi Tenggara. Mega Aktiva: Jurnal Ekonomi dan Manajemen, 7 (2), 92105.
http://dx.doi.org/10.32833/majem.v7i 2.71
Arif, N. 2019. Studi Komparasi Kriging dan IDW untuk Estimasi Spasial Bahan Organik Tanah. Geomedia: Majalah Ilmiah dan Informasi Kegeografian, 17 (2), 83–87.
https://doi.org/10.21831/gm.v17i2.28 866
As-syakur, A. R., Nuarsa, I. W., &
Sunarta, I. N. 2010. Pemutakhiran Peta Agroklimat Klasifikasi Oldeman Di Pulau Lombok Dengan Aplikasi Sistem Informasi Geografi.
Penelitian Masalah Lingkungan di Indonesia, May, 79–87.
Badan Meteorologi Klimatologi dan Geofisika. 2021. Stasiun Wilayah BBMK4. Accessed December 30, 2022. From
www.bmkg.go.id/profil/stasiun-upt.bmkg
Badan Meteorologi Klimatologi dan Geofisika. 2022. Pemutakhiran Zona Musim Indonesia Periode 1991-2020. Accessed October 22, 2023. From https://iklim.bmkg.go.id/
Badan Pusat Statistik. 2022. Provinsi Sulawesi Tenggara Dalam Angka 2022. Accessed December 30, 2022. From https://sultra.bps.go.id/
Badan Pusat Statistik. 2021. Provinsi Sulawesi Tenggara Dalam Angka 2021. Accessed October 18, 2023. From https://sultra.bps.go.id/
Badan Pusat Statistik. 2020. Provinsi Sulawesi Tenggara Dalam Angka
2020. Accessed October 19, 2023. From https://sultra.bps.go.id/
Badan Pusat Statistik. 2019. Provinsi Sulawesi Tenggara Dalam Angka 2019. Accessed October 19, 2023. From https://sultra.bps.go.id/
Badan Pusat Statistik. 2016. Provinsi Sulawesi Tenggara Dalam Angka 2016. Accessed October 19, 2023. From https://sultra.bps.go.id/
Badan Pusat Statistik. 2015. Provinsi Sulawesi Tenggara Dalam Angka 2015. Accessed October 20, 2023. From https://sultra.bps.go.id/
Badan Pusat Statistik. 2014. Provinsi Sulawesi Tenggara Dalam Angka 2014. Accessed October 20, 2023. From https://sultra.bps.go.id/
Badan Pusat Statistik. 2012. Provinsi Sulawesi Tenggara Dalam Angka 2012. Accessed October 20, 2023. From https://sultra.bps.go.id/
Badan Pusat Statistik. 2011. Provinsi Sulawesi Tenggara Dalam Angka 2011. Accessed October 19, 2023. From https://sultra.bps.go.id/
Barung, F. M., & Suwandi, S. 2017.
Proyeksi Kesesuaian Agroklimat Tanaman Padi Berdasarkan Skenario Representative Concentration
Pathways (RCP) 4.5 dan RCP8. 5 Di Provinsi Jawa Timur. Jurnal
Meteorologi Klimatologi dan Geofisika, 4 (3), 32-45.
https://doi.org/10.36754/jmkg.v4i3.5 1
Bayong, T. 2004. Klimatologi. Penerbit ITB. Bandung
Budiyono, & Faisol, A. 2021. Evaluasi Data Climate Hazards Group Infrared Precipitation With Station (CHIRPS) Dengan Data Pembanding Automatic Weather Stations (AWS) Dalam Mengestimasi Curah Hujan Harian Di
Provinsi Papua Barat. Jurnal Teknik Pertanian Lampung, 10 (1), 64–72. https://doi.org/10.23960/jtep-l.v10i1.64-72
Dewi, N. K. 2005. Kesesuaian Iklim Terhadap Pertumbuhan Tanaman. Jurnal Ilmu-Ilmu Pertanian, 1 (2), 1– 15.
http://dx.doi.org/10.31942/mediagro. v1i2.898
Dwiyono, H. 2009. Meteorologi Klimatologi. Universitas Negeri
Malang. Malang
Faisol, A., Indarto, I., Novita, E., &
Budiyono. 2020. Komparasi Antara Climate Hazards Group Infrared Precipitation With Stations (CHIRPS) dan Global Precipitation
Measurement (GPM) Dalam
Membangkitkan Informasi Curah Hujan Harian Di Provinsi Jawa Timur. Jurnal Teknologi Pertanian Andalas, 24 (2), 148–156.
https://doi.org/10.25077/jtpa.24.2.148 -156.2020
Faisol, A., Paga, B. O., & Edowai, D. N. 2022. Pemutakhiran Zona Iklim Schmidt–Ferguson Melalui
Pemanfaatan Data Climate Hazards Group Infrared Precipitation with Stations untuk Mendukung
Pengembangan Pertanian di Provinsi Papua Barat. In Prosiding Seminar Nasional Pembangunan Dan Pendidikan Vokasi Pertanian (Vol. 3, No. 1, pp. 546-556).
https://doi.org/10.47687/snppvp.v3i1. 338
Fiannacca P., Ortolano G., Pagano M., Visalli R., Cirrincione R. & Zappalà L. (2017). IG-Mapper: A new ArcGIS® toolbox for the geostatistics-based automated
geochemical mapping of igneous rocks. Chem. Geol., 470, 75-92.
https://doi.org/10.1016/j.chemgeo.20 17.08.024
Funk, C. C., Peterson, P. J., Landsfeld, M. F., Pedreros, D. H., Verdin, J. P., Rowland, J. D., Romero, B. E., Husak, G. J., Michaelsen, J. C., & Verdin, A. P. 2014. A Quasi-Global Precipitation Time Series for Drought Monitoring. Reston, Virginia: U.S. Geological Survey.
Haftom, H., Haftu, A., Goitom, K., & Meseret, H. 2019. Agroclimatic zonation of Tigray region of Ethiopia based on aridity index and traditional agro-climatic zones. Journal of Agrometeorology, 21(2), 176-181.
https://doi.org/10.54386/jam.v21i2.22 9
Jufri, S., Ginting, S., & Safuan, L. O. 2018. Analisis Agroekosistem untuk Pengembangan Tanaman di Kota Kendari. Jurnal Berkala Penelitian Agronomi, 6 (1), 9–16.
https://doi.org/10.33772/bpa.v6i1.751 6
Lakitan, B. 2002. Dasar Dasar Klimatologi. PT.Raja Grafindo
Persada. Jakarta.
Mahubessy, R. C. 2014. Tingkat Kesesuaian Lahan Bagi Tanaman Padi Berdasarkan Faktor Iklim Dan Topografi Di Kabupaten Merauke. Agrologia, 3 (2), 125–131.
https://doi.org/10.30598/a.v3i2.253
Matheus, R. 2019. Skenario Pengelolaan Sumber Daya Lahan Kering: Menuju Pertanian Berkelanjutan. Deepublish.
Nasution, M. I., & Nuh, M. 2018. Kajian Iklim Berdasarkan Klasifikasi
Oldeman Di Kabupaten Langkat. Journal of Islamic Science and
Technology, 3 (2), 1–19.
http://dx.doi.org/10.30829/jistech.v3i 2.3157
Oldeman L. R. & Sjarifuddin D. 1977. An agroclimatic map of sulawesi. Central Research Institute for Agriculture.
Oldeman L. R. 1980. The agroclimatic maps of kalimantan maluku irian jaya and bali west and east nusa tenggara. Central Research Institute for Agriculture.
Paski, J. A. I., Sepriando, A., Faski, G. I. S. L., & Handoyo, M. F. 2017.
Pemetaan Agroklimat Klasifikasi Oldeman di Provinsi Bengkulu Menggunakan Data Observasi Permukaan dan Multi Satelit (TMPA dan IMERG). Prosiding Seminar Nasional Penginderaan Jauh 2017 (pp. 485–492).
Prabaningrum, R., & Nuriani, E. 2016. Identifikasi perubahan zona
agroklimat metode oldeman Di Provinsi Jawa Barat. Bumi Indonesia, 5 (4), 1–10.
Pramono, G. H. 2008. Akurasi Metode IDW dan Kriging untuk Interpolasi Sebaran Sedimen Tersuspensi di Maros, Sulawesi Selatan. Forum Geografi, 22 (1), 97–110.
https://doi.org/10.23917/forgeo.v22i2 .4988
Saputra, R. A., Irsan, L. O. M., Surdin, Karantina, W. O. Y., & Atniza, S. W. 2023. Analisis Sektor Unggulan Perekonomian Menggunakan
Pendekatan Location Quotient. Jurnal Penelitian Pendidikan Geografi, 8 (3), 114–122.
https://doi.org/10.36709/jppg.v8i3.12
Suparman. 2007. Bercocok Tanam Ubi Jalar. Ganeca Exact. Bandung.
Wredaningrum, I., & Sudibyakto. 2014. Analisis Perubahan Zona Agroklimat Daerah Istimewa Yogyakarta Ditinjau dari Klasifikasi Iklim Menurut Oldeman. Jurnal Bumi Indonesia, 3 (4), 1–10.
ECOTROPHIC • 17(2): 174-187 p-ISSN:1907-5626,e-ISSN: 2503-3395
187
Discussion and feedback