EVALUATION OF TUNA FISHING GROUND IN SOUTHERN COAST OF JAVA - SUMBAWA SEA USING SATELLITE OBSERVED DATA
on
Ecotrophic ♦ 4 (1): 25 - 30
ISSN: 1907-5626
EVALUATION OF TUNA FISHING GROUND IN SOUTHERN COAST OF JAVA - SUMBAWA SEA USING SATELLITE OBSERVED DATA
MOKHLAS SATIBI1), TAKAHIRO OSAWA2) AND I WAYAN ARTHANA3) 1) Center of Remote Sensing and Oceanography
-
2) Master Program of Environment Postgraduate Program Udayana University E-mail: pmil-unud@indo.net.id
ABSTRACT
Potential fishery in territorial water of South Java - Sumbawa Sea has not been exploited maximally. Tuna is one of fishery potency in the territorial water of South Java - Sumbawa. Tuna is the important economic value because it represent one of exporting commodity enthused by overseas consumer.
Research was conducted in the Southern Java – Sumbawa, Indian Ocean 90 S - 160 S; 1060 E - 1210 E, using fish catch data 2003 – 2006. Research location is in the inclusive Region of Fishery Management IX (DKP and PKSPL, 2003). Data were taken from a daily fish catch of PT. Perikanan Samudra Besar (PSB) Benoa Bali 2003 - 2006.
Sea level anomaly (SLA) data were estimated from Altimetry satellite (Jason 1), wind speed data was from Scatterometer satellite and sea surface temperature (SST) data was from Microwave satellite.
Based on the result of this research, sea level anomaly of southern coast of Java-Sumbawa was fluctuated according to monsoon. The highest bigeye tuna fish catched was 40 tuna in June 2003 and the lowest bigeye tuna fish was 2 tuna in November 2005. Maximum SLA observe during southeast monsoon was 21.77 cm in august 2005, while minimum SLA observed during southeast monsoon was -18.15 cm in October 2003. Sea surface temperature of southern coast of Java-Sumbawa also fluctuated according to monsoon. Maximum SST observed during northwest monsoon was 30.450 C in March 2006, while minimum SST observed during southeast monsoon was 25.050 C in August 2006. The highest wind speed was 10.20 m/sec in June 2004 and the lowest was 2.00 m/sec in October 2004. Wind direction was reversely changed according to monsoon. Northwest wind monsoon flew eastward and southeast wind monsoon flew westward.
Fish production in PT PSB had been done over 4 years since 2003, in northwest and southwest monsoon in constant area and correlation of linier regression among estimate of fish catching using SLA, SST and wind speed had no correlation. With fish production during southwest monsoon PT PSB set in SLA negative in different temperature of 30 C, wind speed of 2.00 m/sec and with abundant of fish catched. Meanwhile in northeast monsoon that was in positive SLA the fish catching was in low number.
Key Words: Tuna Fishing Ground, Remote Sensing, Altimetry, SST, Wind
ABSTRAK
Potensi perikanan di wilayah selatan Jawa – Sumbawa belum termanfaatkan secara maksimal. Tuna merupakan salah satu potensi perikanan di wilayah tersebut. Tuna memiliki nilai ekonomi penting karena merupakan salah satu komoditi ekspor yang dikonsumsi oleh konsumen luar negeri.
Riset dilakukan di selatan Jawa – Sumbawa, Samudera Hindia 90 LS - 150 LS; 1060 BT - 1200 BT dengan menggunakan data tangkapan ikan tahun 2003 – 2006. Lokasi penelitian berada pada Wilayah Pengelolaan Perikanan IX (DKP dan PKSPL, 2003). Data diperoleh dari data tangkapan ikan harian PT Perikanan Samudra Besar (PSB) Benoa Bali tahun 2003 sampai tahun 2006.
Data tinggi muka laut (Sea Level Anomaly) diperoleh dari data satelit (Jason 1), data kecepatan angin diperoleh dari data satelit scatterometer dan data suhu permukaan laut diperoleh dari data satelit microwave.
Berdasarkan pada hasil dan pembahasan dari penelitian ini dapat disimpulkan berdasarkan musim. Jumlah tangkapan tuna mata besar tertinggi adalah 40 ekor di bulan Juni 2003 pada musim timur dan terendah adalah 2 ekor di bulan November 2005 pada musim barat.Tinggi muka laut tertinggi terjadi di bulan Agustus tahun 2005 pada musim timur yaitu 21,77 cm, sedangkan tinggi muka laut terendah terjadi di bulan Oktober tahun 2003 pada musim timur yaitu – 18.14 cm. Suhu permukaan laut (Sea Surface Temperature) di lokasi penelitian juga berfluktuasi berdasarkan musim. Suhu permukaan laut tertinggi terjadi di bulan Maret tahun 2006 pada musim barat yaitu 30.450 C, sedangkan suhu terendah terjadi di bulan Agustus tahun 2006 pada musim timur yaitu 25.050 C. Kecepatan angin tertinggi yaitu 10.20 m/sec dibulan Juni 2004 dan terendah yaitu 2.00 m/sec di bulan Oktober 2004 sedang arah angin berubah secara bolak balik berdasarkan musim.
PT PSB melakukan penangkapan ikan selama 4 tahun (2003 – 2006) baik pada musim barat atau musim timur cenderung pada daerah yang sama dan hasil regresi linier antara jumlah tangkapan ikan dengan SLA, SST dan kecepatan angin tidak ada hubungan. Pada musim barat lebih banyak melakukan penangkapan pada nilai SLA negative dengan perbedaan suhu 30 C
kecepatan angin 2.00 m/sec dan mendapat hasil yang banyak, sedang pada musim timur lebih banyak melakukanpenangkapan pada nilai SLA positive dengan hasil sedikit.
Kata Kunci : Lokasi penangkapan Tuna, Penginderaan Jauh, SLA, SST, Angin
INTRODUCTION
Background
Potential Fishery in territorial water of South Java -Sumbawa sea have not been exploited maximal, due to effective method have not developed yet and the finding of tuna fishing ground in southern Indian ocean.
Total of fish catching by fishermen in East area of Indian Ocean (EIO), such as PT Perikanan Samodra Besar ( PSB) show the tendency of decreasing the fish catch since 1973 (Batubara 2003) and total of average hook rate in a hundred from 1997 to 1999 also decreased in following year (0.84, 0.78 and 0.57) (Gaol, et al., 2001).
The decreasing of total fish catching seems to increase foreign ship whose catch Tuna in Indian Ocean. For instance, the number of tuna Chinese fishermen who catch in Indian Ocean in 1995 is only 12 fishermen. But in 1999, it is increase became 148 fishermen. This condition followed by total fish catch, in 1995 is 403 ton of Tuna Fish Catching, and in 1999 became 2.816.5 ton(Gaol et, al., 2004).
Fishing ground of PT PSB is outside of area Indonesia Economy Exclusive Zone (EEZ). Generally, foreign ships have modern accommodative for increase their fish catch, this equipment is such as information system to determine the potential fishing ground. This is contrary to our fishermen that relying on minimum equipment.
Tuna represent one of fishery potency territorial water of South Java - Sumbawa. Tuna the important economic value because Tuna represent one of exporting commodity enthused by overseas consumer.
Existences of tuna somewhere are representative by tuna migration pattern. This migration pattern represents one of especial subject in which is a lot of learning in the effort to increase effective fish catch.
In data fisherman used satellite remote sensing technology to estimate of tuna fishing ground in this year. Oceanic parameters detect by remote sensing data (sea surface, chlorophyll, wind parameter and sea surface height). Fisherman need low cost and fast decision to estimate tuna fishing ground by effective to select oceanic parameter detect by satellite remote sensing.
Sea surface height is show an ocean dynamic characteristic using TOPEX / Poseidon and JASON. Another satellite remote sensing detect sea surface temperature by microwave is TRMM microwave and to detect wind parameter is Quick Scattering radar.
From sea surface height obtainable knowable satellite altimetry characteristic territorial water. Some important territorial water characteristic from sea surface height which can be laid open among other things current direction, eddy, front, and upwelling. From the phenomena knowable potential location for the catch of tuna fish. Sea surface temperature and wind speed are correlative with sea surface height. Tuna fishing ground can be determined by one of that parameter or combine parameter. This study determines tuna fishing ground from such as paramaeters (SST,SSh, Chl-a and Sea surface wind) with select of parameter by comparison.
Problems Formulation
-
1. What is the characteristic of sea level anomaly, sea surface temperature and wind speed in Southern Coast of Java- Sumbawa Sea?
-
2. What is correlation between sea level anomaly, sea surface temperature and wind speed in Southern coast of Java - Sumbawa Sea with tuna fishing ground?
FRAMEWORK OF RESEARCH
Selected of the best fish catch data are according to time, fishing ground location and total fish catching. Selection of data results are accommodated with according to date of location and sum of the fish with the contour anomaly so
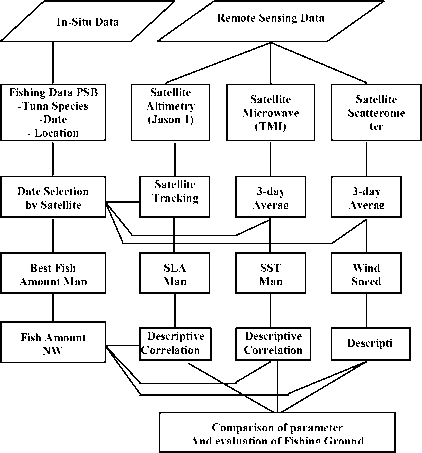
Figure: 1. Frame work of research
that so that will yield the one map and one value SLA for each every rotation circulate the satellite Altimetry. Design of research framework shows (Figure 1).
RESEARCH METHODOLOGY
Research conducted in the Southern Java – Sumbawa, Indian Ocean (90 S - 160 S; 1060 E - 1210 E) using fish catch data at 2003 – 2006. Research time from November 2007 - April 2008. Accurate location the inclusive of Region of Management of Fishery IX (DKP and PKSPL, 2003)
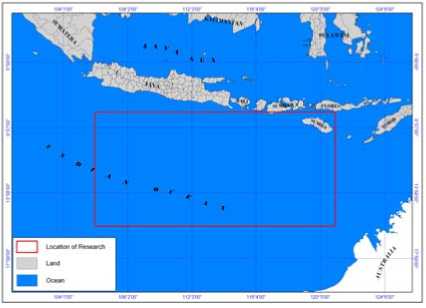
Figure: 2. Location of Research
Data was taken away from a daily fish catch of PT Perikanan Samudra Besar Benoa Bali from 2003 until 2006
-
• Altimetry satellite estimates the value and SLA map to fish catch of PT PSB.
-
• Scatterometer satellite by 3 daily value data and wind map, which is related to fish catch of PT. PSB data.
-
• Microwave satellite by 3 daily value data and SST map which are related to fish catch PT. PSB data.
-
• Data was analyzed by using linear regression between fish production and each oceanographic parameter which derived from satellite.
-
• Data sets daily fish catching collected from PT PSB during 4 year from 2003 to 2006.
-
• Selections of data results are accommodated with according to date of location and sum of the fish with the contour anomaly, which the one map and one value SLA for each every rotation circulate the satellite altimetry.
-
• Wind speed parameter is from Satellite Scatterometer and SST estimate from TMI satellite Microwave sensor.
-
• Data analyzed result is converted to annual and seasonal period.
RESULT
Oceanography condition in India Ocean generally influence by 2 season, (northwest and southeast monsoon). The factor influence: sea surface temperature, sea level anomaly and wind speed. Based on PT. PSB data acquired, potential fishing ground area is located in 12o – 15o S and 109o – 115o E.
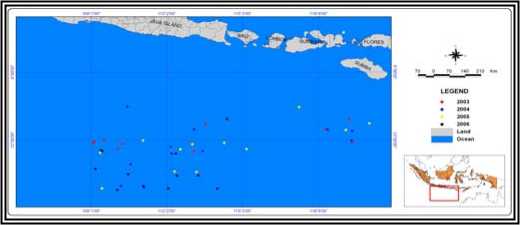
Figure: 2 Fishing Ground Area PT. PSB
The highest fish production in 2003 is 1000 kg on June and the lowest is 250 kg on August. The highest average of fish production in 2004 is 750 kg on July and the lowest is 200 kg on September. The highest average of fish production in 2005 is 550 kg on May and the lowest is 350 kg on June. The highest average of fish production in 2006 is 525 kg on June and the lowest is 150 kg on May.
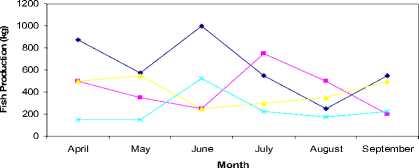
2003
2004
2005
2006
Figure: 3. Fish Production during Southeast Monsoon
Fish highest production in 2003 is 650 kg on January and the lowest is 225 kg on October. The highest average of fish production in 2004 is 750 kg on October and the lowest is 250 kg on January. The highest average of fish production in 2005 is 225 kg on December and the lowest is 50 kg on November. The highest average of fish production in 2006 is 850 kg on February and the lowest is 175 kg on November and December.
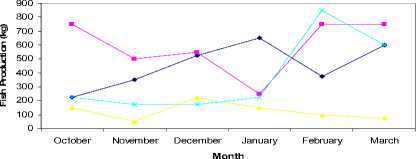
Figure: 4. Fish Production during Northwest Monsoon
DISCUSSION
Linear regression from total fish catching to sea level anomaly is low. With R2 = 0.0006 observed in southeast monsoon and R2 = 0.1455 observed in southwest monsoon (Figure: 5). From figure 5, tuna fish catching in range of sea level anomaly value is -15 – 20 cm. there is no pattern of negative or positive SLA value to tuna fish caching. Either in positive and negative sla value, there is a high tuna fish catching. However, there are different sla characteristics in southeast or northwest monsoon.
In northwest monsoon, a high of tuna fish catching is found in positive sea level anomaly (Figure: 5a). Meanwhile in southwest monsoon, a high of tuna fish catching is found in negative sea level anomaly (Figure: 5b). But result of linear regression shows R2 in southwest monsoon is higher than liner regression in northwest monsoon (Figure: 5). This condition happened by sea surface condition is thicker in positive sea level anomaly, where the water is clear and transparent and the suns shine is deeper break trough the water. When tuna bigeye is in this layer, tuna will lose its heat temperature faster. Therefore, bigeye tuna will often swim in close to the sea surface. For that result, bigeye tuna will catches by fish bait in the fish hook where fish setting is in the layer close to the sea surface (Liu et.al, 2003).
However, low SLA liner regression to tuna fish catching is caused by daily sea level anomaly data is
not used. In this research, the data is 10 daily sea level anomaly. Lie et.al., (2003), shows a high correlation from eddy identified by daily sea level anomaly to total tuna fish catching daily data in equal time of observation. Zainudin et.al., (2006), explained detail, where eddy’s phenomena is trapped the tuna fish food flows by the current, and territorial productivity in eddy area is high.
Liner regression from total of tuna fish catching to sea surface temperature is low. With R2 = 0.0664 observed in southeast monsoon and R2 = 0.111 is for southwest monsoon (Figure: 6.). Figure 6. shows the tuna fish catch is in sea surface temperature range 250 - 310 C. a highest total of tuna fish catching is show above 26° C of sea surface temperature. This condition is similar to Liu et.al., (2003) research result which is explained the bigeye tuna in east of Indian Ocean. Liu et.al., (2003) explained the catch per unit effort (CPUE) of bigeye tuna is tend to increase in fishing ground area with sea surface temperature is 26° c -28° C. A high total tuna fish catch in south of Java-Sumbawa of Indian Ocean is bigeye tuna.
Low correlation sea surface temperatures to tuna fish catch are caused by two factors. Those are composite data usage from sea surface temperature (mean distribution of SST) and a differences tuna fishing layer under the sea surface. sea surface temperature data used in this research is composite data. Where the data is compilation data in certain period of time and it is compiled into one mean distribution data. Meanwhile, fluctuation of sea surface temperature dynamics is fast. Therefore, sea surface temperature composite data usage is not shows an actual sea surface temperature condition during the fish is catch.
Liu et.al., (2003) explained the sst mean distribution data usage is used to estimate the tuna fishing ground, it is same as not estimated the fishing ground area. This also supported by Amin et.al., (1988), where the research location is in Banda Sea. Where there is no significant
-10 -5
Scatter Plot Fish and SLA SouthEast Monsoon (2003-2006)
1000
900
800
700
600
500
400
300
200
100
y = -0.047x + 427.32 R2 = 2E-06
1015
20
SLA ( cm )
Scatter Plot Fish and SLA NorthWest Monsoon (2003-2006)
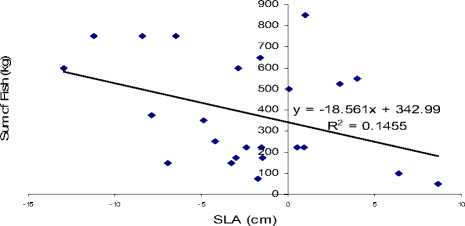
Figure: 5. Correlation Sea Level Anomaly to tuna fish catching during Southeast Monsoon (a) and Northwest Monsoon (b).
1200
1000
800
600
400
200
Scatter Plot Fish and SST SouthEast Monsoon (2003-2006)
y = 41.797x - 709.02 R2 = 0.0664

24.5 25 25.5 26 26.5 27 27.5 28 28.5 29 29.5 30
SST º C
0

Figure: 6. Correlation Sea Surface Temperatures to tuna fish catching during Southeast Monsoon (a) and Northwest Monsoon (b).
Scatter Plot Fish and Wind Speed SouthEast Monsoon (2003-2006)
Scatter Plot Fish and Wind Speed NorthWest Monsoon (2003-2006)
1200
1000
800
600
400
200
0
0

y = 13.044x + 332.41

900
800
700
600
500
400
300
200
100
0
0
y = -26.818x + 529.71 R2 = 0.0341

Wind Speed (knot)
Wind Speed (knot)
Figure: 7. Correlation wind speed to tuna fish catch during Southeast Monsoon (a) and Northwest Monsoon (b).
correlation from acoustics survey of pelagic fish distribution to sea surface temperature distribution.
Fishing layer of tuna is various in each of tuna species. Bigeye tuna fishing layer is in 0 – 400 m under of sea surface (Liu et.al, 2003). Meanwhile yellowfin tuna fishing layer is in thermoclin area of 18 – 45 m under the sea surface (Block et.al, 1997). Consequently, temperature that influences to those tuna distribution is temperature in fishing layer not temperature in the sea surface. Block et.al, (1997) explained that, optimum temperature range of yellowfin tuna fishing layer is in 17.50 – 20.50 C. And tuna sea surface temperature of this research is different to tuna optimum range temperature (yellowfin and bigeye tuna) fishing layer. Optimum temperature range of bigeye tuna fishing layer is 8 ’ C - 10 ’ C (Boggs, 1992).
As same as two oceanography parameters before, liner regression on total fish catching to sea surface temperature is tends to low. With R2 = 0.00072 observed in southeast monsoon and R2 = 0.0341 observed in northwest monsoon (Figure: 7).
A low correlation value is caused by tuna fish catch is far from the coastal area. Main factor influenced the wind to water mass condition in the ocean is upwelling process. In upwelling process, the wind is move over the sea
surface and the water mass will distribute trough those wind direction. However, the occur of carioles force as the result of earth rotation, then surface of ocean mass distribution is turned non continuous direction to wind direction. When this condition is occurs in the coastal area, the surface of water mass is tends to move to the ocean. The area of water mass is transform by a cooled water masses under the water mass that move to the ocean. This processes also called as upwelling driven by the wind (Valavanis, 2002)
Theoretically, upwelling area is rich by nutrient and food for fish. Therefore, fishing ground area that observes in this research in far from upwelling area, then, the result of tuna correlation fish catching to wind speed is low.
CONCLUSION AND SUGGESTION
Based on the results of this research, the conclusion as follows:
-
1. Sea level anomaly of southern coast of Java-Sumbawa was fluctuated according to monsoon. Maximum SLA observed during sourtheast monsoon was 21.77 cm in August 2005, while the minimum SLA observed during southeast monsoon was -18.15 cm in October 2003.
-
2. Sea surface temperature of southern coast of Java-Sumbawa fluctuated due to monsoon. Maximum SST observed during northwest monsoon is 30.45 0C in March 2006, while the minimum SST observed during southeast monsoon was 25.05 0C in August 2006.
-
3. The highest wind speed was 10.20 m/sec in June 2004 and the lowest was 2.00 m/sec in October 2004. Wind direction reversely changed and fluctuated of wind speed. During northwest monsoon wind direction show eastward, on the contrary wind direction shows westward during southeast monsoon.
-
4. Correlation of linier regression among fish catching estimation using SLA, SST and wind speed had no correlation with fish production.
-
5. Fish production in PT PSB had been done over 4 years since 2003, at the same area whether on northwest monsoon or southwest monsoon in constant area. During southwest monsoon PT PSB set in SLA negative in difference temperature of 3 0C, wind speed of 2.00 m/sec and with high number of fish catching. Meanwhile in northeast monsoon that was in positive SLA, the fish catching was in low number.
-
1. For other researchers, the research between correlation of SLA, SST and wind speed to fish production should be done at different of location, time and fish species.
-
2. During southeast monsoon it is better to PT PSB to operate the fish catching closer to the coastal area at about 90 – 120 S and 1150 - 1190 E that has less SLA (negative).
REFERENCES
Amin, Muljadi Edi, Duto Nugroho, Wasilun. 1988. Kemungkinan Penggunaan Teknik Remote Sensing dalam menentukan Daerah Penangkapan Ikan Pelagik melalui Pola Penyebaran Temperatur Air Laut. Jurnal Penelitian Perikanan Laut No 49, 21-31
Batubara, H.M.P. Manajemen Pengusahaan Tuna: Suatu Pengalaman Usaha PT. Perikanan Samodra Besar. Warta Mina. Himpunan Makalah Lokakarya Perikanan Tuna. Direktoral Jendral Perikanan Jakarta.
Block,BA, JE Keen, B Castillo, H Dewar, EV Freund, DJ Marcinek, RW Brill, C Farwell. 1997. Environmental preferences of yellowfin tuna (Thunnus albacares) at northern extent of its range. Marine Biology 130, 119-132.
Bogg, CH. 1992. Depth, capture time and hooked longevity of longline-caught pelagic fish : timing bites of fish with chips. Fish Bull, 90 , 642-658
CCRS. 2003. Fundamentals of Remote Sensing. A Canada Centre for Remote Sensing (CCRS). Remote Sensing Tutorial. Natural Resources Canada.
DKP. dan PKSPL. 2003. Penyususnan Pedoman Penandaan Sarana Penangkapan, Laporan Akhir PKSPL – IPB Bogor.
Gaol, JL., K. Mahapatra. Y. Okada, 2001. "Tuna catch and satellite derived ocean parameters in South Java sea during El Niño 1997/98", 1 Fish Sd. Supplement Vol I: 565-567.
Gaol, JL. I Wayan Nurjaya 2004. Penerapan Teknologi Pengindraan jauh Satelit untuk meningkatkan Hasil angkapan Ikan.Vol. II, No. 2 , November 2004
Liu, Cho-Teng, Ching-Hsi Nan, Chung-Ru Ho, Nan-Jung Kuo, Ming-Kuang Hsu, Ruo-Shan Tseng. 2003. Application of satellite remote sensing on the tuna fishery of Eastern Tropical Pacific. International Association of Geodesy Symposia Vol 126, 175-182
Maurer, J. 2002. Infrared and Microwave Remote Sensing of Sea Surface Temperature. Paper for Remote Sensing Seminar. University of Colorado University of Colorado at Boulder. Colorado, USA.
Robert A. Schowengerdt. 2007. Remote Sensing Models and Methods for Image Processing. Third Edition. Elsevier USA.
Robinson, I.S. (1991). Satellite Oceanography. An Introduction for Oceanographer and Remote Sensing Scientists. Ellis Horwood Ltd. England.
Santoso, S. 2007. Menguasai Statistik di Era Informasi dengan SPSS 15. Jakarta: Gramedia
Liu, Cho-Teng, Ching-Hsi Nan, Chung-Ru Ho, Nan-Jung Kuo, Ming-Kuang Hsu, Ruo-Shan Tseng. 2003. Application of satellite remote sensing on the tuna fishery of Eastern Tropical Pacific. International Association of Geodesy Symposia Vol 126, 175-182
Zainuddin, M, Hidetada Kiyofuji, Katsuya Saitoh, Sei-Ichi Saitoh. 2006. Using multi sensor satellite remote sensing and catch data to detect ocean hotspot for albacore(Thunnus alalunga) in the northwestern North Pacific. Deep-Sea Research II 53, 419-431.
Valvanis, D Vasilis. 2002. Geographic information system in oceanography and fisheries. Taylor and Francis Inc. 70-77
30
Discussion and feedback