DYNAMICAL ANALYSIS OF BANDA SEA CONCERNING WITH EL NINO, INDONESIAN THROUGH FLOW AND MONSOON BY USING SATELLITE DATA AND NUMERICAL MODEL
on
Ecotrophic ♦ 3 (2) : 87-91
ISSN: 1907-5626
DYNAMICAL ANALYSIS OF BANDA SEA CONCERNING WITH EL NINO, INDONESIAN THROUGH FLOW AND MONSOON
BY USING SATELLITE DATA AND NUMERICAL MODEL
Bambang Sukresno1, I W. Kasa2
-
1) SEACORM Perancak
-
2) Fakultas MIPA Unud
Email:pmil-unud@ndo.net.id
ABSTRACT
Banda sea is subjected to external force such as El Nino South Oscillation (ENSO), Indonesian Through Flow (ITF) and Monsoon. All of these component Combined with Current System, caused sea dynamic. This study aimed to get further knowledge about Banda sea dynamic. Based on this phenomenon , this study was conducted with an hypothesis that sea level anomaly (SLA) and sea sufrace temperature (SST) will decrease during ENSO event. Also that SLA and SST will seasonally change concerning with Monsoon. The pattern of current in eastern of Banda sea will be seasonally different concerning with monsoon while in western of Banda sea is almost constant according to ITF
This research carried out in Banda Sea within the rectangular region from 122.42 E to 131.47 E , Latitude 03.47 S to 07.65 S. in period of 1996 to 2006 consist of northwest monsoon, southeast monsoon, 1st transitional month in April and 2nd transitional month in October. Spatial analysis used to analyze annual and seasonal distribution of SST and SLA from satellite dataset, also by comparison between wind data, ITF pathway and numerical model. SST derived from NOAA / AVHRR satellite data by applying MCSST algorithm, SLA derived from Topex/ Poseidon and Jason-1 Satellite data by applying Inverse distance weighted interpolation, while numerical model derived from barothropic model using Princeton ocean model.
Sea level anomaly and sea surface temperature is decrease according to ENSO event, such as descrease of SLA and SST during ENSO event in 1997 , 2002 and 2004. Sea level anomaly and sea surface temperature is change according to Monsoon that reverse every 6 (six) month. SST and SLA get maximum level during northwest monsoon in November to March and get Minimum during Southeast monsoon in May to September. There are strong correlation coefficient between annual Sea level anomaly and annual Sea Surface Temperature with index value up to 0.817104. on the other side correlation coefficient between seasonal Sea level anomaly and Seasonal Sea Surface Temperature is 0.576469. Based on Patern of current we found that Western part of Banda sea is strongly affected by ITF while eastern part of Banda sea is strongly affected by monsoon.
Key words : Banda sea, sea surface temperature, sea level anomaly, current, el nino, Indonesian through flow, monsoon, numerical model
ABSTRAK
Laut Banda dipengaruhi oleh faktor eksternal seperti El Nino South Oscilation (ENSO), Arus Lintas Indonesia (Arlindo) dan Musim. Kesemua komponen tersebut berkombinasi dengan sistem arus menghasilkan suatu dinamika laut. Penelitian ini bertujuan untuk mendapatkan pengetahuan yang lebih mendalam mengenai dinamika laut Banda. Berdasarkan pada fenomena diatas, penelitian ini mengajukan hipotesis bahwa anomali tinggi permukaan laut dan suhu permukaaan laut mengalami penurunan selama tahun ENSO, Juga bahwa anomali tinggi permukaan laut dan suhu permukaan laut mengalami perubahan sebagai akibat adanya musim. Sedangkan pola arus di laut Banda juga mengalami perubahan berkaitan dengan perubahan musim.
Penelitian ini dilakukan di laut Banda dengan batas wilayah 122.42 BT hingga 131.47 BT dan 03.47 LS to 07.65 LS, dalam kurun waktu tahun 1996 hingga tahun 2006 yang terdiri dari musim barat dan musim timur, musim transisi pertama pada bulan April dan musim transisi kedua pada bulan Oktober. Analisis spasial digunakan untuk menganalisa distribusi tahunan dan musiman dari suhu permukaan laut serta anomali tinggi permukaan laut dari data satelit, juga dengan membandingkan antara data angin dan pola arus ITF dengan model numerik. Suhu permukaan laut di dapatkan dari data satelit NOAA/AVHRR dengan mengaplikasikan algoritma MCSST, anomali tinggi permukaan laut didapatkan dari data satelit Topex/Poseidon dan Jason-1 dengan mengaplikasikan interpolasi Inverse distance weigthed, sedangkan model numerik diturunkan dari model barotropik menggunakan Princeton ocean model.
Analisis spasial dari data satelit NOAA/AVHRR menunjukan penurunan suhu permukaan laut pada waktu el nino. Suhu permukaan laut juga berfluktuasi berkaitan dengan perubahan musim dimana suhu terrendah didapati pada musim timur sedangkan suhu terhangat didapati pada musim barat. Anomali tinggi permukaan laut juga memiliki fluktuasi yang mirip dengan suhu permukaan laut berkaitan dengan el nino maupun musim, hal inilah yang menyebabkan koefisien korelasi antara suhu peermukaan laut dan anomali tinggi permukaan laut relatif tinggi hingga 0,817104. Di sisi lain koefisien korelasi antara suhu permukaan laut dan anomaly tinggi permukaan laut musiman adalah 0.576469. berdasarkan pada pola arus yang ada, dapat diketahui bahwa laut Banda bagian barat dipengaruhi oleh ITF sedangkan bagian timur dari laut Banda dipengaruhi oleh musim.
Kata Kunci : Laut Banda, suhu permukaan laut, anomali tinggi permukaan laut, arus, el nino, arus lintas Indonesia, musim, model numerik.
INTRODUCTION
Background
window Algorithm), completed by seasonal variability of monsoon by analyze wind direction and wind speed.
Banda sea within rectangular region from 122.42 E to 131.47 E , Latitude 03.47 S to 07.65 S is subjected to winds from the west from November to March (northwest monsoon) and from the east from May to September (Southeast monsoons). Octobe1r. and April are transitional months.(Gordon and Susanto, 2001).
Monsoon can be defined as major wind system tha2t. seasonally reverses its direction (e.g., one that blows for six months from the northeast and six months from the southwest). The most prominent examples occur in Africa and southern Asia. 3.
The Indonesian seas provide a low-latitude pathway for the transfer of warm, low salinity Pacific waters into the Indian Ocean. The complex geographical of the region, with multiple narrow constrictions connecting a series of large, deep basins, leads to a circuitous pathway within the Indonesia seas. Enroute the Pacific inflow waters are modified before export to the Indian Ocean due to mixing, upwelling and air-sea fluxes. This kind o1f. ocean current namely Indonesian Through Flow (ITF).
The sea-level observation primitively uses the term of sea level anomaly (SLA). It is the range at a given instant from the se2a. surface to a reference ellipsoid. Since the sea depth is not known accurately everywhere, this reference provides accurate, homogeneous measurements.The sea level is simply the differenc3e. between the satellite height and the altimetric range.
Sea Surface Temperature (SST) has attracted attention for a long time because SST plays an important role on the global climate change. It’s well known that SST has positive correlation with ocean current even with local current. Most of previous studies focused on the global scale, but seldom on local areas. Ocean currents in the Pacific and Indian Oceans influence regional sea surface temperatures.
A hydrodynamic model is the basic component of all computational models of a current system. It can simulate a current field that acts as agent of movement of materials in internal waters of Indonesia. The hydrodynamic model is developed based on the conservation of momentum and mass which then is solved
Problems Formulation
The problems of this research can be formulated as :
How the pattern of inter-annual sea level anomaly and sea surface temperature concerning with ENSO by using satellite data
How the pattern of inter-seasonal sea level anomaly and sea surface temperature concerning with monsoon by using satellite data
By using Princeton Ocean Model (Barotropic Model), what will be the pattern of current in Banda Sea concerning with monsoon and ITF
Objectives
The objectives of this research are to study the dynamic of Banda sea including :
To determine the pattern of inter-annual sea level anomaly and sea surface temperature concerning with ENSO by using satellite data
To determine the pattern of inter-seasonal sea level anomaly and sea surface temperature concerning with monsoon by using satellite data
To determine the pattern of current in Banda Sea concerning with monsoon and ITF by using Princeton Ocean Model (Barotropic Model).
RESEARCH METHODOLOGY
Locations
This research will be carried out in Banda Sea within the rectangular region from 122.42 E to 131.47 E , Latitude 03.47 S to 07.65 S. in period of 1996 to 2006 consist of northwest monsoon, southeast monsoon, 1st transitional month in April and 2nd transitional month in October.
Research Material
numerically through various numerical methods. It calculates thTehis research applies remote sensing technology combined with
current velocity and water elevation at each grid that divides the water body representing the model area. -
Until now there are no such research of Monitoring ITF from space, according to correlation between dynamic sea leve-l anomaly (SLA) and sea surface temperature (SST) during circuitous pathway internal Indonesian seas and its differences affected by monsoon. -
This research is one of the effort to find out the process in this region simultaneously. In this study we try to analyze correlatio-n between sea surface temperature and sea level anomaly and its variability by monsoon based on remote sensing analyses of SLA-using Jason satellite data and SST using Advanced Very High Resolution Radiometer (AVHRR) data on board National Oceanic and Atmospheric Administration (NOAA) series satellite applying multi channel sea surface temperature algorithm (MCSST - Split
ocean modeling .
Annual sea surface temperature (SST) derived from data processing of NOAA/AVHRR satellite during 1996 – 2006
Annual sea level anomaly (SLA) derived from data processing of TOPEX/Poseidon satellite during 1996 – 2001 and Jason Satellite during 2001 - 2006
Seasonal sea surface temperature (SST) derived from data processing of NOAA/AVHRR satellite during 2006
Seasonal sea level anomaly (SLA) derived from data processing of Jason satellite during 2006
Current of Banda sea developed by applying Princeton Ocean Model with data input including Bathymetry data of Banda sea and data of wind speed and direction
Sea Surface Temperature
MCSST was used to get sea surface temperature from NOAA satellite data with some process as follow :
Format Conversion
Value Invert Rectification SST Equation Mosaicing Index Value
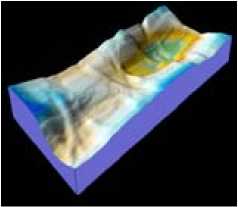
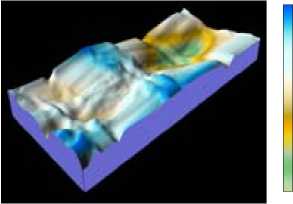
From above figure we know that during ENSO event, average SLA of Banda sea drop down until – 8.7 cm, while average SLA during non ENSO event is around -2cm until 2 cm.
0C

Sea surface temperature during ENSO event Sea surface temperature during non ENSO event
Sea level anomaly derived from altimetry satellite of Topex / Poseidon and Jason – 1
by applying inverse distance weighted interpolation. These process are as follow :
-
• Step 1 – Raw telemetry data and level 1 data
-
• Step 2 – Level 1 and level 2 geophysical data
-
• Step 3 – Data validation
-
• Step 4 – Interpolation
-
• Step 5 – Smoothing / Neighborhood Statistic
-
• Step 6 – Reclassify
-
• Step 7 – 3 Dimension analysis
Correlation Coefficient
Correlation coefficient of sea surface temperature and sea level anomaly calculated using Pearson’s equation (Rasdihan,2003)
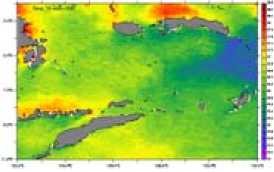
SST During ENSO event of Banda sea is very low about 24.4 ºC as seen in above figure, while during non ENSO event SST in Banda sea is around 26 ºC to 29 ºC.
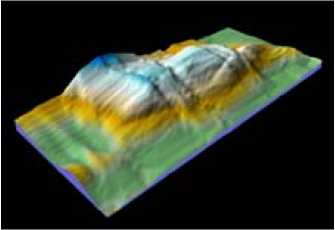
Sea level anomaly during northwest
10 Cm
9
8
7
6
5
4
3
2
1
0
-1
-12
-01 Cm
-2
-3
-4
-5
-6
-7
-8
-9
-10
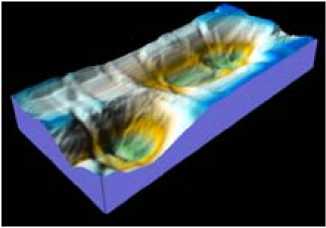
Sea level anomaly during southeast monsoon
Current Calculation by POM
Simulation process for tidal was started by preparing bathymetry data and elevation data of water surface at the open boundary area which was interpolated as a data input which was storage in the file form that will can be read at the simulation time occur. Those data will be simulated in the every cell. Calculation process while simulation start is a process recurrence each two seconds, where the result of previous calculation is used to data input for the next steps. Simulation process will stop until reach the limit of time that was decided at the beginning simulation.
Distribution of each arrow line form of current vector is indicated the integrated movement of sea water in Banda Sea. According to the bathymetry factor of dynamical calculation, current will give us better understanding correlation between Banda sea dynamic with monsoon.
RESULT
Monsoon affected SLA in Banda sea resulting fluctuation during northwest monsoon as convergent surface and become divergent during southeast monsoon as shown in above figure.
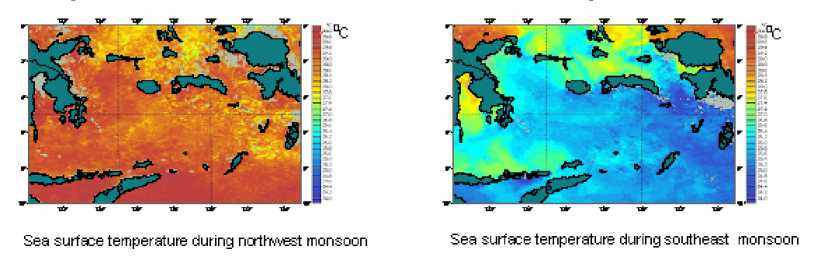
Sea surface temperature affected by monsoon. During northwest monsoon SST became warmer than SST during southeast monsoon. From above figure we found that red color of SST during northwest monsoon represent warm surface about 30 0C while during southeast monsoon SST in Banda sea is cooler about 25 0C represent by blue color.
Result of this research are dynamic of Banda sea consist of :
-02 Cm
-4
-6
-8
-10
-12
-14
-16
-18
-20
-22
-24
1.5 Cm
1
0.5
0
-0.5
-1
-1.5
-2.5
-3
-3.5
-4
-5
-6.
Sea level anomaly during ENSO event
Sea level anomaly during non ENSO event

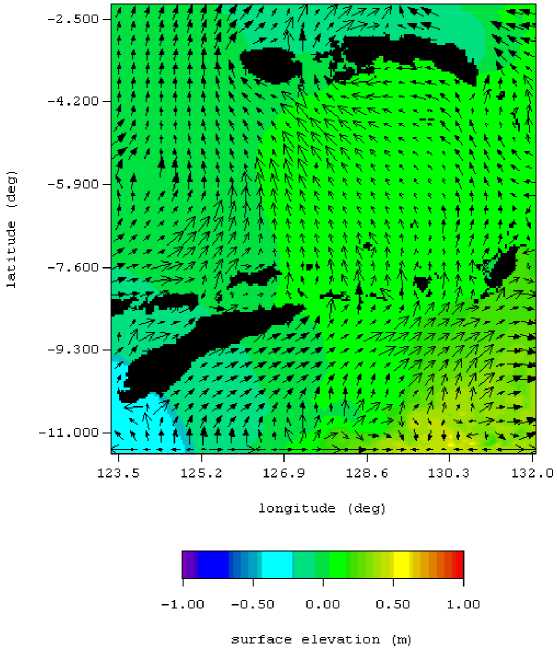
Current of Banda sea during northwest monsoon represent by eastward direction in the center region with velocity 0.01 – 0.20 m / second. This is parallel with wind direction of northwest monsoon combine with Banda sea bathymetry. Bottom friction during current development in Banda sea almost zero according to vertical column and surface gradient.
1.
2.
Banda sea Current during southeast monsoon
During southeast monsoon, pattern of current in Banda se3a. was change in both velocity and direction. Westward direction of wind collide with surface gradient resulting northward direction of current. Meanwhile in northern of this region current direction is turn westward caused by collide of current with shallow water
4.
DISCUSSION
Comparison between Annual Sea level anomaly dynamic with ENSO index show the strong correlation, Where sea level anomaly in 1997 is very low affected by ENSO event. Also sea level anomaly in 2002 when another ENSO event occurred. Different with in other not ENSO event year that sea level anomaly is fairly flat around zero centimeter .
Sea surface temperature of 1997 is very low up to 24.4 ºC according to ENSO event while in 2002 sea surface temperature in Banda sea up to 25.6 ºC when other ENSO event occurred.From the calculation of Pearson’s equation, finally we found strong
correlation between sea level anomaly and sea surface temperature with correlation index equal to 0.817104
sea level anomaly in Banda sea occurs in March to May while minimum SLA occurs in July to September. During northwest monsoon in November to March , wind in Banda sea generally blow eastward. According to wind direction and wind speed, sea level anomaly during November to March also move eastward. On the other side during May to September wind blow westward. That’s is the reason why displacement of SLA during this period also move westward.
Sea surface temperature in Banda sea in 2006 is dynamic according to northwest and southeast monsoon. Maximum sea surface temperature occurs in December and January up to 30.2 °C in line with northwest monsoon . Minimum sea surface temperature is occurs in August up to 24.2°C when Banda sea get southeast monsoon. Average of Sea surface temperature in Banda sea during 2006 is in range of 25.5°C to 30.0°C.
From the calculation of Pearson’s equation, finally we found weak correlation between sea level anomaly and sea surface temperature with correlation index equal to 0.576469.
Pattern of Banda sea Current characterized by significant differences between southeast monsoon northwest monsoon. Bathymetrical magnitude of Banda sea that reach average more than 2000 meter or event 4000 meter develop low speed of current velocity, but the reversely direction and speed of wind develop different pattern of current in Banda sea.
7. Conclusion
Based on the result of this research, the conclusion can be suggested as follows:
Sea level anomaly and sea surface temperature is decrease according to ENSO event, such as descrease of SLA and SST during ENSO event in 1997 , 2002 and 2004
Sea level anomaly and sea surface temperature is change according to Monsoon that reverse every 6 (six) month. SST and SLA get maximum level during northwest monsoon in November to March and get Minimum during Southeast monsoon in May to September.
There are strong correlation coefficient between annual Sea level anomaly and annual Sea Surface Temperature with index value up to 0.817104. on the other side correlation coefficient between seasonal Sea level anomaly and Seasonal Sea Surface Temperature is 0.576469.
Western part of Banda sea is strongly affected by ITF while eastern part of Banda sea is strongly affected by monsoon.
REFERENCE
Bishop, J. M.1984. Applied Oceanography. A Wiley-Interscience Publication. New York: Jhon Wiley and Sons.
Cardon, K., Goryl, P., Scharroo, R., Benveniste, J., 1999. 1997/98 El Niño observed by ERS. Proceeding of European Symposium on Atmospheric Measurements from Space ESTEC, Noordwijk, The Netherlands. 18-22 January 1999
Chelton, D. B., Ries, Jhon, C., Haines, J. Bruce., Fu, Lee, Leng., Callahan, Philip, S. 2001. Satellite Altimetry. California: Academic Press
Chung, K. P., and Siegfried, D. S. 1994. On the Nature of the 1994 East Asian Summer Drought. (online)[cited 2007 Feb 12] available from: URL : http://csc.gallaudet.edu/monsoon/impact/drought02.h tml
Cracknell, A. P. 1997. The Advanced Very High Resolution Radiometer. London: Taylor & Francis Ltd.
England, M. H., and Huang, F. 2004. Notes And Correspondence On The Interannual Variability Of The Indonesian Throughflow And Its Linkage With Enso. J. Climate, vol 18.(online)[cited 2007 Jan 30] available from : URL : http://web.maths.unsw.edu.au/~matthew/EH-2005.pdf
Fadli, S. Molcard, R. M, Feux. 2003. Monitoring Indonesian Through Flow Variability by Coastal Acoustic Tomography System in The Lombok Strait . Proceeding of International Seminar on Marine and Fisheries. Jakarta 15 – 16 December 2003. ISBN 979-98165-1-3.
Gill, A. E., 1980. Some Simple Solutions for Heat Induced Tropical Circulation. Quart. J. Roy. Meteor. Soc. 1006, 447 - 462
Gordon, A. L., and Susanto, R. D. 2001. Banda Sea-Surface Layer Divergence. J. Ocean Dynamic. Vol 52: 2-10.
Hadi,S. 2003. Role of Numerical Modeling in Coastal Management. Proceedings Symposium on Coastal Zone Management. LPPM-Institut Teknologi Bandung. 28 July 2003
Hasanuddin, Z, A. 1987. Geodesi Satelit. Jakarta: PT Pradnya Paramita.
Hendrawan, I. Gede. 2005. Barotropic model to calculate water circulation in benoa bay bali (Thesis). Denpasar : Udayana University.
Indoo Project. 2005. Indonesia Ocean Observing System INAGOOS. Jakarta: Ministry of Marine Affairs and Fisheries.
Keshavamurty, R.N., 1982. Response of The Atmosphere to Sea Surface Temperature Anomalies Over the Equatorial Pacific and Teleconnections of the Southern Oscillation. J. Atmos. Sci., 39, 1241 - 1259 .
Kunte,P.D. 2003. Study of Sediment Transportation in The Bay of Kachchh, Using 3D Hydro-dynamic Model Simulation and Satellite Data (Doctor Dissertation). Japan : Chiba University.
LAPAN. 2003. Teknologi Penginderaan Jauh dalam Pengelolaan Wilayah Pesisir dan Lautan. Jakarta : Pusat Pengembangan Pemanfaatan dan Teknologi Penginderaan Jauh.
Lillesand, T. M., and Kiefer, R. W. 1994. Remote Sensing and Image Interpretation, Third Edition. Canada: John Wiley & Sons,Inc.
NASA. 2006. El Nino - and What is the Southern Oscillation Anyway. (online)[cited 2007 Feb 12] available
from : URL :
http://kids.earth.nasa.gov/archive/nino/intro.html
Nicholls, N. 1983. The Southern Oscillation and Indonesian Sea Surface Temperature. J. Monthly Weather Review vol 112
Ramming,H.G., and Kowalik, Z. 1980. Numerical Modeling of Marine Hydrodynamics Application to Dynamic Physical Processes. New York : Elseiver Scientific Publishing Company.
Rasdihan. 2003. Statistik Terapan. Jakarta: Gramedia Group.
Song, Q., and Gordon, A. L. 2004. Significance of the vertical profile of the Indonesian Throughflow transport to the Indian Ocean. Geophysical Research Letters, Vol.
31.(online)[cited 2007 Jan 26] available from : URL : http://www.ideo.columbia.edu/res/div/ocp/people/ag ordon/publication/Song_Gordon_GRL.pdf
Sprintall, J., Gordon, A. L., Murtugundde, R., Susanto, R. D. 2004. INSTANT : A New International Array to Measure The Indonesian Throughflow. J. EosVol 85 no 39.(online) [cited 2007 Jan 30] available from : URL :
http://www.ideo.columbia.edu/dwipapers/sprintall_et al_eos_2004.pdf
Stone, D.1997. Biodiversity of Indonesia. Singapore: Archipelago Press. USRA. 2006.What is El Niño - Southern Oscillation (ENSO)?. (online) [cited 2007 Feb 12] available from URL :
http://ess.geology.ufl.edu/usra_esse/el_nino.html
Vranes, K., and Gordon, A. L. 2005. Comparison of Indonesian Throughflow transport observations, Makassar Strait to eastern Indian Ocean. Geophysical Research Letters, Vol. 32.(online)[cited 2007 Jan 26] available from : URL :
http://sciencepolicy.colorado.edu/admin/publication_ files/resource-2023-2005.54.pdf
Wolter, K. 2003. El Nino and California 2002-2003. California application program. (online) [cited 2007 Feb 12] available from : URL:
http://meteora.ucsd.edu/cap/elnino_calif_2002.html
Wyrtki, K. 2005. Discovering the Indonesian Through flow .J. Oceanography vol18.no 4.
91
Discussion and feedback