PREDICTION OF MONTHLY RAINFALL BASED ON THE TRMM PRECIPITATION RADAR SATELLITE DATA OVER REGION OF INDONESIA
on
ECOTROPHIC • 5 (2) : 129 - 134
ISSN: 1907-5626
PREDICTION OF MONTHLY RAINFALL BASED ON THE TRMM PRECIPITATION RADAR SATELLITE DATA OVER REGION OF INDONESIA
R. Prasetia1)2), T. 0SAWA2), IW. S.ADNYANA2)3)
1) Indonesian Meteorology, Climatology, and Geophysics Agency (BMKG) Bali 2! Center for Remote Sensing and Ocean Science, Udayana University
3) Environmental Research Center, Udayana University
ABSTRAK
Kepulauan Indonesia merupakan wilayah yang mendapatkan curah hujan sepanjang tahun, namun jaringan stasiun pengukuran curah hujan di wilayah ini tidak sepadat atau sebanyak seperti di benua besar lainnya. Oleh karena itu, satelit pengamatan curah hujan merupakan solusi terbaik untuk pengamatan dengan cakupan temporal dan spasial yang memadai. Tujuan dari penelitian ini adalah untuk validasi dan prediksi curah hujan bulanan berdasarkan data satelit Tropical Rainfall Measuring Mission Precipitation Radar (TRMM PR). Data yang digunakan adalah curah hujan bulanan dari satelit TRMM PR Level3A25 dan in situ data dari BMKG selama periode tahun 2004 - 2008. Hasil validasi menunjukkan bahwa data satelit memberikan nilai lebih rendah dari data observasi, kecuali di wilayah anti-monsunal (C) dimana data satelit memberikan nilai lebih besar dari data observasi. Pola time series rata-rata hujan bulanan berdasarkan 39 lokasi selama periode lima tahun (2004-2008) menunjukkan pola yang sangat mirip dengan data observasi, dengan memberikan nilai korelasi yang tinggi (r = 0,82-0,98) dan RMSE (Root Mean Squared Error) kurang dari SO (mm/bulan). Hasil prediksi curah hujan bulanan dengan menggunakan metode ARIMA (Autoregressive integrated moving average) menunjukkan nilai yang lebih besar dari data observasinya dan pola curah hujan bulanannya untuk periode satu tahun (Januari-Desember 2009) memiliki pola kemiripan dengan data observasi.
Kata kunci: prediksi, hujan, Tropical Rainfall Measuring Mission Precipitation Radar (TRMM PR), ARIMA (Autoregressive integrated moving average)
INTRODUCTION
The Indonesian archipelago is characterized as a huge amount of rainfall throughout the year, and plays the essential role as a center ofatmospheric heat source of earth climate system (Ramage, 1971). The information about the global rainfall is necessary for the study ofclimatology, the prediction offlood and the problem of water resource.
In general, rain gauge observations yield relatively accurate point measurements of rainfall but also suffer from sampling error in representation areas means. Also, they are not available over most oceanic and undeveloped land areas (Xie and Arkin, 1996). Measured data from rain gauge networks are still conventionally the most reliable source ofarea averaged rainfall for the land surface ofthe earth. However, rain gauge measurement networks at Indonesian archipelago are not as dense or regular as in other major continent. Therefore, satellite observations of rainfall are the best solution for adequate temporal and spatial coverage. Moreover, the result of satellite observation combined with the observation data inland and oceanic is so important (Huffman et al., 1995).
Satellite observations have an advantage over radar and rain gauge data because of their global spatial coverage. However, the relationship between satellite-
measured radiances and rainfall reaching the ground
is difficult to determine, so it is important to quan-
tify the magnitudes of errors of the satellite estimates
(McCollum, et al., 2002). Satellite-based precipitation
products could provide very high temporal (3 hourly) and spatial ( 0.5° latitude x 0.5° longitude grid size) res-
olution. Nevertheless, they are subject to larger biases and stochastic errors and need to be adjusted to in situ observations (Barret et al., 1994; Rudolf et al., 1996).
The Tropical Rainfall Measuring Mission (TRMM) is a joint mission between US and Japan, and it is the first satellite earth observation mission to moni-
tor tropical rainfall, which closely influences to global climate and environment change. The main objective satellite was to provide a better understanding of precipitation structure and heating in the tropical regions of the earth (Simpson et al., 1996). Short and North ( 1990) and Shin et al. (2000) noted that one of the advantage ofTRMM is be that sampling errors and related biases (e.g., beam filling errors) can be reduced by its low latitude (350 ^) and low inclination (35°). A comparison ofa 2-year ( 1998 and 1999) monthly rainfall data derived from the TMI, PR, TRMM combined algorithm, and TMI emission algorithm were carried out by Shin et al. (2001). The results showed that for the global and zonal means, the TMI rain rates were the largest and TRMM PR estimates were the lowest.
Aldrian and Susanto (2003) made the distribution pattern of rainfall in the Indonesian region with multiple correlation method,where Indonesian rainfall area is divided into 3 areas, namely the region Monsoonal Type (A), Semi-Monsoonal type (B) and region anti-monsoonal type (C). Region A has one peak and one valley rainfall and influenced by two monsoon systems of the Northwest Monsoon (wet seasons) from November to March (NDJFM) and the Southeast Monsoon (d^ seasons) from May to September (MJJAS). Area B has two peaks of rainfall in October-November (ON) and March-May (MAM). Area C has one peak and one valley rainfall, namely June-July and Novem-ber-Februa^ (NDJF)
In this work, attempts have been made to compare the rainfall determined by TRMM PR products with the values of ground-based rain gauge over Indonesia. The aim of this research are : (1) To evaluate the validation of monthly rainfall over region of Indonesia based on the TRMM PR satellite data and develop a prediction of monthly rainfall; (2) To evaluate the accuracy of prediction of monthly rainfall over region of Indonesia based on the TRMM PR satellite data.
RESEARCH METHODS
The research location was the Indonesia archipelago. It was located in 92.S0°E - l4 l.20°E and 8.14∙°N - 12.0°S (Figurel). Distribution of research locations were 27 stations, located in parts of Indonesia which covers the monsoonal types(A) (Jakarta, Bogor,Bandung,Jatiwangi, Cilacap, Tegal,Semarang, Surabaya, Kalianget, Denpasar, Ampenan, Kupang, Manado,lJjungpandang,Balikpapan,Samarinda,Ban-jarmasin, Palangkaraya,Biak,Wamena,Jayapura,Mer-auke, Jambi, Palembang, Bengkulu, and Lampung), 7 stations located at the semi-monsoonal types(B) (Tarakan, Sintang, Pontianak, Banda Aceh, Medan, Pekanbaru, and Padang) and 5 stations located at an-
ti-monsoonal types(C) (Ambon, Ternate, Gorontalo, Palu, and Kendari).
With material used are monthly rainfall derived from Satellite TRMM PR Level3A25 and in situ data from rain gauge measurement by BMKG in 2004 to 2008.
Three types of analysis conducted on monthly rainfall data, that is; point by point analysis, time series average of all point, and monthly average of all point. Statistical routines could be used to analyze the relationship of the TRMM product to rain gauge data. The measures of the closeness of the satellite estimates to the observed values were the linear correlation coefficient (r), mean bias error (MBE) and the root mean square error (RMSE) defined as follows (Feidas, 2010):
∑(S -S)(Gi -G)
r = _ (1)
MBE= !⅛(ξ -G,.) (2)
n i=I
RMSE =
v(! ∑ ( S; -Bias -G;)2 )
(3)
Where Si are the estimated values, Gi are the reference gauge values, aS and aG are their standard deviations, and n the number of data pairs
This analysis is performed to determine the relationship between monthly rainfall from satellite TRMM PR and in-situ data. With the correlation analysis can identify how the validity of rainfall data from satellite TRMM PR. The RMSE is used to find out how much the average error value between the data from satellite TRMM PR and in-situ data. Mean bias error (MBE) is a good measure of model bias and is simply the average of all differences in the set.
Furthermore, ARIMA method was used to prediction of monthly rainfall over region of Indonesia.
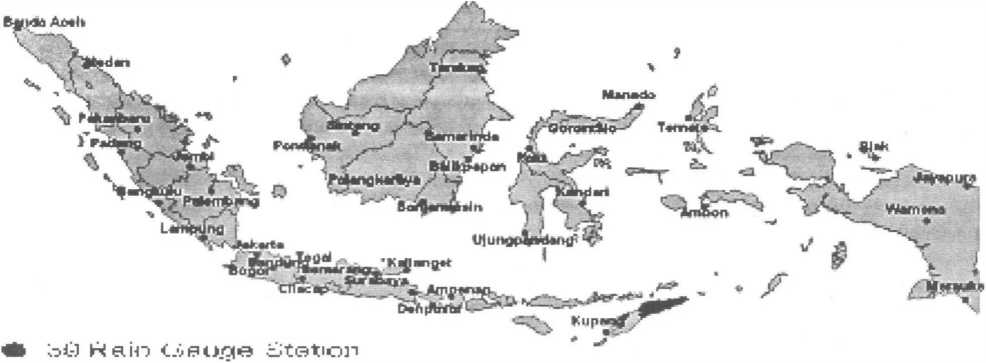
Figure 1. Research Location
ARIMA (Autoregressive Integrated Moving Average) model introduced by Box andJenkins ( 1976) includes autoregressive as well as moving average parameters, and explicitly includes differencing in the formulation of the model. Specifically, the three types of parameters in the model are: the autoregressive parameters (p), the number ofdifferencing passes (d), and moving average parameters (q).Autoregressive process (p) can be expressed by the equation:
yt =µ+<!>1.Yt-1 + <!>2.Yt-2 + ··· ··· + <j)p.Yt-p +et (4)
Moving average process (q) can be expressed by the equation:
yt =µ+et - 81.et-l - 82.et-2 - - eq.et_q (5)
Where Yt is dependent variable, Yt_1Yt_2_....Yt-p and et-l etl ... et-q are independent variables, µ _is the constants, cj>1 cj>2 <!>p are autoregressive coefficient, 8182... eq are moving average coefficient, et and et_q are error value
RESULTS AND DISCUSSIONS
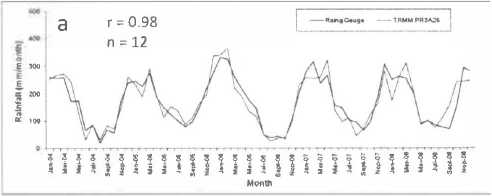
In the monsoonal type, the time series of monthly rainfall relationship showed 17 point gauges (r=O.S1-0.73) and 10 point gauges in low correlation (r=0.11-0.33), and RMSE based on 27 point gauges were more than 100 (mm/month). The average time series of monthly rainfall from TRMM PR3A25 was very slightly than monthly gauge data, where the average time series monthly rainfall were 170.0 (mm/month) and 170.1 (mm/month), respectively. The pattern of average time series monthly rainfall was quite similar with gauge data, and the coefficient correlation was high correlation (r=0.94), and RMSE was 35.1 (mm/ month)(Figure 2a). Meanwhile, monthly average rainfall pattern of TRMM PR showed very good agreement with the ground reference giving high correlation (r=0.98) and RMSE was 19.9 mm/month (Figure 2b).
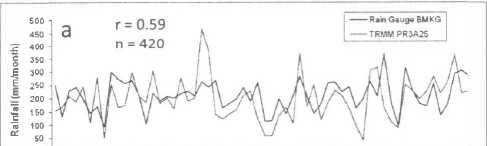
In the semi-monsoonal type, time series ofmonthly rainfall point by point relationship showed two point gauges in medium correlation (r=0.51-0.52) and five point gauges in low correlation (r=0.12-0.29), and generally, RMSE based on seven point gauges were more than 100 (mm/month). The average time series ofmonthly rainfall from TRMM PR3A25 was slightly than monthly gauge data, where the average time series monthly rainfall were 199.9 (mm/month) and 213.0 (mm/month), respectively. The pattern of average time series monthly rainfall was similar to gauge data and the coefficient correlation was medium correlation (r=0.59) and RMSE was 76.4 mm/month (Figure 3a). Furthermore, the monthly average rainfall pattern of TRMM PR data showed very good agreement with the ground reference data (r=0.82) and RMSE was 33.S (mm/month) (Figure 3b).
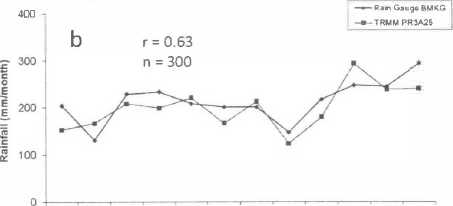
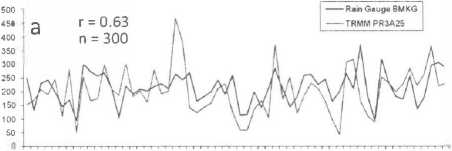
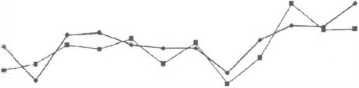
In anti-monsoonal type, time series of monthly rainfall point by point relationship showed 2 location gauges in medium correlation (r=0.47-0.58) and 3 location gauges in low correlation (r=0.11-0.33), and RMSE were more than 100 (mm/month). The average time series of monthly rainfall from TRMM PR was greater than monthly gauge data, where the average time series monthly rainfall were 163.9 (mm/ month) and 148.28 (mm/month), respectively. The figure indicated the pattern of average time series monthly rainfall was similar to gauge data and the coefficient correlation was in medium correlation (r=0.63) and RMSE was 80.8 (mm/month) (Figure 4a). The monthly average rainfall pattern of TRMM PR data showed very good agreement with the ground reference data (r=0.87) and RMSE was 32.9 mm/month (Figure4b).
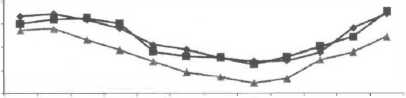
The results ofprediction monthlyrainfall by ARIMA method showed an overestimated condition (28.8% in monsoonal type, 43.6% in semi-monsoonal type, and 76.1% in anti-monsoonal type). The coefficient correlation of prediction monthly rainfall point by point based on rain gauge data (period 2004 to 2008) in monsoonal type (A) were 5 location in low (r=0.32 to 0.43), 15 location in medium(r=0.51 to 0.68), and 7 location in high (r=0.78 to 0.87), while the correlation of prediction monthly rainfall based on TRMM PR data were 11 location in low correlation, 8 location in medium correlation, and 8 location in high. And in general, the value of RMSE were SO to 150 (mm/ month). The coefficient correlation of monthly rainfall average was 0.97 (rain gauge) and 0.95 (TRMM PR3A25) with RMSE were 19.7 (rain gauge) and 16.0 (TRMM PR3A25) (FigureSa).
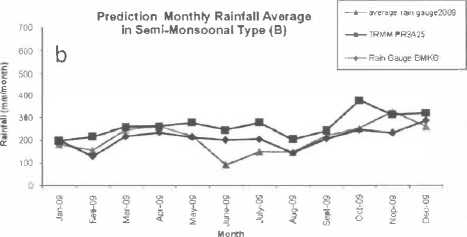
Furthermore, in the semi-monsoonal type (B), the coefficient correlation of prediction monthly rainfall based on rain gauge data (period 2004 to 2008) were 4 location in low (r=0.11 to 0.33), and 3 location in medium (r=0.51 to 0.70), while the correlation of prediction monthly rainfall based on TRMM PR data were 6 location in low (r=0.01-0.43), and 1 location in medium correlation (r=0.7). RMSE were SO to 150 (mm/month). The coefficient correlation of monthly rainfall average were 0.65 (rain gauge) and 0.60 (TRMM PR3A25) with RMSE were 46.S (mm/ month) (rain gauge) and 88.5 (mm/month) (TRMM PR3A25) (FigureSb).
In the anti-monsoonal type (C), the coefficient correlation of prediction monthly rainfall based on rain gauge data (period2004 to 2008) were 3 location in low (r=0.19 to 0.29), and 2 location in medium (r=0.55 and 0.61), while the correlation of prediction monthly rainfall based on TRMM PR data were 4 location in low (r=0.14-0.28), and I location in medium correlation (r=0.61). And generally, RMSE were 50 to 100 (mm/month). The coefficient correlation of
t
monthly rainfall average were 0.18 (rain gauge) and 0.28 (TRMM PR3A25) with RMSE were 64.S (rain gauge) and 60.1 (TRMM PR3A2S)(Figure5c).
The distribution ofmonthly rainfall by satellite data showed an underestimated condition in monsoonal type and semi-monsoonal type. It was evident from the negative bias error, where the MBE were -32.5% and -45.7%, respectively. Meanwhile, in anti-monsoon-al type showed an overestimated condition, the MBE was 27.19%. As-syakur, et al., (2010) also showed that the value TRRM product was underestimated than
-RainGauge ----TRMMPRJA25
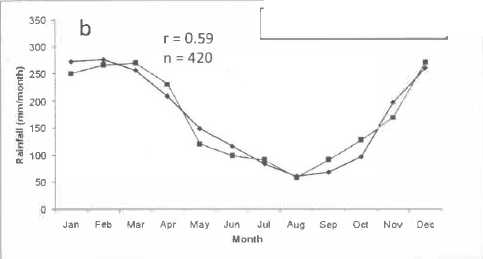
Figure 2 a) Average time series monthly rainfall and b) Monthly average rainfall pattern by TRMM PR and rain gauge (period 2004-2008) in Monsoonal Type (A).
jan feb mar apr may iun JUI aug sep oct nov dee
Month
Figure 3 a) Average time series monthly rainfall b) Monthly average rainfall pattern by TRMM PR and rain gauge (period 2004-2008) in Semi-Monsoonal Type (B)
fff&Wf ^P/^^//#'& /V Sf
Month
∕∕ /Z/Z Z'ZZ/##o^ Z Z o/ ZZZZ
Month
400
P 300
C o
E
I 200
1
£ 100
b
r = 0.87
n = 12
-+-RalnGaugaBMKG
----TRMM PR3A.25
9
jan feb mar apr may JUn jut aug sap oct nCN dee
Month
Figure 4 a) Average time series monthly rainfall b) Monthly average rainfall pattern by TRMM PR and rain gauge (period 2004-2008) in Anti-Monsoonal Type (C)
700
600
I MO
! 400 g
⅛ l∞
^ m
100
O
Prediction Monthty Rainfall Average in Monsoonal Type (A)
a
---r- aver1ge ram !jj3Uge:!009
-TRMMPRJA.25
-- Ram Gauge BMKG
® ≡ s
• O O
t i $
Month

i

700
Prediction Monthty Rainfall Average in Anti-Monsoonal Type (C)
600
f ^
T 4∞ g • lOO
i ^
1∞
3
c
---...-averagerall'lg:auge2000
^ TRMM PR3A25
-Ram Gau;ie BMKG

Month
Figure 5 Prediction of monthly average rainfall pattern by TRMM PR and rain gauge (period January-December 2009) a) in Monsoonal type b) in Semi-monsoonal type c) in Anti-Monsoonal type
monthly gauge data over Bali Island. Islam and Uyeda (2007) also showed that the TRMM products underestimated rainfall during monsoon in the heavy rainfall regions of Bangladesh.
The pattern of average time series monthly rainfall was similar to gauge 'data. This situation indicates TRMM PR3A25 products can be used to determine monthly climatic characteristics. The relationships of the monthly average rainfall measured by TRMM PR3A25 and rain gauge showed very good agreement with the ground reference giving high correlation (r=0.82-0.98) and RMSE was less than 50 (mm/ month). The pattern of monthly rainfall between TRMM PR and rain gauge data was quite similar which indicate that TRMM PR3A25 can be used to find rainfall patterns in the locations that do not have a rain gauge.
The pattern of prediction monthly average rainfall measured by TRMM PR and rain gauge were similar to gauge data, and the relationships showed high correlation (in monsoonal type), medium correlation (in semi-monsoonal type), and low correlation (in anti-monsoonal type). Arief et al., (2008) also showed that the result of prediction monthly rainfall by ARIMA method based on TRMM 3B43 data were in high correlation in Jakarta (r=0.77) and medium correlation in Pontianak (r=0.49).
CONCLUSIONS AND SUGGESTION
The TRMM PR3A25 data showed an underestimated condition than the gauge data in the monsoonal and semi-monsoonal type while in the anti-monsoonal type showed the satellite gave an overestimated condition. The validation of monthly rainfall by satellite showed very good agreement with gauge data over Indonesian, on monthly average rainfall. On the other hand, low-medium correlation was shown in the results of point by point. This indicates that point by point analysis is poorly to be adequately served as a stand-alone monthly climate product. Meanwhile, if the TRMM PR3A25 data are used to cover large areas by averaging, this product is capable to estimate variability of monthly rainfall.
The quality of the satellite rainfall measurements needs to be evaluated continually. Further studies require be validating on seasonal and annual timescales, and also comparing with the TRMM PR3B43 product.
REFERENCES
Aldrian, E., and D.R, Susanto, 2003. Identification of Three Dominant Rainfall Regions Within Indonesia and Their Relationship to Sea Surface Temperature. Int. ]. Climatol., 23, 1435-1452.
Arief. S., Halimurahman., H. Teguh, 2008. Aplikasi Satelit TRMM untuk prediksicurahhujan di wilayahIndonesia. Prosiding Workshop Aplikasi sains Atmosfer clan Iklim, LAPAN, Bandung.
As-syakur, A.R., T. Tanaka., R. Prasetia., IK. Swardika., and IW Kasa. 2010. Comparison of TRMM Multisatellite Precipitation Analysis (TMPA) Products and DailyMonthly Gauge Data Over Bali Island. International Journal ofR emote Sensing. In Review
Barrett, E. C.,J. Doodge, M. Goodman,J.Janowiak, E. Smith, and C. Kidd, 1994. The First WetNet Precipitation Intercomparison Project (PIP-1). Remote Sens.
Rev., 11, 49-60.
Box, G andJenkins, G (1976) Time seriesanalysis: Forecasting and control, San Francisco: Holden-Day
Feidas, H. 2010. Validation of satellite rainfall products over Greece. Theoretical and Applied Climatology, 99. 193-216
Huffman, GJ., R.F. Adler, B. Rudolf, U. Schneider, and P.R. Keehn. 1995: Global precipitation estimates based on a technique for combining satellite-based estimates, rain gauge analysis, and NWP model precipitation information.]. Climate, 8. 1284-1295.
Islam, M.N., and H. Uyeda. 2007. Use ofTRMMin determining the climatic characteristics of rainfall over Bangladesh. Remote Sensing of Environment, 108. 264-276
McCollum,J. R., and R. R. Ferraro, 2002. Next generation of NOAA/NESDIS TMI, SSM/I, and AMSR-E microwave land rainfall algorithms. J. Geophys. Res., 108, 73-82.
Ramage, C.S. 1971. Monsoon Meteorology. International Geophysics Series, Vol. 15, Academic Press Inc. New York.
Rudolf, B., H. Hauschild, W Rueth, and U. Schneider, 1996. Comparison ofraingauge analyses, satellite-based precipitation estimates and forecas model results.Adv. Space Res., 18 (7), 53-62.
Short, D. A., and G. R. North, 1990. The beam filling error in ESMR- observations of GATE rainfall.]. Geophys. Res., 95, 2187-2194.
Shin, D., and G. R. North, 2000. Errors incurred in sampling a cyclostationary field.]. Atmos. Oceanic Technol., 17, 656-664.
Shin, D., L. S. Chiu, and M. Kafatos, 2001. Comparison of monthly precipitation derived from the TRMM satellite. Geophys. Res. Lett., 28, 795-798.
Simpson,]., C. Kummerow, W-K. Tao, and R. F. Adler, 1996. On the Tropical Rainfall Measuring Mission (TRMM). Meteor. Atmos. Phys., 60, 19-36.
Xie, P., and P.A. Arkin, 1996. Analyses ofglobalmonthly precipitation using gauge observations, satellite estimates, and numerical model predictions. J. Climate, 9, 840-858.
133
Discussion and feedback