STUDY OF POTENTIAL FISHING GROUND FOR SKIPJACK TUNA (Katsuwonus pelamis) in SAWU SEA EAST NUSA TENGGARA PROVINCE USING REMOTE SENSING SATELLITE AND FISHERY DATA
on
ECOTROPI-UC • 7 (l) : 35 · 39
ISSN: 1907-5626
STUDY OF POTENTIAL FISHING GROUND FOR SKIPJACK TUNA (K.ats.,wonus pelamis) in SAWU SEA EAST NUSA TENGGARA PROVINCE USING REMOTE SENSING SATELLITE AND FISHERY DATA
IRMA YULIAMAl>JtD l)l), TAKAHIRO 0SAWA2l, IWAYAN ARTH.ANA3)
-
1) Schrnl of Marine and Fishery, Majene, Wixt Sulawesi
-
2) Centerf or Remote Sensing and Ocean Sciences (CR.SOS) Udayana University
-
3) Enuironntental Research Centre. Udoyana Uniuersiry
ABSTR.AK
Wilayah perairan Jaut Indonesia memiliki kandungao sumberdaya alam khususnya sumberdaya hayati (ikan) yang berlimpah dan beraneka ragam. Cakalang merupakan salah satu ikao pelagis besar yang memiliki nilai komersial yang tinggi yang dapat ditemukao di perairan bagian tirnur Indonesia, khususnya di perairan Kupang, Provinsi Nusa Tenggara Timur.
Penelitian ini menggunakan data kornposit rata-rata dari Suhu Perrnukaan Laut (SPL), konsentrasi Klorofil-a, dao Photosyntetically Active Radiation (PAR) yang di peroleh dari satelit Aqua MODIS tahun 2006, dan data kecepatao angin yang diperoleh dari satelit Quickseat. Vertically Generalized ?roduction Model (VGPM) di populerkan oleh Behrenfeld and Falkowski (1997) digunakan untuk memperkirakan Produklivitas Primer (PP) di perairan, sedangkan Produksi Ikan dapat diperkirakan dengan menggunakan formula yang dipopulerkan oleh Pauly and Christensen (1995). Data produksi ikan ynng diperoleh dari Dinas Kelaulan dan Perikanan Provinsi Nusa Tenggara Timur pada tahun 2006 adalah 4.685,75 ton/tahun. Daerah tangkapan ikao yang potensial untuk Cakalang (Katsuwonus pelamis) dibagi ke dalam musirn Timur, musim Peralihan 11, dan musim Barat Pada musim barat, daerah tangkapan ikan rendah. Daerah tangkapan ikan yang baik yang diamati terdapat di bagian baral dari Laut Sawu.
Tangkapan ikan tertinggi diperkirakan terjadi sepanjang musim Timur dan Peralihao II. Hasil dari Produk'tivitas Primer memperlihatkan pola yang sama dengan Klorofil-a. perkiraan Produksi Ikan di Laut Sawu adalah 6.563,08 lon/tahun. Dengan membandingkan data perkiraan produksi ikan dengan data produksi ikan dari Dinas Kelautan dan Perikanan menunjukkan tiogkal pemanfaatan sebesar 71.39 96 di Laut Sawu.
Korelasi aotara SPL dan tangkapan ikan adalah -0,25 dan korelasi antara klorofil-a dan tangkapan ikan adalah 0,12. korelasi antara Klorofil-a dan SPL di Laut Sawu menuojukkan nilai yang berbanding terbalik (nilai koefisien korelasi -0,24 dan rnempunyai pola yang berbeda dan bertentangan). Korelasi antara Produktivitas Primer (PP) dan Klorofil-a menunjukkan hubl\Ogan yang sangat kuat yaitu 0,98 (R^o.98).
Kata kunci: Laut Sawu, Cakalang (Kaisuwonus pelamis), Produktiuitas Primer, Produksi Ikon, M11sim.
ABSTRACT
Indonesia's marine waters contain natural resources, especially biological resources, such as fish abundant and diverse. Skipjack tuna is one of the pelagic fish that have a high commercial value and eao be found in the sea water of the eastern part of Indonesia, especially in the sea waler of Kupang, East Nusa Tenggara Province.
This study employed the average composite data of Sea Surface Temperature, Chlorophyll-a and Photosyntetically Active Radiation (PAR) are got from Aqua MODJS satellite in 2006, and wind speed data from Quickscat satellite. Vertieally Generalized Production Model (VGPM) was proposed by Behrenfeld and Falkowski (1997) was used to estimate the Primary Production (PP). The Fish Production was estimated using the formula wa.^ proposed by Pauly and Christensen (1995). Fish Production in-situ data were provided by Ministry of Ma,ine and Fisheries East N\lsa Tenggara Province in 2006 that was 4,685.75 ton/year. Potential fishing zone for Skipjack Tuna (Katsuwonus pe/amis) was divided inLo Southeast, Transition II, and Northwest monsoon. At Northwest monsoon was low potential fishing ground. The good fishing zone was observed in western part of Sawu Sea
The Estimation of higher fish catching estimated during Southeast and Transition II monsoon. The results of Primary Production (PP) showed the same patterns with Chlorophyll-a. The estiination of fish production in Sawu Sea was 6,563.08 ton/year. With comparing between fish production estimation and fish production from Ministry of Marine and Fisheris data showed the utilization rate was 71.39 % in Sawu Sea.
The correlation between SST and fish catching was low (-0.25) and the correlation between Chlorophyll-a and fish catching in Sawu Sea was low (0.12). The correlation between Chlorophyll-a and SST in Sawu Sea showed inversely relationships (correlation coefficient of -0.24 and has a different and opposite patterns). The correlation between Primary Production (PP) and Chlorophyll a showed close relationships of 0.98 (R=o.98}.
Key words: Sawu Sea, Skipjack nma (Katsuwonus pelamis), Primary Production, Fish production, Monsoon
INTRODUCTION
Utilization of Indonesia's marine fish resources in the various regions are not evenly distributed. In some areas of open sea water, there are still great oppo,tunities for development of its utilization, while some other areas has reached a solid state fishing or overfishing. The main problem encountered is the effort to optimize the catch of pelagic fish; especially limited data and information of oceanographic conditions that are strongly associated with the potential fishing. Fishing boat out from the base rather than to capture but to find the location to fishing so that the Fisherman go for fishing at an uncertainty potential locations of fishing ground. Sea water habitats are suitable for large numbers of pelagic fish populations, especially the large pelagic fish species, such as Skipjack tuna (Katsuwonus pe/amis). Skipjack tuna is one of the pelagic fish that has high commercial value and are found abundant in the sea water of the Eastern part of lndonesia, especially in Lhe waters of Kupang, East Nusa Tenggara Province. TI1e aims of this research are to estimate the fishing ground distribution of Skipjack tuna during monsoonal in Sawu Sea. to estimate lhe correlation between fish catching of Skipjack Tuna (Katsuwonus pelamis) and the satellite data of Chlorophyll-a and Sea Surface Temperature in Sawu Se, and to estimate fish production by primary production.
RESEARCH METHODOLOGY
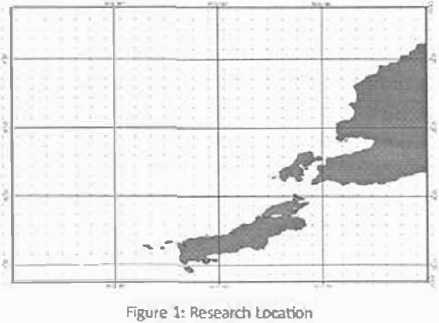
Research location
Sa"'l.1 Sea is part of Kupang regency, East Nusa Tenggara Province, (122° E - 125∙ E and 9° S - 11° S).
Research materials
The materials were used such as Fish catching
data in year 2006 from Marine and Fisheries Office, East Nusa Tenggara Province, Chlorophyll-a, Sea Surface Temperature, and PAR data Level 2 Aqua-MODJS data, and Wind Speed data from Quickscat data.
Research instruments
Some instruments were used such as hardware (i.e. a set of computer Intel Core 2 Duo 2,8 GHz with 512 MB of RAM, hard disk 160 GB, keyboard, and mouse) and software (i.e. Envi 4.5, ArcView 3.3, SeaDAS under Linux OS, and Microsoft Excel 2007).
Research procedures
The research procedures were as follows:
-
1. Calculations of SST, Chlorophyll-a, and PAR data using the following equation:
SST (Celcius) = DN x 0.075 - 3.0
Chlorophyll-a (mg ) = 100.015 x DN-2
PAR (Einstein)= DN x 0.3
-
2. Calculations of Depth-integrated model (DIM) primary production are expressed as follows: (Behrenfeld and Falkowski (1997b}.
-
3 Fish Prodm.tion has estimated from integrated production assuming a simple trophic chain, with
a fixed trophic efficiency and average number of trophic links. The formula proposed byPaulyand Christensen (1995) :
-
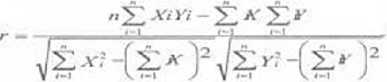
4. Correlation between Satellite Data and Fisheries Data were analyzed with correlation of Pearson. Rasyad (2003). Formula of correlation coefficient \"as:
t Prediction of fishing ground the estimating value of SST and Chlorophyll-a from satellite for one year and determination as well as classification of range parameters for each category. It bas classified into three categories which are High Potential, Potential an<l Low Potential fishing ground.
Table 1 Classify of Fishing Ground Area for Slcipjack Tuna (Katsuwonus pelamis}.{Gower, 19721
|
V..1i.1ble |
Value or SST {• CJ | |||
|
, 29 |
28 29 |
< 28 | ||
|
Value of O,loro^,vlhl {m^w*) |
0.10-0 20 |
Low Potentia |
low Potentiaf |
Low Potential |
|
0. 21-0.40 |
Low Potent1a |
Potential |
Potential | |
|
0.40 |
lowPottntla |
Potential I |
Hil!h Potennal | |
RESULTS ANO DISCUSSIONS
The total of Fish Catching in Sawu Sea in year 2006
Table 2. Total of Slopjack Tuna (Kutsuwonus pe/omosl in Sawu .sea 2006
|
Number of Fish Ca1chlng in Sawu Sea 2006 (kg) | ||||||
|
Souther! i |
Tr•n>ttion II | |||||
|
June |
Ju y |
August ! |
September |
October |
Novembe |
December |
|
2698.25 |
l.962 |
60325 |
3683.S |
3333.75 |
2175 |
2698.75 |
|
1547.5 |
1340 |
81375 |
2747 75 |
3111.25 |
2155.25 |
1648.5 |
|
2128.S |
2429.75 |
381.75 |
3437.5 |
2058.25 |
2795.75 |
1319.5 |
|
1945. |
2564 |
566 |
2836.5 |
1797 |
2073.5 |
2607.75 |
Amount of fish catching in Sawn Sea at Southeast monsoon was low. At Transition IT monsoon, total of fish catching in Sawn Sea was hlgh. Total of fish catching at Northwest monsoon increased, but lower than Southeast monsoon. Wouthuyzen, et.al., (1990) showed, 6.shlng number of Skipjack Tuna in Southeast monsoon was low, because of wind from southwards is strong. Finally, fish catching decreased. The higher of fish catching occurs in Transition n monsoon (Septemher, October, and November) because Upwelling phenomenon was occurred and affecting high the catching Matsumoto et.al., (1984) showed, an area which has fast current
as in Sawu Sea, getting upwelling phenomenon during Southeast. Wrytki, (1961) explains that upwelling is enhancement processlifted water mass to the surface.
Sea Surface Tempel"ature.

FieurE 2. SST ln Sawu Sea ii\ year 2006 dur11"1g monsoonal
The average of Sea Surface Temperature in September 2006 in Sawu Sea was 26.29°C with the maximum SST was 26.65°C and the minimum SST was 26.06°C. In October 2006, the average of SST in Sawu Sea was 27.3o•c with the maximum SST was 27.67°C and the minimum SST was 26.99°C. The average of SST in November 2006 was 28.^°C with the maximum SST was 29.10°C and the minimum SST was 28.21°C. The variability of Sea Surface Temperature in Sawn Sea shows in the Figure 2 During Southeast monsoon, rainy season was occurs, where the dilution of waters occurs in the Sunda shelf. The ward of high salmity reversed, flowing from the east and encourages low salinity water returned to the west. The temperature is slightly low. During Northwest monsoon, d^ season was occurs where transportation water flows from Natuna island, .Java sea, Makassar Strait to the North of Sumbawa dominated low salinity water. The temperature slightly high (Writky, 1961 and Nontji, 1987).
Chlorophyll-a Concentrations
The average of Chlorophyll-a concentration in September 2006 in Sawu Sea was 0.31 mg/m3 with the maximum Chlorophyll-a concenlralion was 0.37 mg/m3 and the minimum Chlorophyll-a concentration w·ds 0.23 mgfm3. In October 2006, the average of Chlorophyll-a concentration in Sawn Sea was 0.18 mg/m3 with the maximum Chlorophyll-a concentration was 0.20 mg/m3 and the minimum

Figure 3. Ch1orophy11·a c.oncent.ra0ans:1n Sawu Sea in year 2006 during Monsoonal.
Chlorophyll-a concentration was 0.17 mgfm3. The average of Chlorophyll-a concentration in November 2006 was 0.22 mg/m3 with the maximum Chlorophyll-a concentration was 0.45 mg/m3 and the minimum Chlorophyll-a concentration was 0.14 mg/m3.
Generally, cholorophyll-n concentration in Sawu Sea during Southeast monsoon relatively higher compared with northwest monsoon. The higher value in November bas a different value with the other months. This indicated that the area was occurred ocean phenomenon i.e. upwelling which is followed by high catches in the same month.
Syamsuddin, el al (2006) showed that upwelling occurs in Southeast monsoon of Sawu Sea as the result of this research where the upwelling is enhancement process of waters from the bottom to the surface. Upwelling was used to describe the processes that cause waters are moving from a depth into the surface layer. Upwelling cffcct^d higher nutrient concentrations compared with surface nutrients has been reduced by the growth of phytoplankton (Bowden and Stewart, 1983 cited in Syamsuddin, et al. 2006).
The Correlation between Fish Catching Trends and Satellite Data
Sea Surface Temperature (SST) influential to fish catching, because of Skipjack Tuna (Katsuwonus pelamis) would be choose the temperature that suitable to Skipjack Tuna's environment. The correlation (R) between SST and fish catching showed -0.25. Chlorophyll-a concentration has close relationships between fish catching. The correlation between Chlorophyll-a and fish catching in Sawu Sea showed 0.12.
The Correlation between Chlorophyll-a and Sea Surface Temperature
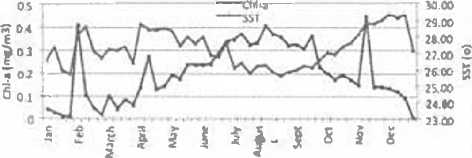
Figure 4. CorrelationbetweenChlorophyl^a and SST In SawuSe;,year
2006
SST and Chlorophyll-a concentrations have an inverse pattern, when the sea surface temperature was minimum, chlorophyll-a concentration was maximum value, (Figure 26). The correlation between chlorophyll-a and SST io Sawu Sea was inversely correlated with correlation coefficient (R) -0.24. Palenzuela et al., (1998) showed that the sea surface temperature and chlorophyll-a concentration were inversely correlated.
Estimation of Primary Production in Sawu Sea
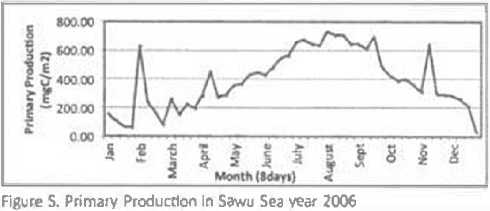
Maximum of PP in August was 726.23 (mg C/ m2), minimum PP in December was 26.02 (mg C/m2). Average PP in Sawu Sea was 394.64 (mg C/m2). In this research, the relationship between primary production and Chlorophyll-a conceotration is very strong and proportional, with the correlation coefficient is 0.98. According to Sarwono (2006), its meao that the correlation was strong. This highly correlation coefficient indicates Lhat the area with highly Chlorophyll-a concentration also produce the highly primary production.
Estimation of Fi5h Production in Sawu Sea
The Hjgher of Fish Production occurred during Southeast monsoon in Sawu Sea was 225.66 ton/ year and the lower of Fish Production occurred during Northwest monsoon in Sawu Sea was 65.84 ton/year. The total fish production in Sawu Sea 2006 is estimated 6563.08 ton. Fish catch data from Ministry of Marine and Fisheries in East
Nusa Tenggara Province showing that the total fish catch in Sawu Sea in 2006 is 4.685,75 ton. There is considerable mismatch between the estimated of fish production and actual catch data in 2006. The difference value between the total fish production and fish catching in Sawu Sea is 1.877,33 ton. The utilization rate of potential fisheries in Sawu Sea is 71.39%.
REFFER.ENCES
Behfereld, M.J and P.G. Fawkolsky. 1997a. A Consumer'.< Guide to Phytoplankton Primary Producrivity Models. Limnology and Oceanography ,Journal ^ (7).
Bebfereld. M.J and P.G. Fawkolsky. 1997b. Photosynthetic Rates Deriuedjrom Satellice-Based Chlorophyll Con· ce11trotion. Lirm1ology and Oceanography Journal 42, Number 1. American Society of Limnology and Oceanography, Inc.
Department of Marine and Fishery East Nusa Tenggara Province, 2006. Statistik Laporan Tahunan Perikanan Provinsi. East Nusa Tenggara Province;
Matsumoto, W.M. Slrilman andAE.Dizon, 1984.Synopsisof Biological Dota onS kipjadc Tuna Katsuwonus pelamis. NOAA Technical report NMFS Circular No. 451.92 pp.
Ministry of Marine and Fisheries East Nusa Tenggara Province, 2006. Statistik J..aporan Tahunan Perikanan Tangkap Provinsi NTI'.
Nontji,A 1987. Laut NIL<antara. Jakarta: Djambatan.
Palenzuela,J.M.T, Mar Sacau Cuadrado, Jaime Peon Fernan· dez, and Monica Miguel Lago, 1^8. &a Sur/are Tem∙ perature and Chlorophyll-a Correlation Study. Oep. Fisica Aplicada .Facultad de Ciencias. Universidad de Vigo.
Pauly, D. and V. Christensen. 1995. Primary Production Required to Sustainable Global Fisheries. Nature. 374. 255-257.
Pauly, D., V. Christensen, S., Guenette, T.J. Pitcher, Ult Sumaila, C.J. Walters, R.Warson and D.Zeller. 2002. Toward Sustainability in World Fisheries. Nature Vol,418.p689-695
Rasyad. R. 2003. Metode Stacistik Deskriptif. Cramedia: Jakarta
Sarwono, (2006).TeoriAnalisis Korela,i. Mengenal Analisis Korela_si Data Penelitian Menggunakan SPSS 15.0 for Windows. Yogyakarta. CV.Andi Offset
Syarnsuddin, Mallawa, A., Najamuddin, 2006.Analisis Pen-gembangon Perikonan Ikon Cokalo,1g (Katsuwonus pelomis) Berkelanjutan di Kupang Prouinsi Nusa Tenggara Timur. Universitas Hasanuddin. Makassar.
Wouthuy,en, S., Hulahaeau, W., Nanlohy, A. 1990. Studi Daercui Pe,tangkapan Ikan Cakafong, Katsuwo,ws pelamis Di Permran Maluku Tengah. Balitbang Sum· berdaya Laut, Puslitbang Oseanologi-L!Pl, Kp.Curu-Guru, Poka, Alnbon.
Wyrtki, K 1961. Physiool ocro11ograplty of the Soutlt-East Asian waters. Naga Report Scripps Oceanography. Univ. California., 2 : 1-195.
39
Discussion and feedback