STUDY OF CHLOROPHYLL-A DISTRIBUTIONS IN LOMBOK STRAIT USING BIOGEOCHEMICAL MODEL BASED ON REGIONAL OCEAN MODELLING SYSTEM (ROMS)
on
ECOTROPHIC • 7 (1) , 28 • 39
ISSN: 1907-5626
STUDY OF CHLOROPHYLL-A DISTRIBUTIONS IN LOMBOK STRAIT USING BIOGEOCHEMICAL MODEL BASED ON REGIONAL OCEAN MODELLING SYSTEM (ROMS)
Kadek Ary Aaggreni 1) z∖ Takahiro Osawa2), l Wayan AathanaJ)
-
1) Scliool of Biology Science, Udayano University
-
2) Center for Rtmote Sensing and O,,,an &icnces (CRtSOS) Udayana University
-
3) Environmental Resoorch Center, Udayana Uniuersity
ABSTRAK
Regional Ocean Modelling System atau Sistem Pcmodclan Laut Regional (ROMS) telah digunakan untuk be1macam keperluan, bennacam pemodelan kelautan. Model Biogeokimia yang dipasangkan dengan ROMS te,tliri dari tujuh pasang bagian persamaan yang berbeda-beda mencakup: nitrat, amonium, detritus kecil dan besar, fitoplanJ..-ton, zooplankton, dan karbon fitoplan\..'ton yang dinamis menjadi suatu rasio klorofil. Studi pola penyebaran klorofil-a di Selat Lombok (-7 °N - -10 °S dan 114 °E - 117 °E) pada tahun 2006 tclah dianalisis menggunakan model Biogeokimia berdasar pada ROMS.
Hasil penelitian menunjukkan bahwa sebaran klorofil-a teramati rendah (0,20 mgChl-a/m3) di Selat Lombok pada bulan Januari. Klorofil-a diperkirakan di bagian sebelah selatan Selat Bali dan penyebaran klorofil-a rendah pada lapisan atas dari Selat Lombok.
Klorofil-a berlimpah (0,32 mgChl-a/m3) teramati di bulan Agustus. Arah arus timur taut bergerak kearah barat clan bagian selatan di daerah penelitian melalui Selat Lombok. Konsentrasi klorofil-a tertinggi dipcrkirakan di sebelah utara hingga bagian barat daya Pulau Bali dan juga di bagian selatao Pulau Lombok. Selama musim kering, angin arah tenggara berhembus dari Aill,tralia memicu terjadinya proses upwelling (temperatur renda h dan air yang kaya nutrien di dekat permukaan) juga diperkirakan berdasarkan ROMS.
Kata kunci: model Biogeokimici, Sistem Pemodelan Laut Regional, sebaran k/01'0.fil-a, proses upwelling
ABSTRACT
Regional Ocean ^lodelling System (ROMS) has been intended to be a multi-purpose, multi-disciplinary oceanic modeling tool. The Biogeochemical model have coupled to ROMS consists of a system of seven coupled partial differential equations that include: nitrate, ammonium, small and large detritus, phytoplanJ..'ton, zooplankton, and a dynamic phytoplanJ..-ton carbon to chlorophyll ratio. The study of distribution patterns of chlorophyll-a in Lombok Strait (-7 °N - ·10 •sand 114 "E - 117 °E) in 2006 was analyzed using the Biogeochemical model based on ROMS.
The results show that low chlorophyll-a distributions (0.20 mgChl-a/m3) observed in Lombok Strait in ,January. Chlorophyll-a estimated around the southern part of Bali Strait and low chlorophyll-a distribution in upper layer of the Lomhok Strait.
Chlorophyll-a of the booming (0.32 mgChl-a/m3) observed in August. The northeast current direction moves to the west and southern part of research area through Lombok Strait. The highest chlorophyll-a concentration estimated in the northern and southwestern part of Bali Tsland and also in the southern part of Lombok Island. During dry monsoon, southeasterly wind blow from Australia generates upwelling process (low temperature and nutrient-rich water near the surface) also estimated from ROMS.
Keywords: Biogeochemical model, Regional Ocean Modelling System, chlorophyll-a distri/)Utions, upwelling process
JNTROOUCTION
Chlorophyll plays an important role in plants in the photosynU1esis, tbe mechanism by which plants acquire energy. In the photosynthesis process, all
plants, including phytoplankton in the ocean, absorb CO,. so the ocean plays an important role in adjusting the CO, concentration in the atmosphere. Ocean biogcochemical and ecosystem processes are linked by Net Primary Production (NPP) in the
ocean's surface layer, where inorganic carbon is fixed by photosynthetic processes (Behrenfeld, et al., 2005).
The vertical distribution patterns of chlorophyll concentration depend on seasons and regions. The chlorophyll maximum value is not always observed near or at the sea surface, but sometimes lies deeper than the bottom of the eupothic zone. In this case, the ocean color sensors cannot measure the chlorophyll maximum value (Parson et al., 1984 in Pertami, 2006).
Coastal environments are important biogeochemical pathways between land and the open ocean that significantly modify the flows of matter and energy between the latter two systems. They receive and exchange considerable amounts of dissolved and particulate organic matter and nutrients, freshwater, energy and contaminants (Smith and Hollibaugh, 1993; Gattuso et al., 1998; Wollast, 1998 in Schi-ettecatte, 2006).
In this study, the changes in the vertical distribution of chi-a concentration from the sea surlace in Lombok strait were investigate using biogeochemical model based on Regional Ocean Modelling System (ROMS).
The first aim of this research is to know the change of the vertical distribution of chi-a concentration from the sea surface using ROMS with Biogeochemical Model. The second aim is to estimate the distribution of chl-a in Lombok Strait concerning with ITF and monsoon.
The result of this research can be giving an understanding of how the changed of the vertical distribution of cbl-a concentration from tl1c sea surface using ROMS with Biogeochemical Model and the distribution ofchi-a in Lombok Strait concerning with ITF and monsoon.
RESEARCH METHODOLOGY
The research was conducted in Lombok Strait (-7 °N - -10 °S and 114 °E - 117 °E). In-situ data recorded such as temperature, salinity, turbidity, chlorophyll concentration, and sigma-T (density) by COMPACT-CTD. In this study, the observed data (chi-a concentration, temperature, and salinity) are employed for the validation.
The satellite data from SeaWirS (Sea-vie...^. ng Wide Field-of-\>iew Sensor) were used in January
to December 2006 for inputting directly into the biogeochemical model. The ocean color reveals information on the presence and concentration of phytoplankton, sediments, and dissolved organic matters of the ocean. Thus, SeaWiFS can manage the marine environment (Chaomin et al., 2001).
The batbymetry data was taken from ETOP0-2. The data is a combination of satellite altimetry observations, shipboard echo-sounding measurements, data from the Digital Bathymetric Data Base Variable Resolution and data from the GLOBE project which has a global digital elevation model (SOS NOAA, 2009).
The surface forcing data such as wind stress, long wave and short wave radiation, evaporation, and precipitation are from NCEP (National Centers for Environmental Prediction). All of the data were analyzed using ROMS. Finally, the model results compared to the in-situ data set and satellite data. The research scheme
Data was analyzed using the Biogeochemical model of the ROMS (Moisan et ol., 2001). The model equations is as the following:
"l∙1λi'''J-^, J(∖.√>.4^M-^^^^ n d
O^J . Q)f~.AE,{oo]-1^{Zoo)-1, W-O.)^] a,
(42)
(4 5)
‘-- - '.√⅛ i4^⅛^P M-l^r Ju^μ L. μ3)
"^J • -I~_ eulPi"'"]- &, [m,.H,- ∙ Q_)[7"^l^ ι-∙∙ Ja>.,yf. ,.w.,j^y)
^oJ --',-Qvr {Phro) +Q,t. [NH 4 ] ^,
RESULT AND DISCUSSION
Batbimetry map (the average depth 200 - 300 meters) is shows in Figure 1. In the northern strait, there is a deep channel with depth up to 1400 m. There is an ocean trench found in the northern part of Lombok Strait with depth is more than 1500 m (showed by light blue color) then Java sea in the southern part with depth is up to 1000 m (showed by navy blue color). The southern part of Lombok strait is the Indian ocean with depth around 500 -4000 m (showed by different color in each water depth area).
During rainy season, the northwest current
F'igure 1 Sathimetry model of lombok Stra,t
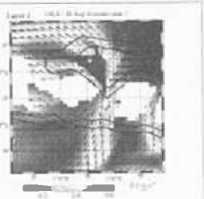
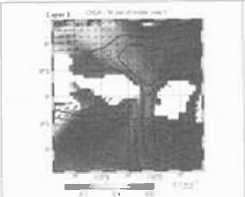
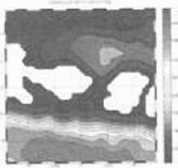
Figure 2 (J) Chl a distribution in January from model
frgurP 2 (c) Chl·.t d ^trtbunon In January from !wltelllte
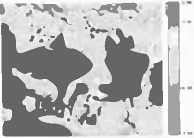
Figure 2 (b} Chl·a dlstribution In August from mod,1
⅛ft
Figure 2 {d) Chl·a distribution In August from satellrU!
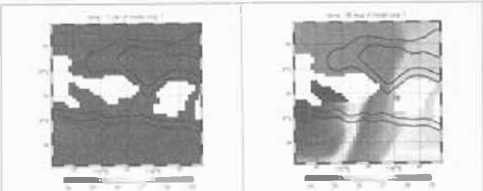
Figure 3 (a) Oi^tnbuhon patterns of temp, in Janual'Y from model
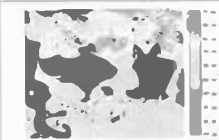
Figure 3 jb) Distribution patterns o temp. in August from model
Figure 3 tc) o,st11buuon pattems of u^mp. 1n January from satellite
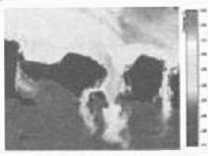
Figure 3 (d) O^t.ribution patterns of temp. in August from satellite
direction moves to the cast and southern part through the t.ombok Strait in Janua1y. TI1e highest chi-a values only estimated in the small area in the northwestern part of Java island and the lowest values (blue) estimated in the almost research area included the Lombok Strait. The ma.,'imum value of chi-a is o.6 (mgChl-a/m3) and the minimum value is 0.1 (mgChl-a/m3). The results derived from the model indicated that low chl·a distributions at the sea surface in Lombok Strait in January (Figure 2 (al). The chi-a distribution is around 0.2
(mgChl-a/m3). Many rivers change the value bring nutrients enter into the strait in coastal area. In the month (when the northwest monsoon happened), northwesterly wind drives the surface current to the east and southward and accumulates the warm water in the southeastern part of Lombok Strait to the Indian ocean.
During dry season, the northeast current direction moves to the west and southern part of research area through Lombok Strait in August. The highest chi-a values were estimated in the northern and southwestern part of Bali Island included in Lombok Strait and also in the southern part ofLombok Island. The lowest values estimated in the northern part of Lombok island. There is high chi-a distribution found in ^mbok Strait at the sea surlace (Figure 2 (b) in August (when the southeast monsoon happened). The chi-a distribution estimated in the strait is from 0.35 to o.6 (mgChl-a/m3). This indicated that chl-a booming in this month.
The results derived from satellite SeaWTFS show similar patterns (Figure 2 (c) and Figure 2 (d)). High chi-a distribution observed in August, southeast monsoon happened. In January, wam1ertemperature caused chi a distribution decreased at the sea swface. On the contrary August pattern shows, decreasing temperature caused the chlorophyll-a distribution increase at the sea surlace (Figure 5.4 and 5.5).
Arvelyna, Y. and M. Oshima (2010) showed from April to August 2000 the chlorophyll increased at southern of East Java Island, Bali Island and Lombok Strait. The maximum concentration is located at southern coastline of Bali Island. In July, the area near coastline of Java is influenced by upwelling area occurs during cast wind. The maximum chlorophyll area when internal wave did not occur on August in southern of Java Island. It shown that the surface chlorophyll concentration near coastal area, increased when internal wave is occurred.
The highest temperature level values (dark red) in January estimated in almost part of the research area with the temperature is up to 29 °C and more. High temperature in January (up to 29oC and more) is also influenced low chi-a distribution around Lombok Strait (Figure 3 (a)).
The highest temperature (28 •c) in August estimated in the northern part of Bali Island included in Lombok Strait to Indian ocean and the lowest temperature (24 °C) estimated in the southern part of Bali Island (near the Bali Strait). In August, temperature range is from 25 to 28 °C (Figure 3 (b)).
The results from satellite is also showed similar patterns. The highest temperature values Oight reel) were estimated in northern part of research area and the minimum values (blue to purple) estimated in the small area in southeastern part of Java Island. The variation of temperature in Lombok Strait in January is from 25 to 32 °C. ln Lombok Strait temperature is 30 °C. The temperatmre in Januaty 2006 in Lombok Strait is high (from 28 to 29oC) and from 25 to 27 °C in August 2006 (Figure 3 (c) and Figure 3 (d)). The highest temperature value (light green) estimated in the northwestern part of Bali Island and the minimum value (purple) estimated in the southern part of research area. The maximum temperature value is 29 UC and the minimum value is 25 °C. Temperature variation of Lombok Strait is from 25 to 27 °C.
Tomascik et al. (1997) in Tubalawony (2001) showed that sea surface temperature in Indonesian seas is around 25 to 30 °C and decrease 1 to 2 °C in every Bo db depth. In January to February when the downwelling happened, temperature at the sea surface can reach up to 25 UC and in August when the upwelling happened, sea surface temperature is arnund 25 °C.
Upwelling events were studied along the southern coast of Java, Bali and Lombok islands during the southeast monsoon (June to August). Satellite· derived chlorophyll concentrations higher than o.8 (mgChl·a/m3) and sea-surface temperatures lower than 28 oC are indications of upwelling (Hendiarti et al., 2004; Susanlo and Marra, 2005).
Table 1 Comp.:iri-sofl between chi .:. and SST bi!^ on \he hQrizon(nl moothly average
January August January August
(mgChl·alm') ,
SST!'CJ 29,77 26 34 29,1827,19
The comparison monthly average of SST and chi-a distribution at I.he sea surface derived from the model shows that in January, wanner temperature at the sea surface is up to 29.18 °C with the chi-a distribution is 0.20 (mgChl·a/m3), In August (Table 1), the temperature is up to 27.19 °C and the chi-a distribution at the sea surface is up lo 0.32 (mgChl-a/m3).
The comparison of monthly average value of SST and chi-a at the sea smface from satellite data shows that warmer temperature at the sea surface is up to ',!.9.77 ''C with the chi-a distributfon is 0.27
(mgChl-a/m3) in January. The temperature is up to 26.34 °C and the chi-a at the sea surface is up to 0.66 (mgChl-a/m3) in August (Table 1).
There were significant differences between monthly average value of chl·a disb1bution in August from satellite and the model. The differences occured because of upwelling events in August, which was indicated by the high value of chl·a. The data from satellite was usually higher than the model because of the reflectance could detect changes in the spectrum of light with the same wavelength. The data from the model was obtained from a formula without using any atmospheric model thus considered that the photosynthesis value was constant. It also was difficult to provide any significant value that was affected by monsoon.
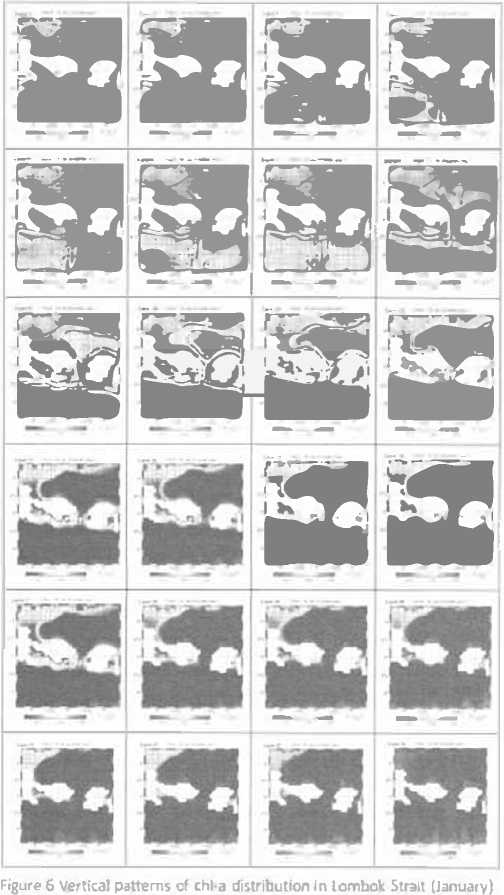
Figure 6 shows the chi-a vertical distribution in l.omhok Strait in Janua,y :wo6 from model. There
-- -- -- --
-- --
+
--
--
--
--
---
--
--
--
--
-- --
--
frgu-re 7 Vemcal patterns. of temperature Cfl1U1but1on 1n Lombok Strait (January)
Figure 8 Verne.at parte,,ns of chi-a diS1ribvnon in Lombok Stta1t (Augusl)
are small area of chi-a distribution estimated in the Lombok Strait from layer 1 to layer 24. Chi-a is estimated to increase in the southern pa1t of Bali Strait to the Indian Ocean in Layer 4 to 12. Chi-a distributions are estimated to decrease until the bottom of the sea. The low chi-a distiibution estimated upper layer in the Lombok Strait.
Figure 7 shows the vertical patterns of temperature distribution in Lombok Strait in January from model. The figure shows that the warmer temperature distribution estimated in the area in Lombok Strait from layer 1 to 12. The highest temperature (29 0C) estimated around northern part of research area, around l..ombok Strait until Indian ocean. Temperature is around 24 "C in layer 13 to 24.
The vertical patterns of chi-a and temperature distribution in Lombok Strait in August from model also divided into 24 layers. These vertical clislributions patterns of chi-a in August are showed
in Figure 8. The figure shows that there were booming of chl·a found inthe area. The highest chi-a o.6 (mgChl a/m3) was estimated around northern part of Bali island, and Lombok Strait to southem pait of Bali and Lombok islands. Chl·a distribution are estimated more dearly frum layer 1 to 8.
TI1e vertical patterns of temperature distribution in Lombok Strait in August are showed in Figure 9. The figure shows that the temperature was not so high in August. The highest temperature distribution was around 28 °C in the northern part of Bali Island to l.omhok Strait from layer 1 LO 12. Temperature around 24 °C estimated in layer 13 to 24.
The southeasterly wind blow from Australia generates upwelling and brings cooler and nutrient· rich water near the surface, enhancing productivity and increasing ocean color. Near the bottom of the sea strait the chlorophyll-a distributiondisappeared.
MaLsuur^ et ol. (1997) in Tubalawony (2001)
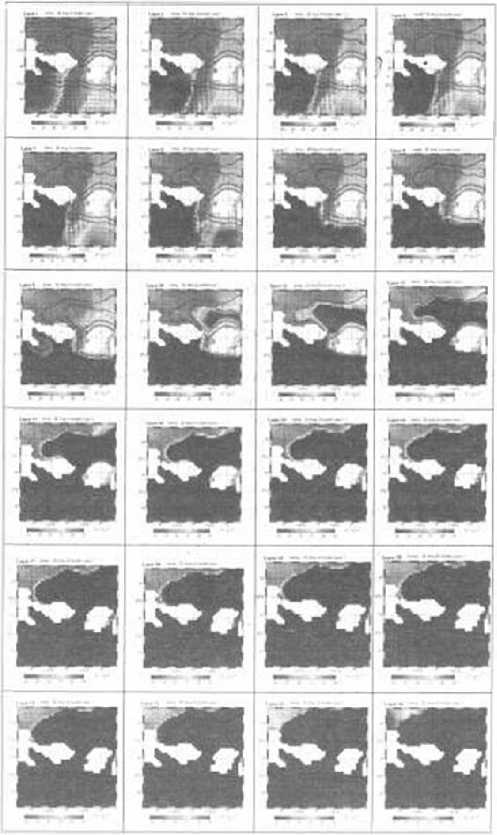
Figure 9 Vemcal distnbution pattern^ of Lerpperature tn Lombok S1ra1t
(August)
the distribution of chi-a in upper layer is bigb. Tbe temp€rature in this upper layer is from 25 to 28°C. This mean that this temperature is the tolerance temperature for the chl-a to live in Lombok Strait.
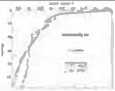
Chl-a and temperature distribution from in-situ dataset was used to validate the model results. Figure 10 (a) and ^), n (a) and φ), 12 (a) and Figure 13 (a) and ⅛) show correlation between model and in-situ in each location (Al, L3, Ls, and LB3).
I^- ^
, ,
fi^re 10(.a) ^ clil-acQMpa,rillCltl bcP'«n the .rnodel •od llH111o1 rA11
R^te 11 C.a} nc, chi.a comp11i110n ^l.,.ttl'I ^nV.11.kl 1111d IJHUIU IL1l
- - - » *⅛⅝u->
:
^^m∙
' —
'
l'iJt.!rc l11a1^ chi a comparbt,n
h(-r,1,«n lht rn,:,.-ltl and ,n ',m, fl.'\1
'
:, .
RIJ.lft IO(b)The kmp. cc,n;e,rillUfl between the modd and lASlll\C!il}
'
I·
-
-
r
M,ure 11 (b) Titc 1emp. «ll"llfl'n^ l^iwttt1 thc 1Tl<)(l,I 111'4 ill-"N tl.3}
.
'.
.?1 ■ te1wcen th< τm-ιd ml inNω (LS)
Ago^ l)C,11 Thtchl-a comptrison l'tlllll't.°11 ^ r1KJOtl anJ 111,m.11LIJ.n
f1tt1K I! lb) I lu: r,·:i,p. (O"Jlpi$!!WII
. ,
κ≡
Fi,urC' I \ lb) Ott! lcmJI. «x:npirhbn bctWCCl'l the moJcl ard In SI.bl ILllJ)
showed concentration of chlorophyll distribution in upper layer has a little 1111xmg ,valer and the concentration is up in the thermocline layer then decrease until there is no chlorophyll concentration found under the thermocline layer. Stewart, R. (2009) showed that the vertical mixing is influenced by wind field. Winds usually blow toward lhe equator along the coasts of continents, and the wind pushes water offshore away from the coast. Then, the waler is replaced by cold upwelling water that is rich in nutrients (fertili7.er for phytoplankton which one of them is chlorophyll).
The <·omparison of chl-a vettical distribubon which derived from model and insitu dataset in Lombok Strait are devided into fottr different locations. In all location (A1, L3, Ls and LB3). chi-a distribution almost found at the sea surface until 100 m depth (as mixing area} with the range value is from 0.5 lo 1.0 (mgChl-a/mJ). This shows that in October and December 2006 (when the data were taken),
The correlation coeficient show that temperature in each location show simulate patterns between the model and in-situ dataset. The lowest correlation coefficient observed in the chi-a comparison between the model and in-situ in location LB3. Tlus mean that the environment factors surh as nutrient flow from the river or water flow from the ITF did not give much influence to this location.
CONCLUSIONS
Low chlorophyll-a concentration observed in each layer of the vertical distributions patterns of chlorophyll-a in ,January 2006 and higb chlorophyll-a concentration observed in upper layer (from layer I to 8) of the vertical distributions patterns of chlorophyll-a in L.ombnk Strait in August 2006. During northwest monsoon low chlorophyll-a distribution (0.21 mgChl-a/m3) observed at the sea surface in Lombok Strait and booming of chlorophyll-a (0.32 mgChl-a/ml) estimated at the coastal area in the northern part of Bali to the southern part and Lombok Strait during the
southeast monsoon with the range of temperature
is from 25 to 28 °C.
REFERENCES
Arvelyna, Y. and M. Oshima. 2010. Preliminary Study orIn-ternal Wave Effects to Chlorophyll Distribution in the Lombok Strait and Adjacent Areas. Tol<yo University or Marine Science andTechnology. Department orMarine Information System Engineering. 2-1-6 Echujima. Kotoku, Tokyo 135·8533, Japan .
Behrenfeld , M. J., E. Boss, D. A. Siegel, and D. M. Shea. 2005. Carbon-based ocean productivity and phyto· plankton physiology from space. Global Biogeochemi· cal Cycles 19 Available at URL: http·//www.icess ucsb, e<lu/-davey/MvPapers/Oebrenfeld etal GBC2004. l!llf (25/01/2009).
Chaomin, s., L.S. Chin, and K.L. Keong. 2001. Seav\'IFS Observation of Chlorophyll Distributio11 in Regional Seas. Centre for Remote Imaging, Sensing and Processing (CRISP). National University or Singap0re. Singapore.
Hendiarti. N., H. Siegel and T. Ohde. 2004. Investigation of different ooastal processes in Indonesian waters using Sea\.YiFS data. DeepSea Research Part II· TonicaISh1d^ jesjn Qwo^raphy.5Ul:3): 85-97,January-February 2004. Views of Ocean Proe('sses from the Sea-,ie,ving Wide ficld·of-,icw Sensor (SeaWiFS) Mission: Volume t. Else,ier Ud.
Moisan. J.R., T.A. Moisan. and M.R. Abbott. 2001. Modelling the Effect ofTemperature on the Maximwn Growth Rates orPhytoplanJ..'ton Populations. College orOceanic and AtmosphericScience. Oregon State University. USA. Availableat URL: http://roms.mpl.ird.fr/papers/BGC-model.pdf (27/12/08).
Pertami, N. D. 2006. Study on The Vertical Distribution of Chlorophyll in Coastal Ocean; Development of Vertical Model Function at Western Sumbawa Sea (Thesis). Denpasar: Master Program of Environmental Science, Postgraduate Program. Udayana University.
Schicttecatte, L.S., F. Ga1.eau, C. V. Zee, N. Brion, and A. v. Borges. 2006. Time series of the partial pressure of carbon dioxide (2001-2004) and preliminary inorganic carbon budget in the S:<;heldt plume (Belgian coastal waters). GoochemisayGeophysics Geosystems 7 (6).
Stewart, R. 2009. Distnl>ution of PlanJ..'ton. Oceanography in the 21"centucy- anonlinetextbook.Available at http:// oceanworld.tamu.edu/resources/oceanograpby-book/ phytoplanktondistribution.htm (11/04/09).
Susanto, R. D. and J. Marra. 2005. Effect of the 1997/98 £1 2'1fio on Chlorophyll a Variability Along theSouthern Coasts of Java and Sumatra. Oceanography, 18 (4): 124- 127.
Tubalawony, S. 2001. Pengan1h Fakltor·l'aktor Oseanografi Terhadap Produktivitas Primer Perairan Indonesia. Makalah Falsafah Sains. Program Pasca Sarjana/S3. [nstitutPertanian Bogor. Available at URL: http://www. rudyct.com/PPS702-ipb/02201/simon_t.htm
34
Discussion and feedback