OIL SPILL DETECTION USING MODIS DATA (CASE STUDY: OIL POLLUTION AT TIMOR SEA)
on
ECOTROPHIC • 6 (2) : 102 - 106
ISSN: 1 907-5626
OIL SPILL DETECTION USING MODIS DATA ;CASE STUDY : OIL POLLUTION AT TIMOR SEA)
A.A. GEDE PUTRA l), TAKAHIRO OSAWA 2) 1 M.S. MAHENDRA 3)
-
1) Ecoregion Management Centre for Bali and Nusa Tenggara, Environmental Ministry of Indonesia
-
2) Center for Remote Sensing and Ocean Sciences (CReSOS) Udayana University
-
3) Master Program of Environmental Science Udayana University
e-mail: agung_ptr@yahoo.com
ABSTRAK
Pada tanggal 21 Agustus 2009 sebuah kilang minyak lepas pantai yang berlokasi di Blok Barat wilayah Australia meledak. Akibat dari kejadian ini sekitar 500.000 liter/hari minyak mentah tumpah ke Laut Timor.
Penelitian ini bertujuan untuk mengetahui luas area tutupan minyak dan mengembangkan peta penyebaran minyak di Laut Timor sejak bulan Agustus 2009 hingga bulan Maret 2011. Untuk mendeteksi penyebaran minyak, digunakan data satelit MODIS dari tanggal 2 Juli 2009 hingga tanggal 15 Maret 2011. Selain itu, data kecepatan dan arah angin, koordinat sumber tumpahan minyak serta garis Zona Ekonomi Eksklusif (ZEE) juga digunakan untuk mengetahui luas tutupan minyak yang memasuki wilayah perairan Indoinesia. Metode yang digunakan adalah klasifikasi secara visual meliputi : pendeteksian area terpapar, pengukuran area terpapar, dan klasifikasi. Dari hasil pengolahan citra MODIS diperoleh informasi sebaran minyak di Laut Timor yang semakin meluas dari bulan Agustus hingga bulan September 2009, kemudian berkurang secara drastis hingga bulan Nopember 2009. Hal ini disebabkan karena dispersan yang disemprotkan ke permukaan laut mengakibatkan minyak tersebut mengendap. Namun ketika terjadi badai tropis pada bulan Desember 2009 dan Januari 2010, lapisan minyak yang telah mengendap tersebut kembali muncul ke permukaan laut namun tersebar di berbagai lokasi.
Hasil studi ini menunjukkan bahwa data MODIS dapat digunakan untuk memonitor penyebaran minyak di laut, selama tidak terhalang oleh tutupan awan. Luas tutupan minyak maksimal di Laut Timor terjadi pada bulan September 2009 yaitu seluas 7,996-40 km2.
Kata kunci : genangan minyak, citra satelit MODIS, Laut Timor, ZEE (Zona Ekonomi Eksklusif).
ABSTRACT
On August 21, 2009 an offshore oil rigs located in Block West Australia territorial was exploded. About 500.000 liters/day of crude oil was spill out to the Timar Sea.
To detect the oil spreading, this study used MODIS satellite data from 21 August 2009 until 15 March 2011. Besides that, data of wind speed and wind direction, coordinate of pollutant point sources, and Exclusive Economic Zone (EEZ) line are also used to know the covering area of the oil was entered into Indonesian territorial. The oil was classified by visual interpretation methods, these are : dark spot detection, feature extraction and classification.
As the result, oil spill covered area increased since August to September 2009. Oil spill on the sea surface then decreased drastically until November 2009. This was due to dispersant spraying which made the oil settled down. But, when a tropical cyclone occurred in December 2009 and January 2010, the settled oil appear again in sea surface but it spread out in various location.
This study shows that MODIS data can be used to monitor spreading of oil spill since no cloud cover. The maximum oil covered area was occurred on 24 September 2009 about 7,996-40 km2•
Keywords : oil spill, MODIS satellite image, Timor Sea, EEZ (Exclusive Economic Zone)
INTRODUCTION
The Montara offshore refinery located in Block West Australia territorial was exploded on August 21st, 2009. About 500.000 liters/day of crude oil was spilled out to the Timar Sea.
Remote sensing technique is the most appropriate tools for oil detection because the capability to cover large area by time series. Moderate Resolution Imaging Spectroradiometer (MODIS) censor may detect the oil spill on sea water by catching the radiometric signal, may
have high temporal resolution, but as optical sensor, is highly dependent on meteorological condition because it cannot penetrate cloud cover. Capability of MODIS instrument to detect the oil spill was demonstrated by Chuanmin Hu et al. (2003) by an example from Lake Maracaibo, Venezuela. On 2005, Dessi F. et al. then using the fluorescence index approximation in apply MODIS data for coastal and marine environmental monitoring by take a case study on anomaly detection and evolution in Gulf of Calgiari Sardina - Italy.
Oil pollution can have a significant impact on the
quality and productivity of coastal marine environments. In Nusa Tenggara Timur especially in southern of Timor Island there are many conservation area which sensitive to oil pollution, such as : coral reef, seaweed farmer, and fish marine culture.
METHODOLOGY OF RESEARCH
Research Location
The coordinate of research location is 12° 41' S / 124° 32' E. Boundary area for this research is 10° S -15° S to 120° E - 125° E.
Study area is a sensitive area to oil spills. Near to sources of oil spills, there is a coral reef that is wide enough around the Ashmore Island. That area also as fishing ground of Indonesian traditional fishermen.
11SoE 1200 E 1250 E 1300 E 135" E
sas
100 S
15" S
200 S
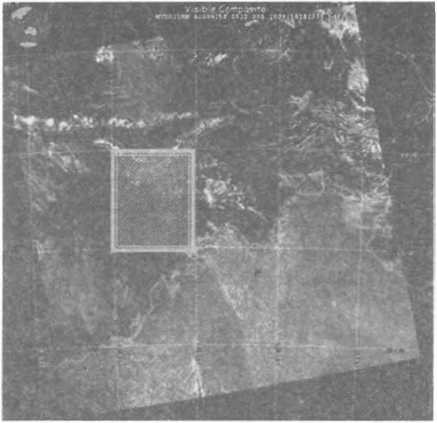
Figure 1 Research Location
Data
Data used in this research are : Aqua MODIS Level 1 B obtained by NASA and Wind Speed and Wind Direction obtained by QScat from July 2nd, 2009 until March 15th, 2011.
Research Instrument
Research instruments used to support the research activity such as image processing and mapping the oil spill. The research instruments are : Personal Computer (Pentium 4, HT 3.0 GHz, RAM 1GB, HD 80 GB, Provide by Computer Center of CReSOS - Udayana Sudirman Campus 3rd F), Laptop (Pentium M 1.7 GHz, RAM 512 MB, HD 160 GB, OS : Microsoft), Software ENVI 4.5, Microsoft Office (Excel, Word, Power Point) and ArcGis 9.2.
Oil Detection Scheme Methodology
MODIS image data, wind speed and wind direction data are main data used in this research. MODIS data level 1 B was no corrected geometrically. So that, the first step is do a geometric correction. Corrected image
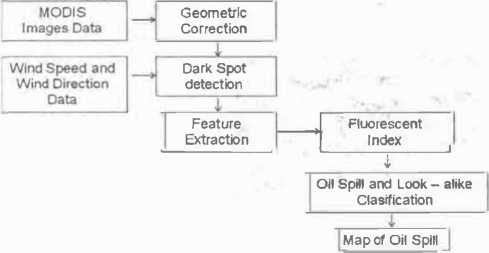
Figure 2 Oil Detection Scheme
then analyze the reflectance profile combined with wind direction data was used to detect dark spot area.
Feature extraction is use to compute features each slick by analyzing the reflectance profile of flourescent index (F) as the following formula:
Blue - Red Band 3 - Band 1
F==
Blue+ Red Band 3+ Band 1
(1)
Shadow of cloud and an organic layer may produce similar signature as oil slick, it's called "looks-alike". So that, oil spill and looks-alike must be clasified by analyzing the shape of the signatures. The final step is develop a map of oil spill.
Dark spot detection technique
In the visible range, the oil spill reflectance appears darker than the surrounding water. Figure 3 shows that the reflectance value of darker area (suspicious oil slick) of RGB band 6,5,3 is 0.02 to 0.03 W sr-1 m-2.

RGB (Band 6,5,3) Horiwntal Profile Vertical Profile
Figure 3 Darker Area and Reflectance Profile of the RGB Image (band
6,5,3)
As a hydrocarbon oil has a fluorescent characteristics. The fluorescent index was obtained by input the band formula (blue - red / blue + red or band 3 - band 1 I band 3+ band 1), Figure 4 shows the fluorescent image where the reflectance value of oil slick is 0.35 to 0.50 w sr-1 m-2.
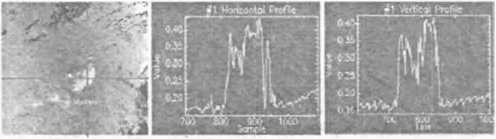
Fluorescent index Horizontal profile Vertical profile
Figure 4 Darker Area and Reflectance Profile of the Fluorescent Image
RESULTS
Oil Slick after Tropical Cyclone on 15 December
The Oil Slick Covered Area before 21 August 2009
Figure 5 shows the fluorescent of image before 21 August 2009. Darker areas that shown by images on 2 July 2009, 22 July 2009, 7 August 2009 and 21 August 2009 are "looks-like". There was no oil slick on these periods.
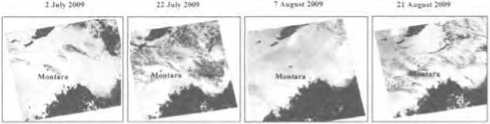
Figure 5 Conditions at nmor Sea before 21 August 2009
The Oil Slick Covered Area after Dispersant Sprayed
As shown by Figure 6, on 30 August 2009, the area of oil slick at Timor Sea was 4,190.62 km2• The oil moved from the source to north-east direction. On 24 September 2009 the area of oil slick was increased to 7,996-40 km2. About 1,317.67 km2 (16,5%) was passed the ZEE lines, entered into Indonesian territory.
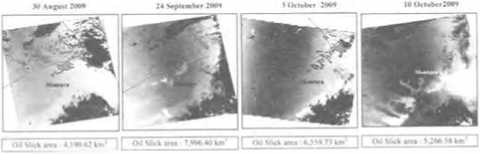
Figure 6 Conditions at nmor Sea before Spraying Dispersant
Oil Slick After Dispersant Sprayed
After dispersant sprayed on September 2009, the oil slick covered area at Timar Sea was reduced because by the dispersant the oil became heavier and settled down. On 3 October 2009 the area of oil slick was 6,559.73 km2 • About 725,90 km2 (11%) was in Indonesian territory. On 10 October 2009, area of oil slick was reduced to 5,266.58 km2.
The oil slick area was reduced from 3,004.65 km2 (26 October 2009) became 1,842.85 km2 (27 November 2009). About 1,981.59 km2 (66%) on 26 October 2009 was in Indonesian territory. On 15 December 2009 there was a tropical cyclone, the oil slick cannot be detected.
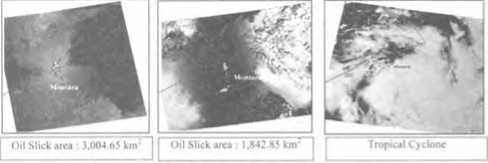
Figure 7 Conditions at Timor Sea after spraying dispersant
2009
Tropical cyclone on 15 December 2009 was broke the oil distributions, the oil became lighter and reappear to sea surface in small area and in various location. As shown by Figure 8, the area of oil slick on 24 December 2009 was 7,903.04 km2• On 29 December 2009, the area of oil slick was 7,433.64 km2 , about 3,476.60 km2 (46,77 %) was in Indonesian territory. On 14 January 2010, the oil slick was moved to north-east direction, but all of the oil slick was in Australia territory. On 21 January 2010, there was a tropical cyclone, the oil cannot be detected because very cloudy.
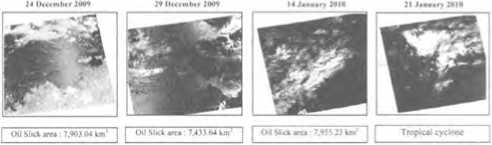
Figure 8 Conditions at nmor Sea after Tropical Cyclone on 15 December 2009
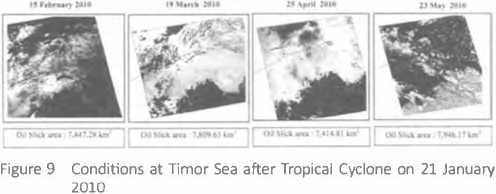
Oil Slick after Tropical Cyclone on 21January 2010
After tropical cyclone on 21 January 2010, oil slick was appeared in almost the same amount with before tropical cyclone was occurred. The area of oil slick at Timor Sea was not much changed from 15 February 2010 to 23 May 2010 (Figure 9).
Oil Slick at Timor Sea from 5 June 2010 to 15 March2011
Figure 10 shows the area of oil slick at Timor Sea on 5 June 2010 was 6,716.91 km2 around 3,352 km2 (50%) was in Indonesia territorial (Figure 10). On 18 July 2010 the oil covered area was 5,615-43 km2 about 2,246.17 km2 (40.%) was in Indonesia territorial. The oil slick area was increased to 7,200-49 km2 on 30 September 2010. Amount of oil slick was entered into Indonesia territory was 3,384.23 km2 (47%). On 25 October 2010 the oil covered are was 7,702.10 km2. There was about 3,542.97 km2 (46%) was entered into Indonesia territory.
JJaacNIO IBJwfe NI" N⅛c^∙e≡lwc NIO JMMaOccNIO
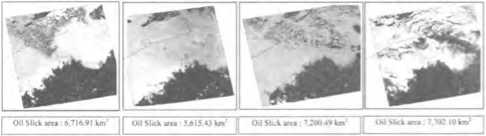
Figure 10 Conditions at Timer Sea from 5 Juni 2010 to 25 October 2010
As shown by Figure 11, the area of oil slick at Timar Sea on 10 November 2010 was 7,970.74 km2 there was no oil slick in Indonesia territorial. On 3 December 2010 the oil covered area was 7,769.88 km2 about 2,952.55 km2 (38.%) was in Indonesia territorial. On 1 January 2011, the oil covered area at Timar Sea was 5,957∙37 km2 about 595.74 km2 ( 10 %) was in Indonesia territory. The area of oil slick at on 10 February 2010 was 4,807.65 km2 about 1.346.14 km2 (28 %) was in Indonesia territory.
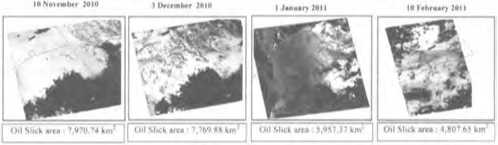
Figure 11 Conditions at Timor Sea from 10 November 2010 to 10 February 2011
Figure 12 shows the area of oil slick at Timar Sea on 27 February 2011 was 3,335.11 km2 (42%) was in Indonesia territorial. On 15 March 2011 the oil covered area was 7,912.64 km2 about 2,136-41 km2 (27.%) was in Indonesia territorial.
27 f'tbruan 2011
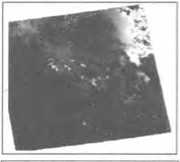
Oil Slick area . 7,940.74 k∏√
15 'brch 2011
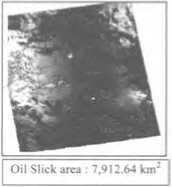
Figure 12 Conditions at Timer Sea on 27 February 2011 and 15 March 2011
DISCUSSION
The MODIS data are available in the daily data, but not all of MODIS data was usable to detect oil spills. The main constraint factor is cloud cover. Therefore the MODIS data used should have a few of cloud cover. Information of the date and the location of pollutant sources are very important to determine the oil slick.
MODIS data for detect oil spills in the Timar Sea can be used because the oil exposure covered in large area. Oil determination becomes rather difficult when the oil slick was broke by the tropical cyclone. It was also difficult to indicate the oil spill when appear the sun-glint, because it gives the similar reflectance characteristics with the oil. By changing the image into Fluorescent images, the difference of the oil reflectance and the surrounding become sharper, so the oil slick to be easy to determine.
Monitoring the oil spill by time series will give an information about the oil covered area, oil direction, and the critical period during the observation. Based on the results of this study, it can be described into fifth critical period was occurred in the Timar Sea since
July 2, 2009 to March 15, 2011, these are: 1) the period before exposure, 2) the period before the oil leak had closed, 3) the period before spraying of dispersants, 4) the period to the first tropical cyclone, and 5) the period after the second tropical cyclone.
The largest hydrocarbon portion derived from natural resources. Sea is naturally a place where oil can be spilled onto the surface of the earth at the bottom of the sea and move up to the sea surface. It was identified as many as 190 locations of oil spilled from the sea, mainly located in deep water and areas of tectonic activity. Estimated amount of seepage from the seabed around o.6 million tone per year. Only about 5% of seepage occurred in the waters of the continental shelf (Sweet, 1974 in Bishop, 1983).
Oil spills during drilling and production activities or explosions can have an impact directly affecting the productivity of flora and fauna and benthos communities. Sobasically the offshore refinery operations have to maintain and to protect the surrounding area that is sensitive to oil pollution, such as coral reefs, mangroves, estuaries, sea grass and coastal areas. Effect of oil spills on marine ecosystems and humans are very significant and mitigation efforts requiring very high cost. Generally, efforts to control oil spills to marine ecosystems based on the order of priorities linked to effects on humans directly. Reduction of oil spills on marine ecosystems can be done in physics, chemistry and biology.
Government of Indonesia has established a disaster response team concerning to oil spill at Timor Sea. On October until November 2009 that team conducted field survey on polluted areas around Timor Island and Papua for documentation and take a sample of sea water. By finger print analysis, National Center for Oil and Gas Research Ministry of Energy and Mineral Resources reported that samples collected from Timar Sea have similar characteristics of hydrocarbon with produced from Montara wellhead platform. As the result of the survey, polycyclic aromatic hydrocarbon (PAH) concentration above permitted marine water quality standard (< 30 ugjlt).
CONCLUSIONS AND SUGGESTIONS
Conclusions
-
1. MODIS data can be used to detect the oil spill at Timor Sea by analyzing the reflectance profile of fluorescent images combined with wind direction and wind speed data. To distinguish the oil with sun glint, which has similar signature as oil slick, the shape feature analysis of darker area can be conducted.
-
2. Base on the result, the maximum area of the oil slick detected in Timar Sea was 7,996-40 km2 occurred on 24 September 2009. The oil slick was entered into Indonesia territory since September 2009. The maximum area of the oil slick was entered into Indonesia water was 5,783 km2 on 25 April 2010.
-
3. After the tropical cyclone was occurred on 15
December 2009 and 21 January 2010, the oil emulsion appear at many location, but totally the oil slick area was aproximated as same as before tropical cyclone.
Sugestions
-
1. Sun glint give a similar profile with oil slick, this called "look alike". The largest challenge in detection of oil spill using MODIS images is accuracy of discrimination between oil spill and look-alikes. To improve the accuracy, there is a need to find out geometry, shape features, fluorescent index to distinguish oil spill and look-alikes.
-
2. The results of this study need a validate data by comparing with other image (i.e. SAR data) or valid insitu data.
REFERENCES
Antaranews, 25 September 2009, Ladang Minyak di Laut Timor Meledak. Available from : URL: http://www. antaranews.com/berita/1253853056/ladang-minyak-meledak-di-laut-Timor.
Brekke C., Solberg A.H.S., 2005. Oil Spill Detection by Satellite Remote Sensing. Remote Sensing of Environment; 95(1):1-13
Chuanmin Hu, Frank E. Muller-Karger, Charles (Judd) Taylor, Douglas Myhre, Brock Murch, Ana L. Odriozola, Gonzalo Godoy, 2003, MODJS Detects Oil Spills in Lake Maracaibo. Venezuela.
Dessi F., M.T. Melis, L. Naitza, A. Marini, 2005, Modis Data Processing For Coastal and Marine Environment Monitoring : A Study on Anomaly Detection and Evolution in Gulf OfCalgiary. Sardina - Italy..
Esaias, W.E.; Abbott, M.R.; Barton, I.; Brown, O.B.; Campbell, J.W.; Carder, K.L.; Clark, D.K.; Evans, R.H.; Hoge, F.E.; Gordon, H.R.; Balch, W.M.; Letelier, R.; Minnett, 1998. An overview of MODIS capabilities for ocean science observations, IEEE Trans. Geosci. Remote Sens., 36, 1250-1265.
Fingas M., Brown C., 1997, Review of Oil Spill Remote Sensing, Spill Science & Technology Bulletin, Vol. 4, No. 4, pp. 199-208.
Lilesand, T.M, and R.W. Kiefer, 1990, Remote Sensing and Image Intepretation. Gajah Mada University Press.
Lune!, T., 1996,Arctic and Marine Oil Spill Program (AMOP), Tech. Seminar. Calgary, Canada, Jun.12-14, 1994, 12211236.
Otremba Z., Piskozub J., 2001, Modeling of The Optical Contrast of an Oil Film on a Sea Surface, Optics Express. 9, 411-416.
Olsen, R.; Bugden, P.; Andrade, Y.; Hoyt, P.; Lewis, M.; Edel, H.; Bjerkelund, C., 1995, Operational Use ofRADARSAT SAR for Marine Monitoring and Surveillance. Proceedings IEEE 95CH35770, IGARSS. Firenze, Italy, July 10-14, 1995, 224-226.
Simecek-Beatty; D., Piche!; W., 2006, RADARSAT-1 synthetic aperture radar analysis for M/V Selendang Ayu oil spill. In Proc. 29th Arctic and Marine Oil Spill Program (AMOP) Tech.Seminar, Vancouver, Canada, Jun. 6-8, 2006, 931-949.
106
Discussion and feedback