STUDY OF RUNOFF IN UNDA WATERSHED
on
ECOTROPHIC • 6 (2) : 94 - 101
ISSN: 1907-5626
STUDY OF RUNOFF IN UNDA WATERSHED
Satria Wah^ Oetomo 1∖ Takahiro Osawa2), Nyoman Memt3)
-
1JPT. Mitra Tirta Dewata
-
2Jcenter of Remote Sensing and Oceanography 3JFakultas Pertanian Unud email : oe_sat@yahoo.com
ABSTRAK
Ketika hujan jatuh ke bumi, hujan tersebut tidak hanya diam, hujan akan bergerak berdasarkan hukum gravitasi. Sebagian dari hujan merembes ke dalam tanah untuk menjadi air tanah. Dan sebagian besamya mengalir sebagai runoff. Runoff penting bukan hanya untuk mengisi badan sungai dan danau, tetapi juga merubah pemukaan tanah dengan aksi erosi.
Studi ini bertujuan untuk mengestimasi kondisi tutupan lahan di Daerah Aliran Sungai (DAS) Unda berdasarkan basil pengolahan citra, mengestimasi limpasan hujan dan debit sungai rata-rata bulanan di outlet DAS Unda dari tahun 1999 hingga 2003.
Lokasi penelitian ini adalah di DAS Unda yang terletak di Provinsi Bali dan mempunyai luas 233.1 km2 (23.310 Ha) (Balai Wilayah Sungai Bali-Penida). Secara administrasi DAS ini terletak di 3 kabupaten yaitu Karangasem, Klungkung dan Bangli. Sebagian besar wilayahnya berada di Kabupaten Karangasem.
Dalam penelitian ini, data hujan bulanan digunakan untuk membangkitkan limpasan hujan. Dari analisa peta kontur dari peta topografi diperoleh batas DAS, parameter fisik sungai dan waktu konsentrasi hujan. Dalam penelitian ini digunakan data hujan harian (dari tahu 1999-2003) dari stasiun hujan Pempatan, Besakih, Singarata, Sidemen, Klungkung, Telengan dan metode Poligon Thiesen digunakan dalam pengolahan data tersebut. Disamping curah hujan, ada beberapa faktor yang mempengaruhi secara langsung pada kejadian dan volume limpasan hujan, yaitu jenis tanah, tutupan lahan dan kemiringan lahan. Jenis tanah pada area penelitian ini adalah tanah Regosol secara keseluruhan, peta jenis tanah ini tidak perlu dioverlay dalam mendapatkan satuan lahan. Analisa tutupan lahan menggunakan metode Klasifikasi Terbimbing.
Dari proses pengolahan citra didapatkan bahwa tutupan lahan DAS Unda terdiri atas 38,129 km2 area hutan (16,357°16), 19,122 km2 area semak belukar (8,203%), 100,991 km2 area pertanian (43.325%), 62,412 km2 area rumah (26.775%), 2,625 km2 of area perairan (1,126%), 4,046 km2 area awan (1,736%), 2,327 km2 area bayangan awan (0,998%) dan 3,448 km2 area bebatuan (1,749%).
Hasil analisa runoff baik dengan metode Hidrograf Satuan Nakayasu maupun Melchior memberikan pola yang mirip. Metode Melchior akan memberikan hasil limpasan hujan lebih besar, metode ini menghitung total limpasan hujan sedangkan metode Hidrograf Satuan Nakayasu menghitung limpasan hujan dengan membagi curah hujan menjadi jam-jaman. Dengan metode Hidrograf Satuan Nakayasu didapatkan nilai limpasan hujan bulanan rata-rata sebesar 10,61 m3/s dan 18,67 m3/s dengan metode Melchior. Nilai selisih persentase rata-rata dari keduanya sebesar 59,71%.
Dengan menjumlahkan limpasan hujan dengan aliran dasar didapatkan debit sungai. Dari analisa yang dilakukan didapatkan nilai debit sungai bulanan rata-rata sebesar 22,63 m3/s. Debit pengamatan dari Water Level Recorder (WLR) Dam Unda digunakan dalam validasi untuk studi ini, nilai debit sungai bulanan rerata rata-rata sebesar 18.24 m3/s. Nilai selisih persentase rata-rata dari keduanya sebesar 66,37%.
Kata kunci : aliran dasar, curah hujan, debit, das, jenis tanah, kemiringan lahan, konsentrasi hujan, limpasan hujan, tutupan lahan.
ABSTRACT
When rain falls on the earth, it just does not sit there, it starts moving according to the laws of gravity. A portion of the precipitation seeps into the ground to replenish Earth's groundwater. Most of it flows downhill as runoff. Runoff is extremely important in that not only does it keep rivers and lakes full of water, but it also changes the landscape by the action of erosion.
The purpose and objective in this study are to estimate the conditions of land cover of Unda Watershed based on the results of image processing, to estimate the monthly average runoff and discharge in outlet of Unda Watershed from 1999 to 2003.
The research location is in Unda Watershed. This watershed lies in Province of Bali which has wide 233.1 km2 (23.310 Ha) (Balai Wilayah Sungai Bali-Penida). Administratively this watershed lies in 3 Regencies that are Karangasem, Klungkung and Bangli Regency. Mostly the region lies in the Karangasem Regency.
In this research, the monthly rainfall data employed to generate the runoff process. Analyze of contour map from topography map obtained the watershed area, physical parameter of river and concentration time. In this
research used monthly average rainfall data (from 1999 to 2003) from Pempatan, Besakih, Singarata, Sidemen, Klungkung, Telengan, Rain Gauge Station and Polygon Thiesen method employed to analyze the datas. Apart ofrainfall, there are a number of site specific factors which have a direct bearing on the occurrence and volume of runoff, they are soil type, land cover and slope. The soil types in this research area are all Regosol, this soil mapping does not need to be overlayed in obtaining the land unit. Analyze of land cover was employed by Supervised Classification method.
By image processing obtained land cover of Unda Watershed estimated consists of 38.129 km2 of forest area (16.357°Ai), 19.122 km2 of grassland area (8.203%), 100.991 km2 of farmland area (43.325%), 62-412 km2 of area housing (26.775%), 2.625 km2 of water area (1.126%), 4.046 km2 of cloud area (1.736%), 2.327 km2 cloud shadows (0.998%) and 3-448 km2 of stone area (1.749%).
The results of runoff by Nakayasu Unit Hydrograph and Melchior Method gives quite similar patterns. The Melchior method gives higher runoff values. This method estimates total runoff while Nakayasu Unit Hydrograph estimates runoff by dividing rainfall into hours. By Nakayasu Unit Hydrograph Method showed the average of monthly average runoff were 10.61 m3/s and 18.67 m3/s by Melchior Method. The different percentage between these methods was 59.71%.
By summing runoff and the baseflow obtained river discharge and the average of river discharge in this thesis was 22.63 m3/s. Observed river discharge from Water Level Recorder (WLR) Unda Dam was used in validation, the average of monthly average river discharge was 18.24 m3/s. The different percentage between these methods was 66.37%.
Keywords : baseflow, rainfall, discharge, watershed, soil type, land slope, rain concentration, runoff, physical parameter of river, land cover.
INTRODUCTION
When rain falls on the earth, it just does not sit there, it starts moving according to the laws ofgravity. A portion of the precipitation seeps into the ground to replenish Earth's groundwater. Most ofit flows downhill as runoff. Runoff is extremely important in that not only does it keep rivers and lakes full of water, but it also changes the landscape by the action of erosion (Wikipedia, 2009).
The purpose and objective in this study are (1) to estimate the conditions ofland cover ofUnda Watershed based on the results ofimage processing, (2) to estimate the monthly average runoff in outlet ofUnda Watershed from 1999 to 2003 and (3) to estimate the monthly average discharge in outlet of Unda Watershed from 1999 to 2003.
METHOD OF RESEARCH
Location ofthis research is in Unda Watershed which is a river in Province of Bali which has wide of 233.1 km2 (23.310Ha) (Balai Wilayah Sungai Bali-Penida). Administratively this watershed lies in 3 Regencies that are Karangasem, Klungkung and Bangli Regency. Mostly the region lies in the Karangasem Regency.
Data in this research consists ofsecondary and primary data that related to this object research. Those datas are Landsat (1999-2003), Land cover map, Soil Map, Topography Map, Daily WLR data (1999-2003), Daily rainfall data (1999-2003) from Pempatan, Be-sakih, Singarata, Sidemen, Klungkung, Duda, Rain Gauge Station, Climatology Data (1999-2003) from Susuan Climatology Stations, Groundwater Map from Department of Energy and Mineral Resource. (Report of Groundwater Management in Bali).
This research consists of some analyze, there are analyze of topography map to get physical parameters of river and watershed (L, A, LlH). Length of river in Nakayashu Unit Hydrograph and Melchior Method employed to estimate concentration time (tg) and also current velocity in Melchior Method. Catchment Area (A) was obtained by joining the lines oftop ofcontour in watershed. Catchment area employed to estimate runoff. Height of Elevation (Lltt) in Melchior method employed to estimate current flow ofrunoff. This value had used to get concentration time in Melchior Method. Analyze of hydrology to get the value of rainfall. The value of rainfall which had analyzed in this research was monthly average rainfall. The steps are (1) analyze of land cover in research area by processing Landsat image and land cover map to help to define the land cover. This analyze uses Supervised Classification method. (2) Analyze of runoff coefficient by taking the value from the table based on the area conditions (the result ofoverlay of land cover, soil type and slope map). (3) Analyze of runoff by using Nakayashu Unit Hydrograph and Melchior Method. (4) Analyze of river discharge (flood). River discharge had obtained by summing the value af peak of runoff and baseflow. To analyze the baseflow used Nreca Method which a simple model of monthly water balance simulation for the stream of rain data. (5) Validation done by comparing result of discharge analyzis with data of Water Level Recorder (WLR) at the river.
RESULTS AND DISCUSSION
Land cover conditions of Unda Watershed
Information ofland cover can be obtained by using technology of remote sensing, that is by using satellite image. In this research had used Landsat image (1999-
2003). Landsat images from 1999 to 2001 that used in this study are too much covered by cloud and shadow cloud (more than 25%). This is a big problem and will influence the result of runoff analysis. It means that this will cause the loss of most of the nmoff because clouds covering and cloud shadows. The other problem by this condition is whether the land cover change can not be comparated year by year. This problem can be solved by taking the clearest Landsat Image from fifth Landsat images by consideration of secondary land cover change data (1999 - 2003) (Laporan Hidrologi Pengembangan Potensi Tukad Telagawaja di Kabupaten Karangasem 2004, Balai Wilayah Sungai Bali - Penida Provinsi Bali) whether the land cover change in research location from 1999 to 2003 is less than 2%. That is why in this study, Landsat Image 2002 as the clearest image had used for analysis.
The land cover conditions in Unda Watershed consists of 38.129 km2 of forest area (16.357%), 19.122 km2 of grassland area (8.203%), 100.991 km2 offarmland area (43.325%), 62-412 km2 of area housing (26.775%), 2.625 km2 of water area (1.126%), 4.046 km2 of cloud area (1.736%), 2.327 km2 cloud shadows (0.998%) and 3.448 km2 of stone area (1.749%).
The same thing happened in Buyan Lake. Candi Kuning rain gauge station datas from 1999 to 2003 showed the highest monthly average rainfall occurs in 2000 (248 mm), the lowest one occurs in 2002 (196 mm) and the average was 223 mm (Balai Wilayah Sungai Bali-Penida, 2007). While in Way Besai watershed (Lampung Province) the land cover consist of forest area (13%), grassland area (11%), area housing (2%) and farmland area (71%) (Ekadinata, 2001).
Monthly Average Runoff in Unda Watershed
In this research had used Monthly Average rainfall data from 1999 to 2003, from Pempatan, Besakih, Singarata, Sidemen, Klungkung, and Telengan Rain Gauge Station. Polygon Thiesen method was employed to analyze the data.
Land unit which has the same characteristic of land cover, slope and soil type in Unda Watershed was obtained by overlaying land cover and slope map and then comparing it to the runoff coefficient table. From this analysis the runoff coefficient of Unda Watershed was 0.361. Runoff coefficient of each watershed is different because the land cover, soil type and slope condition are also different. As the example in Penet Watershed the runoff coefficient was 0.39 and 0.37 in Sungi Watershed (Balai Wilayah Sungai Bali-Penida (2010). While in Jomblong watershed (East Java) showed the runoff coefficient was 0.592 (DPU, 2003). Percentage of forest cover in a watershed affected a large runoff coefficient.
The Monthly Average runoff in outlet of Unda Watershed consist of two methods : Nakayasu Unit Hydrograph and Melchior Method.
Monthly Average Runoffin Unda Watershed by Nakayasu Unit Hydrograph Method
Distribution of hours rain is important in this method. To get the distribution of hours rain, it needs concentration rain data, if the data is not available, so for the calculation of its can use formula from Dr. Mononobe. Figure 1 shows Distribution of Hours Rain in Unda Watershed and Figure 2 shows Nakayasu Unit Hydrograph in Unda Watershed. Table 1 and 2 shows Recapitulation of Monthly average and Peak of Runoff from 1999 to 2003 (Nakayasu Unit Hydrograph Method).

Figure 1 Distribution of Hours Rain in Unda Watershed
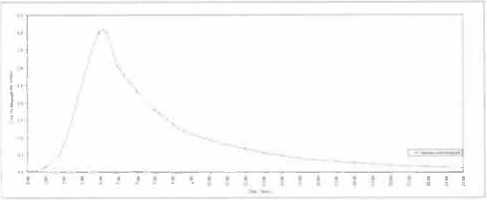
Figure 2 Nakayasu Unit Hydrograph in Unda Watershed
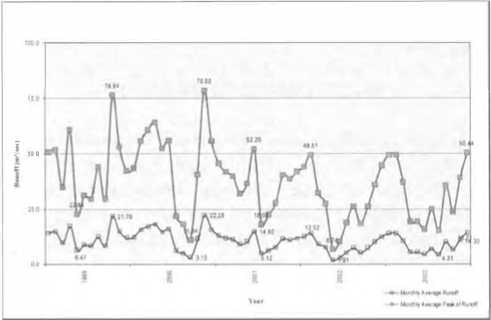
Figure 3 Monthly Average Runoff and Peak Runoff from 1999 to 2003 (Nakayasu Unit Hydrograph Method)
In 1999 the highest runoff occurs in October (21.70 m3/s), the lowest one occurs in May (6-47 m3/s) and the average was 12-48 m3/s, In 2000 the highest runoff occurs in November (22.28 m3/s), the lowest one occurs in September (3.13 m3/s) and the average was 13.20
Table 1 Recapitulation of Monthly Average Runoff from 1999 to 2003 (Nakayasu Unit Hydrograph Method)
|
No. |
Montb |
MonthlyA vcrage Runoff m1/scc |
Monthly Average Runoff m3/scc |
Monthly Avcragc Runoff m1,^ |
MonthlyAverage Runoff m1/sec |
MonthlyAverage Runoff m1 /sec |
|
1999 |
2000 |
2001 |
2002 |
2003 | ||
|
January |
14.39 |
12.38 |
12.96 |
12.52 |
14.03 | |
|
2 |
Febn.ery |
14.68 |
15.81 |
11.89 |
14.03 |
14.02 |
|
3 |
......., |
9.91 |
17 21 |
I I.JS |
9 IS |
10.56 |
|
4 |
^ |
17.34 |
18 20 |
908 |
7 78 |
S.46 |
|
5 |
....., |
647 |
14 85 |
I0.36 |
1.91 |
S.50 |
|
6 |
Juno |
8.88 |
15.89 |
14.80 |
2.93 |
4.51 |
|
7 |
July |
8.40 |
6 21 |
S.12 |
S.38 |
7.06 |
|
8 |
August |
12.49 |
516 |
6.36 |
743 |
4.31 |
|
9 |
September |
8.39 |
3.13 |
7.85 |
S.23 |
10.06 |
|
10 |
OdOO., |
21.70 |
II.SS |
II.SO |
7.43 |
6.75 |
|
11 |
November |
IS.04 |
22.28 |
11.02 |
10.18 |
II IS |
|
12 |
December |
12 03 |
15.79 |
11,93 |
12.69 |
14.30 |
|
TOTAL |
149.71 |
JSR 45 |
124 22 |
9666 |
107 71 | |
|
Table 2 Recapitulation of Monthly Average Peak Runoff from 1999 to 2003 (Nakayasu Unit Hydro- | ||||||
|
graph Method) | ||||||
|
Monthly Average |
Monthty Avcngc |
MonthJy Avcragc |
MonthlyA,eragc |
MonthlyAverage | ||
|
No. |
Month |
Peak Runoff |
Peak Runoff |
Peak Ruooff |
Peak Runoff |
Peale Ruooff |
|
m3/sec |
mJ/s« |
m1/scc |
m1/sec |
m1/sec | ||
|
1999 |
2000 |
2001 |
2002 |
2003 | ||
|
1 |
Jonuo,y |
50.77 |
43.66 |
45.71 |
44.IS |
49.51 |
|
2 |
Februl,y |
Sl.78 |
55.76 |
41.95 |
49.SI |
49.45 |
|
3 |
Mwch |
34.95 |
60.71 |
40.03 |
32.29 |
37.25 |
|
^ |
61 16 |
64 21 |
32.04 |
27.44 |
19.28 | |
|
5 |
May |
22.84 |
52.38 |
36.SS |
6.74 |
19.40 |
|
6 |
J- |
31.31 |
56.05 |
52.20 |
10.32 |
15.90 |
|
7 |
July |
29.65 |
21.90 |
18.06 |
18.98 |
24.91 |
|
e |
August |
44.06 |
18.19 |
22.44 |
26.21 |
15.21 |
|
9 |
September |
29.59 |
11.04 |
27.70 |
18.47 |
35.49 |
|
10 |
Oc1obo< |
76.54 |
40.75 |
40.57 |
26.21 |
23.82 |
|
11 |
November |
SJ.OS |
78.62 |
38.88 |
35.9) |
39 )4 |
|
12 |
December |
42 44 |
SS 72 |
42 08 |
44 76 |
so 44 |
|
TOTAi. |
528.15 |
558 97 |
438 21 |
341 01 |
JRO 00 | |
m3/s, while in 2001 the highest runoff occurs in June (14.8 m3/s), the lowest one occurs in July (5.12 m3/s) and the average was 10.35 m3/s, It was not much different with the previous runoff, in 2002 the highest runoff occurs in February (14.03 m3/s), the lowest one occurs in May (1.91 m3/s) and the average was 8.06 m3/s, in 2003 the highest runoff occurs in December (14.30 m3/s), the lowest one occurs in August (4.31 m3/s) and the average was 8.98 m3/s. The same method also employed in Telagawaja watershed but in different condition. In Telagawaja watershed, Nakayasu runoff hydrograph was in runoff design (2 years maximum rainfall design). The analysis result showed the average peak runoff was 236.67 m3/s, and the average was 61.32 m3/s (Balai Wilayah Sungai Bali-Penida, 2004). While in Brantas watershed showed the average peak runoff was 277 m3/s, and the average was 61.32 m3/s (Balai Wilayah Sungai Bango Gedangan, 2002).
Monthly Average Runoff in Unda Watershed by Melchior Method
In 1999 the highest runoff occurs in October (43-40 m3/s), the lowest one occurs in May (9.74 m3/s) and the average was 22.20 m3/s, while in 2000 the highest runoff occurs in November (44.55 m3/s), the lowest one occurs in September (4-46 m3/s) and the average was 25.25 m3/s, next in 2001 the highest runoff occurs in June (26.16 m3/s), the lowest one occurs in July (7.82 m3/s) and the average was 17.34 m3/s, about condition in 2002 the highest runoff occurs in February (24.62 m3/s), the lowest one occurs in May (2.15 m3/s) and the average was 12.84 m3/s, and then in 2003 the highest runoff occurs in January (26.77 m3/s), the lowest one occurs in August (7.02 m3/s) and the average
was 15.72 m3/s. Table 3 and Figure 4 shows the recapitulation and figure of monthly average runoff from 1999 to 2003 by Melchior Method.
Comparison of Monthly Average Runoff BetweenNakayasu Unit Hydrograph and Melchior Method
By using Nakayasu Unit Hydrograph Method it obtained the Monthly Average runoff and peak runoff. In the other hand it obtained the monthly average runoff only for Melchior Method. So, the monthly average runoff had compared in this study and the COmpariSOn both Of them is shown in Figure 5.
Based on the monthly average runoff result, it shows that Nakayasu Unit Hydrograph Method gives a lower value than Melchior one. This is because Nakayasu Unit Hydrograph Method divided rain into hours in detail, while Melchior Method gives total runoff. This caused runoff by Melchior Method
gave a higher value than Nakayasu Unit Hydrograph. Both of those runoff pattern was quite similar. The different percentage between these methods was 59.71%.
Monthly Average Discharge in Unda Watershed
Pursuant to the result of runoff analyzis above
(Nakayasu Unit Hydrograph Method), hence river
discharge to every period had following equation
estimated with the
+ Bf
Q = Q Where:
runoff
Q Monthly Average Discharge
Qrunoff = Monthly Average Runoff Bf = Baseflow
Monthly Average Baseflow in Unda Watershed byNreca Formula
Nreca Formula employed to analyze the baseflow in Unda Watershed. Nreca is a simple model of monthly water balance simulation for the stream of rain data,
Table 3 Recapitulation of monthly average runoff from 1999 to 2003 (Melchior Method).
|
Month |
Monthly Average Ruooff(m'lsec) | ||||
|
1999 |
2000 |
2001 |
2002 |
2003 | |
|
January |
24.868 |
21.617 |
22.485 |
21 616 |
26.766 |
|
Pdmmy |
25.560 |
28.662 |
20.386 |
24.623 |
26.766 |
|
March |
16.457 |
31929 |
19.325 |
15.088 |
26.696 |
|
Apnl |
31.547 |
34.262 |
14.953 |
12.479 |
18.519 |
|
May |
9.738 |
26.607 |
17.409 |
2.149 |
9.093 |
|
June |
13.743 |
28.852 |
26.163 |
4.038 |
9.155 |
|
July |
13.141 |
9.770 |
7.824 |
8.260 |
7.107 |
|
August |
21.666 |
7.982 |
9.911 |
11.826 |
12.008 |
|
Sq:itcmber |
13.058 |
4.456 |
12.618 |
8.015 |
6.719 |
|
OCU>b<r |
43.401 |
19.979 |
19.621 |
11824 |
18.289 |
|
NOfl<"'bcr |
26.642 |
44.550 |
18.689 |
17.0()7 |
11.499 |
|
Oeambtt |
26 603 |
44.369 |
18.696 |
17.082 |
20.591 |
|
TOTAL |
266.422 |
303.034 |
208.078 |
154.067 |
193.210 |
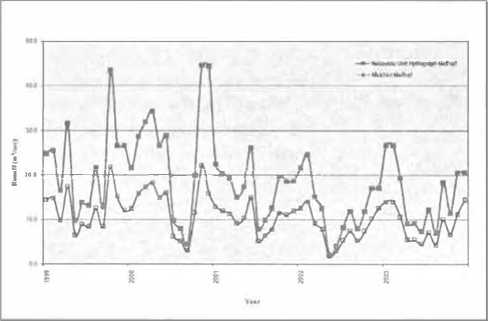
Figure 5 Monthly Average Runoff by Nakayasu Unit Hydrograph and Melchior Method from 1999 to 2003
Table 4 Recapitulation of Baseflow from 1999 to 2003
|
Month |
Monthly A\eragc Basdlow (m1∕s) IQQQ |
Monthly Average Basdlo" (rτΛs) :woo |
Monthly A,·cragc B..i.sctlow (ml.rs) 2001 |
Monthly Average 8.lSC'tlow (m’ls) 2002 |
Mu,.hly A,cragc Ba.•;d]o"' (m’/s) 2003 |
|
JW— |
15.12 |
14 11 |
20.29 |
IR.63 |
20.75 |
|
,........,. |
IR 89 |
17.39 |
17.R7 |
23.30 |
21.28 |
|
March |
IH7 |
20 10 |
14 70 |
19 61 |
20.4i9 |
|
A^ |
17.67 |
20.27 |
14 77 |
13.7R |
12.90 |
|
May |
10.75 |
19 26 |
9.27 |
8)8 |
9.93 |
|
Jl_ |
6.57 |
15.91 |
10.21 |
4 76 |
6.SI |
|
J,ly |
4.92 |
10.54 |
8 24 |
3.67 |
4.97 |
|
A^» |
3.55 |
6.61 |
5.42 |
3.47 |
4.74 |
|
Sq,c,mba- |
2.79 |
3.66 |
4 34 |
3.32 |
6.95 |
|
^^A« |
9.16 |
4 14 |
6.06 |
3.94 |
9.14 |
|
\i<WCl'llbcr |
13.81 |
17.35 |
10.20 |
6.84 |
IO.II |
|
ll<ttmha |
14.60 |
17.97 |
14 34 |
IOR |
IR% |
|
AVERAGE |
11 14 |
1194 |
11.31 |
10.16 |
12 24 |
flpr..\t•"'1"0al) A"'"-C-9t•Nff .. l.M• "'MenlMIISy\l.litlt.lw'1,o,.... (1..,1NJ)
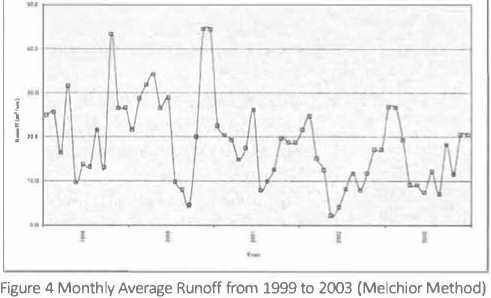
Table 5 Recapitulation of Monthly Average River Discharge From 1999 to 2003
|
No. |
Month |
River Discharge (m1/sec) | ||||
|
1999 |
2000 |
2001 |
2002 |
2003 | ||
|
1 |
January |
29.51 |
26.49 |
33.25 |
31.15 |
34.78 |
|
2 |
February |
33.57 |
33.20 |
29.76 |
37.33 |
35.30 |
|
3 |
March |
25.78 |
37.31 |
26.05 |
28.77 |
31.15 |
|
4 |
Aprt |
35.01 |
38.47 |
23.85 |
21.56 |
18.36 |
|
5 |
May |
17.22 |
34.11 |
19.63 |
10.29 |
15.43 |
|
6 |
JLne |
15.45 |
31.80 |
25.00 |
7.69 |
11.02 |
|
7 |
July |
13.32 |
16.75 |
13.36 |
9.05 |
12.03 |
|
8 |
August |
16.04 |
11.77 |
11.78 |
10.90 |
9.06 |
|
3 |
September |
11.18 |
6.79 |
12.20 |
8.56 |
17.01 |
|
10 |
October |
30.86 |
15.69 |
17.56 |
11.37 |
15.89 |
|
11 |
November |
28.84 |
39.64 |
21.22 |
17.02 |
21.26 |
|
12 |
December |
26.63 |
3377 |
26.27 |
27.27 |
33.25 |
|
AVERAGE |
23.62 |
27.15 |
21.66 |
18.41 |
21.21 | |
evapotranspiration and hydrology characteristic of catchment area. Step of calculation includes some phases, calculation can be done column by column from first to the last column (Ibnu Kasiro et al., 1994). Table 4 shows the recapitulation of baseflow in Unda Watershed from 1999 to 2003
The result of baseflow analysis showed in 1999 the highest baseflow occurs in February (18.89 m3/s) and the lowest one occurs in September (2.79 m3/s). Based
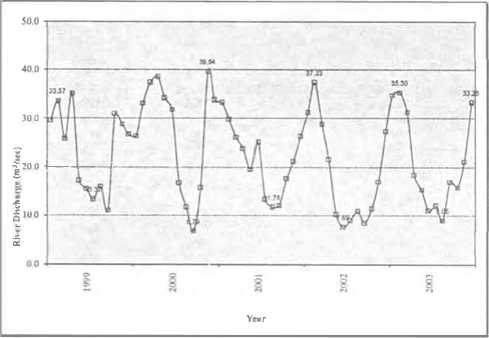
Figure 6 Monthly Average River Discharge from 1999 to 2003.
on the baseflow analysis results from 1999 to 2003 showed the highest baseflow occurs in 2000 (13.94 m3/s) and the lowest one occurs in 2002 (10.36 m3/s). Based on the river discharge analysis by Nakayasu Unit Hydrograph runoff showed the highest river discharge occurs in 2000 (27.15 m3/s) and the lowest one occurs in 2002 (18-41 m3/s). The baseflow since the last four years generally was getting lower than before. This condition was also happened in the lake Batur. The condition of the lake water level showed a significant decline further from 2000 until 2005 (Bapedalda, 2008).
From monthly average runoff and the baseflow, it obtained monthly average river discharge from 1999 to 2003. Table 5 and Figure 6 shows the recapitulation and the figure of Monthly Average river discharge from 1999 to 2003.
The monthly average river discharge in Unda Watershed as follow: In 1999 the highest river discharge occurs in April (35.01 m3/s), the lowest one occurs in September (11.18 m3/s) and the average was 23.62 m3/s, while in 2000 the highest river discharge occurs in November (39.64 m3/s), the lowest one occurs in September (6.79 m3/s) and the average was 27.15 m3/s, next in 2001 the highest river discharge occurs in January (33.25 m3/s), the lowest one occurs in August (11.78 m3/s) and the average was 21.66 m3/s, about condition in 2002 the highest river discharge occurs in February (37.33 m3/s), the lowest one occurs
in June (7.69 m3/s) and the average was 18,41 m3/s, and then in 2003 the highest river discharge occurs in February (35.30 m3/s), while the lowest one occurs in August (9.06 m3/s) and the average was 21.21 m3/s.
Validation of Runoff
Validation in this research done by comparing river discharge as a result of analysis with data of Water Level Recorder (WLR) from Dam Tukad Unda as a secondary data. From secondary data analysis obtained the highest monthly average WLR data occurs in 1999 (12.80 m3/s) and the lowest one occurs in 2002 (9.05 m3/s). One important thing in using this WLR data was whether the WLR data must be added by water use in upstream of the WLR location, because water (river discharge) that recorded in the WLR was the residual water from the upstream. The highest monthly average water use in upstream of WLR occurs in May (9.69 m3/s) and the lowest one occurs in August (3,42 m3/s). From the analysis result showed the highest monthly average WLR data occurs in 1999 (19.70 m3/s) and the lowest one occurs in 2002 (15.95 m3/s). The pattern of monthly average river discharge both of analysis result and data were quite similar. From analysis obtained the average of river discharge was 22.63 m3/s. The average of monthly average river discharge from WLR was 18.24 m3/s. Based on research by Environmental Research Center (PPLH) Research Institute of the University of Udayana, Buyan Lake water levels have decreased as much as 5 meters in the period 2003 to 2005. Entering 2006, the condition of the lake water level showed a significant decline further. From research of PPLH, found there are three factors causing the decline of water level of the lake Buyan and Tamblingan because of the rainfall is very low. The rainfall in the area of the lake since the last five years wass much lower than before. This condition was also happened in the lake Batur. The condition of the lake water level showed a significant decline further from 2000 until 2005 (Bapedalda, 2008). This condition was an effect of climate change. The annual precipitation overall has decreased by two to three percent across all of Indonesia over the last century. However, there was significant spatial variability, there has been a decline in annual rainfall in the southern regions of Indonesia (e.g., Java, Lampung, South Sumatra, South Sulawesi, Bali and Nusa Tenggara) and an increase in precipitation in the northern regions oflndonesia (e.g., most of Kalimantan, North Sulawesi) (WWF, 2007).
From the analysis result showed generally river discharge from WLR data gives lower values and the different percentage between those river discharge was 66.37%. This might be of some reason
From the analysis result showed that generally river discharge from WLR data gives lower values and the average of correlation between those river discharge is 66.37°A,. This might be of some reason : (1) Measurement accuracy of discharge data. Discharge data is observed visually by looking the ruler measuring with the eye. (2) Measurement accuracy of rain. All of the rain gauge at
the study area is a manual rain gauge where recording data is performed every morning. The weakness of this measurement is we do not know how many times a day it rains occur. This will give much larger rain data in case of rain which occurs more than once a day. (3) Profile of the river changes every time because of the erosion and sedimentation process, but data readings on WLR now is stilll using river profile in the early planning of the Dam Tukad Unda. This leads to inaccurate data readings. (4) In runoff analyzed, there is about 6.373 km2 consists of cloud and cloud shadows. This causes the lost of a number of runoff that should be counted because some areas was not counted in runoff analyzed. (5) Nakayasu unit hydrograph method was developed based on research in Japan, climate and characteristic of watershed might be difference with Indonesia. That might be a reason that influence result analysis. Table 6 shows the estimation of water use in upstream of WLR, Table 7 shows the recapitulation of monthly average river discharge from 1999 to 2003 after added by water use average in upstream of WLR and Figure 7 shows the Monthly Average river discharge both of Nakayasu Unit Hydrograph Method and Water Level Recorder (WLR Data).
From the Figure 7, it shows that the pattern of monthly average river discharge both of those method is quite similar. From analysis obtained the average of river discharge is 22.63 m3/s. The average of monthly average river discharge from WLR is 18.24 m3/s. The different percentage between these river discharge was 66.37°A,.
Table 7 Recapitulation of Monthly Average river discharge from 1999 to 2003 (WLR Data Analysis)
|
Mon1hly |
Monthly |
Monthly |
Monthly |
Monthly | |
|
A^crageWLR |
AverageWLR |
AverageWLR |
AverageWLR |
AverageWLR | |
|
Monlh |
Data |
Data |
Data |
Data |
Data |
|
(m'/s) |
(m'/s) |
(m'ls) |
(m'/s) |
(m'/s) | |
|
19'19 |
2000 |
2001 |
2002 |
200) | |
|
Januafy |
27.70 |
22 41 |
23.69 |
22.21 |
2S.4S |
|
.^i |
27.71 |
21 ^6 |
21.21 |
24.96 |
22.67 |
|
...,.. |
28.77 |
22.63 |
18.63 |
14.SO |
15.70 |
|
Apnl |
29.01 |
18.94 |
22.30 |
IS.SI |
17.74 |
|
..y |
28.89 |
21.94 |
20.79 |
19.04 |
21.02 |
|
JuiK |
IS.S7 |
24.70 |
24 41 |
IS.44 |
IS.52 |
|
J,ly |
14 44 |
16.80 |
16 21 |
IS OS |
13 90 |
|
A1.1pll |
11.28 |
12.70 |
11.06 |
10.32 |
9.44 |
|
^φ^^^ |
II 77 |
12.73 |
12.88 |
10.95 |
12.22 |
|
^^f |
11.64 |
16.00 |
18 38 |
11.37 |
IS.78 |
|
N^^^ |
1235 |
21.59 |
19.02 |
14.0S |
16.61 |
|
Doccmba- |
17.34 |
19.66 |
18.58 |
17.97 |
21.19 |
|
AVFRAC.F |
19.70 |
1933 |
18 9^ |
IS 95 |
17 27 |
CONCLUSION AND SUGGESTION
Conclussion
Based on the analyzis results, the conclusion of this study are:
-
1. The land cover conditionss in Unda Watershed were consisted of 38.129 km2 of forest area (16.357°A.), 19.122 km2 of grassland area (8.203%), 100.991 km2 of farmland area (43.325%), 62,412 km2 of area housing (26.775%), 2.625 km2 of water area (1.126%), 4.046 km2 of cloud area (1.736%), 2.327 km2 cloud shadows (0.998%) and 3.448 km2 of stone area (1.749%).
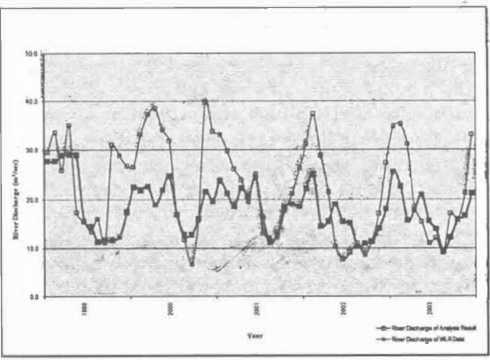
Figure 7 Monthly Average River Discharge from 1999 to 2003 (Nakayasu Unit Hydrograph Method and Water Level Recorder (WLR Data)
-
2. The Monthly Average runoff in outlet of Unda Watershed consist of two kind of results bellow a. Monthly average runoff by Nakayasu Unit
Hydrograph Method
-
- In 1999
The highest runoff occurs in October (21.70 m3/s), the lowest one occurs in May (6-47 m3/s) and the average was 12.48 m3/s.
-
- In 2000
The highest runoff occurs in November (22.28 m3/s), the lowest one occurs in September (3.13 m3/s) and the average was 13.20 m3/s.
-
- In 2001
The highest runoff occurs in June (14.8 m3/s), the lowest one occurs in July (5.12 m3/s) and the average was 10.35 m3/s.
-
- In 2002
The highest runoff occurs in February (14.03 m3/s), the lowest one occurs in May (1.91 m3/s) and the average was 8.06 m3/s.
-
- In 2003
The highest runoff occurs in December (14.30 m3/s), the lowest one occurs in August (4.31 m3/s) and the average was 8.98 m3/s.
-
b. Monthly average runoff by Melchior Method
-
- In 1999
The highest runoff occurs in October (43-40 m3/s), the lowest one occurs in May (9.74 m3/s) and the average was 22.20 m3/s.
-
- In 2000
The highest runoff occurs in November (44.55 m3/s), the lowest one occurs in September (4-46 m3/s) and the average was 25.25 m3/s.
-
- In 2001
The highest runoff occurs in June (26.16 m3/s), the lowest one occurs in July (7.82 m3/s) and the average was 17.34 m3/s.
-
- In 2002
The highest runoff occurs in February (24.62 m3/s), the lowest one occurs in May (2.15 m3/s) and the average was 12.84 m3/s.
-
- In 2003
The highest runoff occurs in January (26.77 m3/s), the lowest one occurs in August (7.02 m3/s) and the average was 15.72 m3/s.
-
3, The Monthly Average discharge in outlet of Unda Watershed as bellow:
Ifi 1499
1he highest river discharge occurs in April (35.01 m3/st the lowest one occurs in September (11.18 m3/s) and the average was 23.62 m3/s.
-
- In 2000
'l'he highest river discharge occurs in November (39.64 m3/s), the lowest one occurs in September (6.79 m3/s) and the average was 27.15 m3/s.
-
- In 2001
The highest river discharge occurs in January (33.25 m3/s), the lowest one occurs in August (11.78 m3/s) and the average was 21.66 m3/s.
-
- In 2002
The highest river discharge occurs in February (37.33 m3/s), the lowest one occurs in June (7.69 m3/s) and the average was 18-41 m3/s.
-
- In 2003
The highest river discharge occurs in February (35.30 m3/s), the lowest one occurs in August (9.06 m3/s) and the average was 21.21 m3/s.
Suggestion
There are some important suggestions from this study as follow :
-
1. In estimating runoff it is better to use formula that considers the conditions of land cover, land slope and soil type, like Nakayasu unit Hydrograph. Beside it, this formula divides rain into hours, this will give more acurate results.
-
2. Using clear image to get land cover mapping, because the cover of clouds and cloud shadows will influences runoff values. This causes the lost of a number of runoff that should be counted.
-
3. Using automatic rain gauge data. All of the rain gauge at the study area is a manual rain gauge where recording data is performed every morning. The weakness of this measurement is we do not know how many times a day it rains occur. This will give much larger rain data in case of rain which occurs more than once a day.
-
4. One important thing in using WLR (Water Level Recorder) data is whether the WLR data can not be used directly and must be added by water use in upstream of the WLR location, because water (river ilischarge) that recorded in the WLR is the residual water from the upstream.
-
5. It is better for the Government to monitoring and maintain the WLR so discharge data recording is accurate.
-
6. It is better for Hydrology Expert in Indonesia to do some research or modificate the existence of unit hydrograph method that suitable in Indonesia.
REFERENCES
Balai Wilayah Sungai Bali-Penida. 2004. Laporan Hidrologi Pengembangan Potensi Tukad Telagawaja di Kabupaten Karangasem. Pemerintah Provinsi Bali, BWS-BP.
Balai Wilayah Sungai Bali-Penida. 2007. Publikasi Data Daerah Aliran Sungai Provinsi Bali. Pemerintah Provinsi Bali, BWS-BP.
Balai Wilayah Sungai Bali-Penida. 2007. Studi Konservasi Danau Buyan. Pemerintah Provinsi Bali, BWS-BP.
Balai Wilayah Sungai Bali-Penida. 2010. Studi Pengembangan Pemanfaatan Mata Air Metaum Di Kabupaten Tabanan. Pemerintah Provinsi Bali, BWS-BP.
Badan PengendalianDampak Llngkungan Daerah (BAPEDAL-DA). 2008. Kajian Penurunan Muka Air Danau Batur. Pemerintah Provinsi Bali, Bapedalda.
Ibnu Kasiro, Wanny Rusli, Bhre Susantini, Sunarto, 1994, Pedoman Kriteria Desain Embung Kecil untuk Daerah
Semi Kering di Indonesia. Jakarta : Departemen Pekerjaan Umum.
Mather, P.M.. 2009. Classification Methods For Remotely Sensed Data, Second Edition. CRC Press. Florida-Indonesia
Nakayasu in Soemarto, CD. 1987. Hidrologi Teknik. Surabaya: Usaha Nasional.
PPLH UNUD. 2006. Studi Penurunan MukaAir Danau Buyan dan Tamblingan. Badan Pengendalian Dampak Lingkungan Daerah (BAPEDALDA) Provinsi Bali Bekerjasama dengan Pusat Penelitian Lingkungan Hidup (PPLH) Lembaga Penelitian Universitas Udayana. Denpasar
Wikipedia. 2009. Surface Run Off. (Serial Online), July [cited 2010 Julyo9] Available from: URL: httiiJLen.wikipedia. org/wiki/surface_runoff.
WWF (World Wide Fund For Nature). 2007. Climate Change in Indonesia. October [cited 2007 October 25). Available from URL : http://worldwildlife.org/climate_change_ in_indonesia.
101
Discussion and feedback