SEASONAL DISTRIBUTION OF TOTAL SUSPENDED MATTER IN SUMBAWA SEA
on
ECOTROPHIC • 6 (1) : 26 - 30
ISSN : 1907-5626
SEASONAL DISTRIBUTION OFTOTAL SUSPENDED MATTER IN SUMBAWA SEA
IGAG SWANDANA 1), T. OSAWA 1), I. N. MERIT 2) lJ Center for remote sensing and Ocean sciences (CreSOS), udayana university 2! Magzster Program of Environmental Study, Post Graduate Program of Udayana University
ABSTRAK
Distribusi Musiman Total Suspended Matter (TSM) di Laut Surnbawa (117" - us· Edans· - 9· S) telah dilakukan. Data TSM tersebut diperoleh dari 75 stasiun pengukuran pada bulan September 2005 dan 98 stasiun pengukuran pada bulan November 2005 dan April 2006. Besaran sebaran TSM diperoleh dari hasil perhitungan besaran turbidity yang diperoleh dari pengukuran dengan menggunakan alat CTD (Conductivity, Temperature and Depth) Sensors. Besaran TSM yang diperoleh dari besaran turbidity menggunakan rurnus TSM = 0,65 Tur+ 1,17 (r = 0,85) (Hoshika dan Tanimoto, 1997).
Distribusi sebaran TSM pada saat musim hujan menunjukkan bahwa besarnya bervariasi dari L060 sampai 2.951 mg/1 dengan rata-rata sebesar 1.152 mg/1 (n=98), di lain pihak pada saat musim kemarau distribusi sebaran TSM menunjukkan bahwa besarnya bervariasi dari 1.060 sampai 2.899 mg/1 dengan rata-rata sebesar 1.111 mg/I (n=75). Distribusi sebaran TSM secara vertical dari permukaan laut sampai dengan kedalaman 20 meter menunjukkan bahwa terjadi perbedaan yang signifikan antara musim kemarau dan musim hujan. Pada saat musim kemarau distribusi sebaran TSM pada permukaan laut sampai dengan kedalaman 20 meter mempunyai variasi yang kecil (dari 1.079 sampai 1.599 mg/1); Pada saat musim hujan distribusi sebaran TSM pada permukaan laut sampai dengan kedalaman 20 meter mempunyai variasi yang sangat besar (dari 1.079 sampai 2.698 mg/1). Distribusi sebaran TSM dari kedalaman 20 meter sampai dengan 100 meter menunjukkan pola yang sama antara musim kemarau dan musim hujan.
Distribusi sebaran TSM pada permukaan laut (dekat sungai/muara) menunjukkan bahwa terjadi perbedaan sebaran antara musim kemarau dan musim hujan. Demikian juga dengan distribusi sebaran TSM yang diperoleh dari data satelit menunjukkan bahwa terjadi perbedaan sebaran antara musim kemarau dan musim hujan. Perbandingan antara data in situ dengan data satelit menunjukkan bahwa koefisen korelasinya sebesar -0-753 untuk periode penelitian tersebut.
Kata kunci : Total Suspended Matter, Turbidity, Musim, Distribusi Vertikal, Distribusi Horisontal dan Data Satelit.
ABSTRACT
Seasonal distributions of Total Suspended Matter (TSM) in Surnbawa Sea (117" - us· Eands· - 9· S) investigated. TSM data were collected from 75 observed stations in September 2005 and 98 observed stations in November 2005 and April 2006. TSM concentrations were calculated from the values of turbidity which is observed using CTD (Conductivity, Temperature andDepth) Sensors. The correlation between turbidity and TSM concentration (mg/1) was expressed as TSM = 0,65 Tur+ 1.17 (r = 0,85). (Hoshika and Tanimoto, 1997).
During RainySeason the variability ofTSM concentrations showed from 1.060 to 2.951 mg/1 and the average value is 1.152 mg/1 (n=98), On the other hand during dry season the variability of TSM concentrations from 1.060 to 2_899 mg/1 and the average value is 1.111 mg/1 (n=75). The vertical distributions ofTSM concentration from surface to 20 meter showed significantly different between dry and rainy season. During dry season the vertical distributions ofTSM concentration at surface have a small variation (from 1.079 to 1.599 mg/1); during rainy season the vertical distributions ofTSM concentration at surface have a wide variation (from 1-079 to 2.698 mg/1). TSM pattern from depth 20 to 100 meter showed similar to dry and rainy season.
Horizontal distributions ofTSM concentrations (near river) showed different patterns between dry and rainy season. However the average TSM concentration derived from satellite data showed a slight difference between them. The comparison between in situ data and satellite data showed the correlation coefficient is -0.753 while observed period.
Keywords : Total Suspended Matter, Turbidity, Season, Vertical Distribution, Horizontal Distribution and Satellite Data.
INTRODUCTION
Every year, 20 billion tons of sediments are brought to the oceans by the rivers. Among these particles, the finest ones enrich or inhibit the coastal ecosystems, and distribute the fixed or adsorbed pollutants of metal, chemical or organic origin. The coarser particles, mainly sand, constitute the principal source of material fattening the beaches. Coastal morphodynamics results from the balance between land inputs and offshore sediment transport. Studying sediment composition, transport and fate in coastal zones is thus necessary both from the biological point of view (ecosystems' health) and for civil engineering and coastal management. Remote sensing brings efficient tools to monitor sediment transport and analyze the fate and distribution of suspended matter in riverine and coastal waters since it offers a synoptic and instantaneous vision field of the Total Suspended Matter (TSM) concentration (Ouillon et al. 2008).
TSM is also referred to as Suspended Particulate Matter (SPM) or Total Suspended Solids (TSS) in the literature. Integrated studies couple numerical simulations of sediment transport and spatial imaging, the 1mages making it possible to gauge and validate the models (Puls et al. 1994; Estournel et al. 1997; Siegel et al. 1999; Ouillon et al. 2004).
TSM is a water quality measurement and generally consists of mud, grain sand, and small organic matter. These suspended materials serve as a carrier and storage agent of pesticides, absorbed phosphorus, nitrogen and organic compounds and can be an indicator of pollution (Zhou et al., 2005).
As a key parameter of water quality, the high level of TSM in the water indicates a high pollution. High TSM also will block the penetration of sun light to the water column and it will disturb the photosynthesis process by plant, consequently it affects other species dependent on those plants, such as fish and shellfish. TSM also an important parameter for coral reef to growth.
Hoshika and Tanimoto (1997) reported that TSM have a high relationship with turbidity (r=0.85), this high correlation allow convert the TSM concentration (mg/I) from the measured data denved from turbidity sensors.
The use of remote sensing to map suspended sediment concentration is well established for a variety of water types. A common method 1s to relate remotely sensed reflectance measured in the red portion (ca. 600-700 nm) of the visible spectrum to parameters of water column sediment or particulate matter concentration. This approach is reasonably robust in coastal and inland waters because scattering from suspended materials frequently dominates the reflectance spectra when compared to pure water and phytoplankton ab-
sorption (Kirk, 1994; Mobley, 1994). MODIS band 2 provides coverage in the red spectral region (841-876 nm) at sensitivity sufficient for coastal water studies. Therefore, the characteristics of MODIS band 2 data, such as its medium spatial resolution (250 m), red band reflectance, high sensitivity, and near daily coverage, suggest that these images may be well suited for examining suspended particulates in coastal environments, particularly smaller bodies of water such as bays and estuaries.
Sumbawa Sea (116°40'-119020' E and go_9o S) known as the area with relatively clear water, calm and generally suitable for aquaculture activity such as oyster's culture, seaweed culture and for artificial coral ree£ The most important reason, the area which is in Sum-bawaSea has not so many human activities in this area. So that, condition of territorial water is clean enough to analyze when compare with the condition of territorial water around Bali Island (Anonymous, 2002).
In this study, the vertical distributions and horizontal distributions of TSM converted by turbidity sensors between dry season and rainy season were investigated. The horizontal distributions of TSM were compared with AQUA MODIS satellite data in dry and rainy season in study area.
The first aim of this research is to obtain the estimation of TSM converted from turbidity sensors in dry and rainy seasons. The second aim of this research is to obtain the comparison of in situ TSM and TSM derived from satellite data in dry and rainy seasons.
The result of this research can be giving research knowledge in satellite data analysis and validation of interpretation accuracy, also compare with in situ observation; giving information about natural and physical phenomena of Sumbawa Sea in particularly from satellite imagery; and become the input substance for planning of pollutant management in Sumbawa Sea.
RESEARCH METHODOLOGY
The research location was focused in Sumbawa Sea, which occupies range between 117 - 118" E ands· - 9 · S. In Situ Data using CTD Sensors derived from Kyowa Concrete which collected from 2005 to 2006 in the Northern part of Sumbawa. In every station which extracted to obtain information of geographic position using GPS (Global Positioning System), the data were recorded every 0.5 meter from surface (0 meter) to 100 meter depth.
Total Suspended Matter concentrations were estimated using relationship between TSM and turbidity derived from in situ observation. Hoshika and Tanimoto (1997) reported that the value measured with a turbidity sensor were converted into the TSM concentration (mg/1) using a calibration curve between the TSM in the water samples and the measured value
(turbidity), r = 0.85:
TSM = 0,65 Tur + 1.17 (r = 0,85)
Where:
TSM concentration (mg/I)
Tur: Turbidity (FTU/Formazine Turbidity Unit)
Turbidity measures the scattering of light through water caused by materials in suspension or solution. The suspended and dissolved material can include clay, silt, finely divided organic and inorganic matter, soluble colored organic compounds, and plankton and other microscopic organisms.
MODIS imagery is the satellite data with acceptable spatial resolution (250 m) and sufficient revisit times (up to 4 times a day) potentially available for monitoring dredging plumes. These advantages to determine the potential use of MODIS imagery in an optically sophisticated environment coastal water for monitoring of total suspended matter in natural conditions and near dredging activities. It was found that there is linear correlation between MODIS reflectance and the total suspended matter concentration measured from water samples.
Satellite data were processed using SeaDAS and Arc View software to obtain the value of TSM concentration. TSM concentration derived from MODIS-Aqua satellite by applying algorithm provided by Dennis Clark.
x = loglO ( (nLw443 + nLw490) / nLw551 ) TSM = 10 " ( A + Bx + Cx"2 + Dx"3 + Ex"4 + Fx"5)
where nLw is normalized water leaving radiance (reflectance) for the given band and A,B,C,D,E,F are coefficients.
|
A |
= 0.51897 |
D |
= -4.35315 |
|
B |
= -2.24106 |
E |
= 9.07162 |
|
C |
= 1.20113 |
F |
= -5.10552 |
RESULT AND DISCUSSION
The in situ data were observed in the Northern area of Sumbawa Sea with total 173 observed stations:
From 5 to 9 September 2005 (represent dry season) with total 75 observed stations.
From 14 to 18 November 2005 and 24 to 25 April 2006 (represent rainy season) with total 98 observed stations.
During dry season and rainy season, only 41 stations were same location.
During dry season the horizontal distribution of TSM concentrations are vary from 1.079 to 1.599 mg/I while rainy season the horizontal distribution of TSM concentration are vary from 1.079 to 2.698 mg/I. It is indicating during the rainy season, surface TSM was significantly increased, especially at the near river area.
It is well known that the volume and velocity of water transports from river were increasing, this water
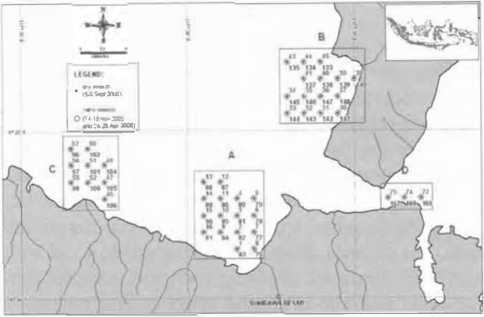
Figure 1. Location of In Situ Data Collection at same Station during Dry Season (5-9 Sept 2005) and Rainy Season (14-18 Nov 2005 and 24-25 Apr 2006).
|
Table 1. The Range and Average of Integrated Vertical Otstribution of TSM | ||||
|
Depth |
Location |
Range |
Average |
Season |
|
20 m |
A |
2. 158-2.386 |
2.230 |
Dry |
|
B |
2.158-2.379 |
2.196 |
Dry | |
|
c |
2.171-2.798 |
2.294 |
Dry | |
|
D |
2.269-2.308 |
2.295 |
Dry | |
|
40 m |
A |
3.244-3.517 |
3.332 |
Dry |
|
B |
3.237-3.543 |
3.298 |
Dry | |
|
c |
3.244-3.890 |
3.384 |
Dry | |
|
D |
3.367-3.533 |
3.453 |
Dry | |
|
60 m |
A |
4.336-4.703 |
4.443 |
Dry |
|
B |
4.316-4.693 |
4.401 |
Dry | |
|
c |
4.316-4.982 |
4.477 |
Dry | |
|
D |
4.466-4.745 |
4.605 |
Dry | |
|
20 m |
A |
2.171-2.805 |
2.287 |
Rainy |
|
B |
2.197-5.766 |
3.136 |
Rainy | |
|
c |
2.171-4.420 |
2.677 |
Rainy | |
|
D |
2.184-2.334 |
2.258 |
Rainy | |
|
40 m |
A |
3.276-3.910 |
3.402 |
Rainy |
|
B |
3.322-6.884 |
4.405 |
Rainy | |
|
c |
3.270-5.532 |
3.780 |
Rainy | |
|
D |
3.296-3.471 |
3.406 |
Rainy | |
|
60 m |
A |
4.368-5.015 |
4.512 |
Rainy |
|
B |
4.440-7.995 |
5.544 |
Rainy | |
|
c |
4.362-6.630 |
4.888 |
Rainy | |
|
D |
4.433-4.583 |
4.498 |
Rainy | |
transport be accommodate all contains in the river into the sea during the rainy season. Human waste, waste from industry, waste from farming area and sediment from river flow to the sea and the concentration of TSM was increased.
The difference value ofHorizontal TSM concentration (dimensionless and timeless) during dry season and rainy season in Sumbawa Sea, at observed station the value TSM concentration value were very high. Generally, the value of TSM during rainy season was higher then dry season.
During in situ data that were observed 12 days, only 4 data's were available satellite data more clearly as shown in table 3. That satellite data are as following:
Figure 4 to 7 show the pattern of TSM concentration in Sumbawa Sea is very low along side the coastal (from 0.172 to 0.353 mg/I).
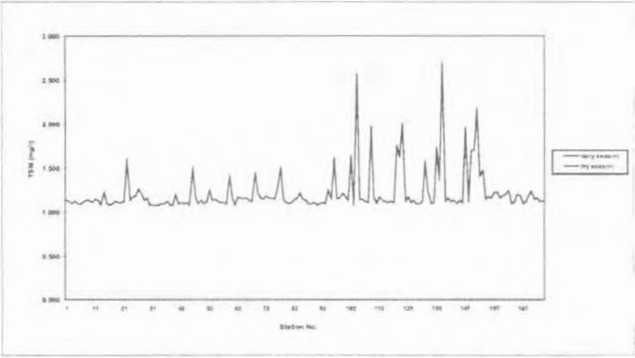
Figure 2. Horizontal TSM Concentrations during Dry Season and Rainy Season.
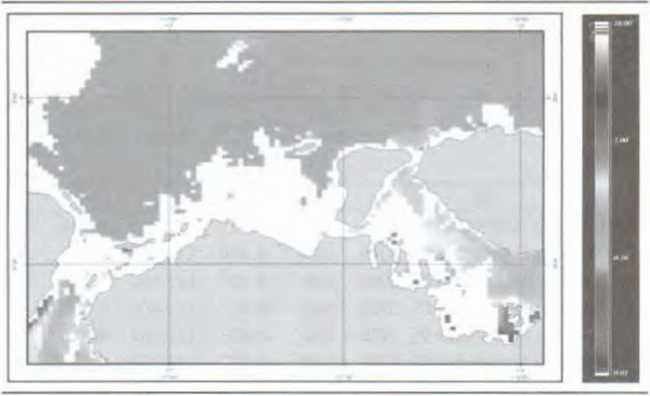
Figure 5. Pattern of TSM Concentrabon at September 7, 2005
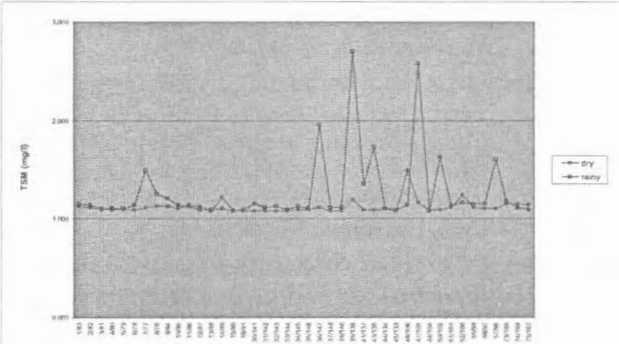
Figure 3. Horizontal TSM Concentration at same Station during Dry Season and Rainy Season
Table 2. The Range and Average of Integrated Horizontal Distribution of TSM
|
Depth |
Location |
Range |
Average |
Season |
|
0 m |
A |
1.079-1.222 |
1.117 |
Dry |
|
B |
1.079-1.196 |
1.099 |
Dry | |
|
C |
1.092-1.502 |
1.163 |
Dry | |
|
D |
1.144-1.157 |
1.153 |
Dry | |
|
0 m |
A |
1.079-1.502 |
1.153 |
Rainy |
|
B |
1.092-3.471 |
1.716 |
Rainy | |
|
C |
1.079-2.574 |
1.387 |
Rainy | |
|
D |
1.092-1.183 |
1.131 |
Rainy |
Table 3. List of No Cloud Satellite Data
|
No. |
Date |
Satellite Data |
|
1 |
Monday, September 05, 2005 |
ok |
|
2 |
Wednesday, September 07, 2005 |
ok |
|
3 |
Tuesday, November 15, 2005 |
ok |
|
4 |
Monday, April 24, 2006 |
ok |
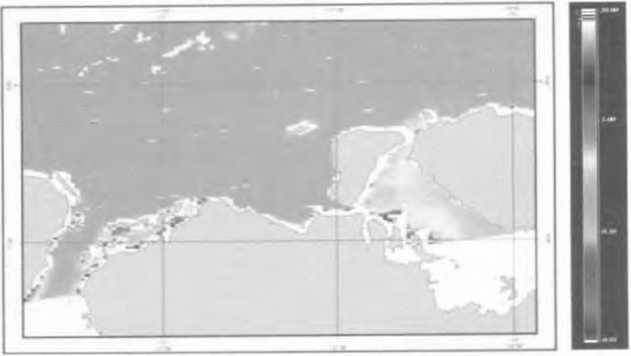
Figure 4. Pattern of TSM Concentration at September 5, 2005
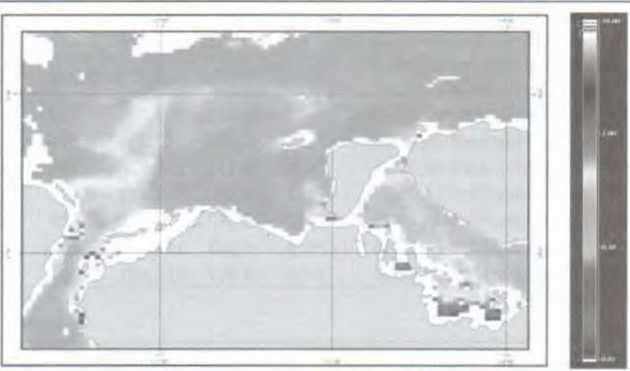
Figure 6. Pattern of TSM Concentrabon at November 15, 2005
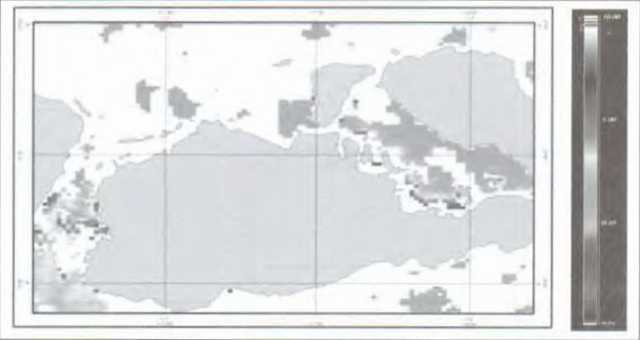
Figure 7. Pattern of TSM Concentrabon at April 24, 2006
Vertical Distribution of integrated TSM (in situ) in dry season and rainy season were very high concentration value in location B and C. In dry season, the location B is vary in range of 2.158 mg/1 until 4.693 mg/1 and the location C is vary in range of 2.171 mg/1 until 4.982 mg/1. In rainy season, the location B is vary in range of 2.197 mg/1 until 7.995 mg/1 and the location C is vary in range of 2.171 mg/1 until 6.630 mg/1.
During dry season, horizontal TSM concentrations is vary from 1.079 to 1.502 mg/1 while rainy season horizontal TSM concentration is vary from 1.079 to 3.471 mg/1. The variation of horizontal TSM concentrations indicated, surface TSM was significantly increased especially at the near river area.
Horizontal Distribution of TSM in dry season and rainy season showed very high concentration in location B and C. In dry season, the location B is vary in range of 1.079 mg/1 until 1.196 mg/1 and the location
Table 4. Comparison between In Situ TSM and Satellite Data in Dry Season and Rainy Season
Average of
|
Station No. |
Date |
Sta-tion_id |
Latitude |
Longti-tude |
TsM satellite |
Integrated TSM . . (until lOm de th |
ti. |
|
(1) |
(2) |
(3) |
(4) |
(S) . |
(6) |
(7) |
(7-6) |
|
3 |
Monday, September 05, 2005 |
503 |
-8.417 |
117.383 |
0.229 |
1.087 |
0.858 |
|
4 |
Monday, September 05, 2005 |
504 |
-8.400 |
117.383 |
0.216 |
1.110 |
0.894 |
|
5 |
Monday, September 05, 2005 |
sos |
-8.400 |
117.400 |
0.21 |
1.100 |
0.890 |
|
6 |
Monday, September 05, 2005 |
506 |
-8.417 |
117.400 |
0.225 |
1.085 |
0.860 |
|
9 |
Monday, September 05, 2005 |
509 |
-8.433 |
117.367 |
0.225 |
1.142 |
0.917 |
|
10 |
Monday, September OS, 2005 |
510 |
-8.417 |
117.367 |
0.224 |
1.112 |
0.888 |
|
11 |
Monday, September 05, 2005 |
511 |
-8.400 |
117.367 |
0.212 |
1.103 |
0.891 |
|
12 |
Monday, September 05, 2005 |
512 |
-8.383 |
117.367 |
0.217 |
1.093 |
0.876 |
|
13 |
Monday, September 05, 2005 |
513 |
-8.383 |
117.350 |
0.212 |
1.091 |
0.879 |
|
15 |
Monday, September OS, 2005 |
515 |
-8.417 |
117.350 |
0.223 |
1.090 |
0.867 |
|
42 |
Wednesday, September 07, 2005 |
713 |
-8.283 |
117.433 |
0.227 |
1.101 |
0.874 |
|
43 |
Wednesday, September 07, 2005 |
714 |
-8.267 |
117.433 |
0.218 |
l.098 |
O.BBO |
|
95 |
Tuesday, November 15, 2005 |
1504 |
-8.333 |
117.200 |
0.228 |
1.110 |
0.882 |
|
154 |
Monday, April 24, 2006 |
2406 |
-8.333 |
117.433 |
0.195 |
1.162 |
0.967 |
|
155 |
Monday, April 24, 2006 |
2407 |
-8.333 |
117.450 |
0.194 |
1.166 |
0.972 |
|
159 |
Monday, April 24, 2006 |
2411 |
-8.350 |
117.433 |
0.195 |
1.172 |
0.977 |
|
160 |
Monday, April 24, 2006 |
2412 |
-8.367 |
117.433 |
0.203 |
1.185 |
0.982 |
|
161 |
Monday, April 24, 2006 |
2413 |
-8.367 |
117.450 |
0.204 |
1.200 |
0.996 |
|
....::..::-=- |
---''-'=="-"'-'---"-'-=-"-'--- |
'---'-- |
--'-.c.c7---' |
1c;;c;- |
'--'-C- |
1.199 |
0_.9_98 |
Comparison between TSM in situ resulted from turbidity conversion and satellite data showed that there was over estimation with the average 0.913 mg/1 and low correlation coefficient r = -0.753.
REFERENCES
Anonymous, 2002, Bali - Lombok - Sumbawa - Komodo Islands - Flores. http://www.bali-indo. com/lombok/places.htm.
Estournel, C., Kondrachoff, V., Marsaleix, P., and Vehil, R., 1997, The Plume of the Rhone: Numerical Simulation and Remote Sensing, Continental ShelfResearch, 17 (8), 899-924.
Hoshika, A. and Tanimoto, T., 1997, Transport of Total Suspended Matter, Particulate Organic Carbon, Organic Nitrogen and Phosphorus in the Inner Part of Osaka Bay, Chugoku National Industrial Research Institute, 2-2-2 Hiro-Suehiro, Kure, Hiroshima 737-01,Japan.
Kirk,]. T. 0., 1994, L^lfiht and Photosynthesis in Aquatic Ecosystems, (2" ed.),. New York, NY7 Cambridge University Press, 509 pp.
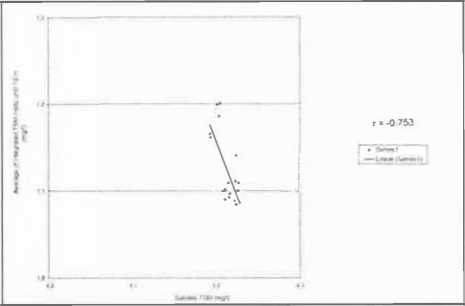
Figure 8. Correlation Between lnsitu TSM Horizontal Distribution and Satellite Data in Dry Season (5 and 7 Sept 2005) and Rainy Season (15 Nov 2005 and 24 Apr 2006).
C is vary in range of 1.092 mg/1 until 1.502 mg/1. In rainy season, the location B is vary in range of 1.092 mg/1 until 3.471 mg/1 and the location C is vary in range of 1.079 mg/1 until 2.574 mg/1.
Generally, the value of TSM during rainy season was higher concentration comparing to dry season. This high concentration of TSM during rainy season at study area indicated while the rains happen, the sediment flow from the river and entering the sea and increased TSM concentration.
Mobley, C. D., 1994, Light and Water: Radiative Transfer in Natural Waters, San Diego, CA7 Academic Press, Inc., 592pp.
Ouillon, S., Douillet, P., and Andrefouet, S., 2004, Coupling Satellite Data with In Situ Measurements and Numerical Modeling to Study Fine Suspended Sediment Transport: A Study for the Lagoon of New Caledonia, Coral Reefs, 23 (1), 109-122.
Ouillon, S., Douillet, P., Petrenko, A., Neveux, J., Dupouy, C., Froidefond,]. M., Andrefouet, S., and Caravaca, A. M., 2008, Optical Algorithms at Satellite Wavelengths for Total Suspended Matter in Tropical Coastal Waters, Sensors, 8, 4165-4185; DOI: 10.3390/s8074165.
Puls, W., Doerffer, R., Sundermann,J., 1994, Numerical Simulation and Satellite Observations of Suspended Matter in the North Sea, IEEE]. Ocean Eng. 19, 3-9.
Siegel, H., Gerth, M., Mutzke, A., 1999, Dynamics of the Oder River Plume in the Southern Baltic Sea: Satellite Data and Numerical Modelling, Continental Shelf Research, 19, 1143-1159.
Zhou, W., Wang, S., Zhou, Y., and Troy A., 2005, Mapping the Concentrations of Total Suspended Matter in Lake Taihu, China, using Landsat-5 TM data, InternationalJournal of Remote SensingVolume 27(6): 1177-1191.
CONCLUSION
Vertical distribution of TSM between rainy season and dry season show relatively stable and have same pattern, and TSM concentration be higher at depth O to 20 m during rainy season.
30
Discussion and feedback