MONTHLY VARIABILITY OF TOTAL SUSPENDED MATTER (TSM) MAPPING USING MODIS 250M TO SUPPORT MARINE CULTURE AT MOROTAI ISLAND, NORTH MALUKU
on
ECOTROPHIC • 6 (1): 21 · 25
ISSN : 1907-5626
MONTHLY VARIABILITY OF TOTAL SUSPENDED MATTER (TSM) MAPPING USING MODIS 250M TO SUPPORT MARINE CULTURE AT MOROTAI ISLAND, NORTH MALUKU
Komang Iwan Suniada
Institute for Manne Research and Observation Br. Dangin Berawah, Ds. Perancak, Jembrana Bali 82251 Telp (0365) 44266, Fax (0365) 44270 komangprtk@yahoo.com
ABSTRACT
This study was conducted to provide an information of TotalSuspended Matter concentration and its monthly variability using dialy data of Terra/Aqua MODIS level 1b with spatial resolution 250m imagery at Morotai Island, Northern Maluku. TSM is one of the water quality key parameter to support finding suitable area which is an important step for marine culture activity.
Dialy Aqua/Terra MODIS level lb, 250m dataset was downloaded freely from Goddard Space Flight Center, LAADS Web (http://ladsweb.nascom.nasa.gov/) and its contains information of calibrated radiance dan reflectance. TSM concentration derived using algorithm proposed by Trisakti et al, TSM (mg/I) = 72743 (bl+b2)2·3551, where bl is remote sensing reflectance band 1 and b2 is remote sensing reflectance band 2. Further process is daily TSM data composited to produce monthly data to define the variability. GIS application technique based on apropriate environment condition for fish comodity are used to mapping suitable area concerning of TSM parameter.
Suspended sediment concentrations derived from satellite data showed that the average range of 40-90 mg/I, with the highest suspended sediment concentration occurred in January and lowest in June
Keyword : TSM, remote sensing, marine aquaculture
INTRODUCTION
The potential of fisheries in the territorial waters of Indonesia both capture fisheries and aquaculture of course is very large since Indonesia archipelago is very extensive. At themoment the result offishing activities began to be felt down, then began to be encouraged aquaculture activities. Determining the exact location of cultivation is one important factor for the success of aquaculture activities. Important water parameters that must be considered among others are topographic location, the physical parameters of water, chemical parameters and biological parameters. Topographic location covers site selection based on the area protected from wind and big waves and the appropriate water depth. Physical parameters such as currents, temperature, turbidity. Biological factors such as, the number of organisms that grow in the region so as to reduce the cultivation of dissolved oxygen and also the number of harmful phytoplankton that can cause death, whereas chemical factors such as dissolved oxygen, pH, salinity. In addition to water parameters, other factors are influential enough to determine the location of cultivation is easy access to transportation (land, sea, air) to the place of doing the activity.
Currently the utilization of satellite remote sensing data has been reached in various fields, such as to aid mapping and spatial regions, to determine the density
or extent of land cover, to estimate the location or the area fishing ground, to determine the distribution patterns ofSST, surface chlorophyll-a distribution pattern and so forth. From the several factors to consider in determining the location of such cultivation, one of the parameters that can be observed by using satellite remote sensing data is the physical parameters of waters such as the sea surface temperature and turbidity. Utilization of remote sensing satellite data of the satellite Terra I Aqua MODIS using infrared bands (bands 31 and 32) can be used to detect sea surface temperature, while the band 1 (wavelength 620-670 nm) and band 2 (841-867 nm) can be used to detect concentration of total suspended matter (Miller & McKee, 2004; Kutser et al, 2007; Trisakti et all) which are intimately associated with water turbidity parameters.
Analysis of the data used to determine a suitable site for marine aquaculture using Geographic Information System application has been used widely in the world such as for shellfish aquaculture in Baynes Sound, Canada (Carswell et al, 2006), site selecton for mangrove oyster raft in Margarita Island, Venezuela (Buitrago et al, 2005), modeling of environmental parameters for marine aquaculture in Sinola State, Mexico (Aguilar-Manjarez and Ross, 1995), site selection in the Canary Islands, Tenerife (Perez et al, 2002), suitable sites for Japanese scallops in Funka Bay, Hokkaido (Radiarta et al, 2008) and the site selection of marine culture in
the Gulf of Tomini (Utojo et al, 2007).
The purpose of this activity is to determine the monthly variability TSM parameters and find a suitable site for marine aquaculture activities based on the parameters of TSM using GIS technique.
RESEARCH METHODOLOGY
The study was conducted in the territorial waters of Morotai Island District 128.1° - 128.79° E and 1.84° - 2.72° N (Figure 1), because the island of Morotai will be developed into regional Minapolitan region in east Indonesia, and of course to support this poli^ required the study of regional suitable for marine aquaculture.

Figure 1. Research Sites on Morotai Island County
Flowchart of this study is shown in fi^re 2 below:
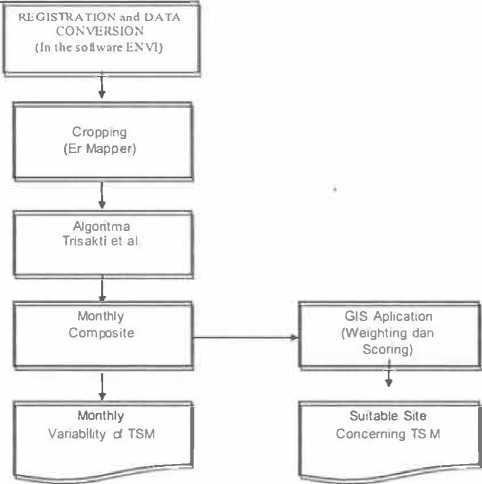
Figure 2. Research Flowchart of this study
Satellite data used to calculate the suspended sediment concentration is the daily satellite data Terra /
Aqua MODIS band 1 and band 2 with a spatial resolution of 250 meters. Such data can be obtained free of charge via the website's Goddard Space Flight Center with http://ladsweb.nascom.nasa.gov/data/ address.
The distribution of suspended sediment concentrations obtained by using the algorithm generated by Trisakti et al. TSM (mg / 1) = 72743 (bl + b2)2∙3551, where b1 is remote sensing reflectance band 1 and b2 is remote sensing reflectance band 2. Daily data are then combined to produce monthly distribution of suspended sediment, so that known monthly variability associated with seasonal changes that occur in the study area. Determining the location of marine aquaculture in the area of Morotai Island District obtained by making use of satellite remote sensing data, namely to know the surface temperature (SST) and the concentration of suspended load (TSM) and utilize water depth data (bath^etry). Perez et al. (2002) states that the temperature and the suspended solid content is an important factor to determine a suitable site for aquaculture activities.
To determine the location of the sesusai for marine aquaculture activities using spatial analysis and geographic information systems, it must refer to the criteria of environmental conditions suitable for life in the commodities to be cultivated. Such criteria will be used as a basis for assessing and weighting the results of spatial analysis in order to obtain the most suitable for aquaculture activities (table 1).
Table 1. TSM Compliance Criteria for Marine Aquaculture activities
|
Parameter |
very suitable |
suitable |
less appropriate |
not suitable |
|
kriteria |
kriteria |
kriteria |
kriteria | |
|
TSM (mg/I) |
0-20 |
20-80 |
80 • 400 |
>400 |
Source : Sulma et al (2008), Utojo et al (2007) Modified
RESULT AND DISCUSSION
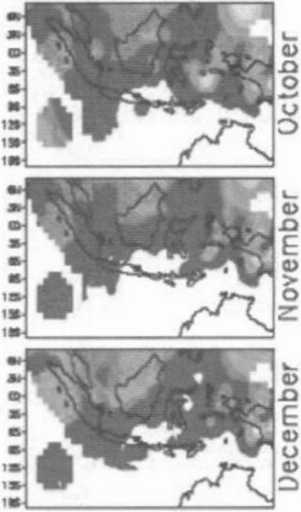
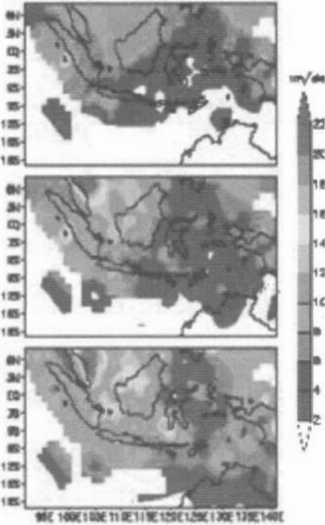
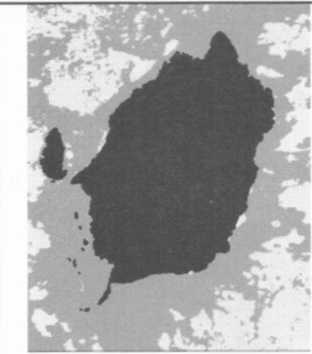
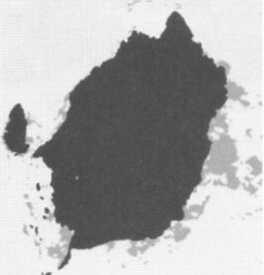
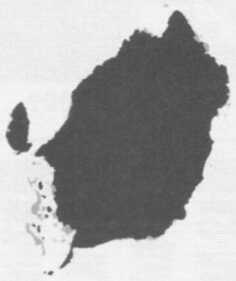
Data used for this study is the daily data in 2009. 47 data used completely cloud-free or partially cloud-free. Satellite image data already downloaded and then processed further to produce information on TSM. Monthly average concentration of suspended sediment distribution in the waters of Morotai Island District in 2009 can be seen in fi^re 3.
Based on Figure 3 above, shows that the suspended sediment concentration tends to be higher in the western waters, when compared on the east or north, but the concentration is still in the range of mariculture activities tolerantions. Figure 4 below shows the average monthly suspended sediment concentration based on satellite data, suspended sediment concentration values ranging from below 90 mg/1 with the lowest occurred in June and the highest average occurs in January.

May 2009

September 2009
June 2009

October 2009


November 2009


Figure 3. Monthly Average Concentration Distribution TSM

buIan
Figure 4. Monthly Average Concentrations of TSM 2009
dry season (Figure 5). There are indications of high sediment in January and the low sediment in June was influenced by seasonal changes that occur. Higher rainfall would cause sediment to flow towards the sea. Similarly expressed by Budhiman et al (2004) which states that the effect of rainfall on the mainland will cause the flow of sediment through the river to the sea higher than when there is no rain. The high concentration of suspended sediment in the water usually caused by the flow of sediment from the river, or due to the influence of tides, currents and waves that cause the movement of sediment in the bottom waters
Generally in Indonesia in December, January, February is the rainy season and inJuly, July August is the


Figure 5. Average Rainfall Indonesia (source: Dr. Edwin Aldrian, personal approach)
January 2009
May 2009


February 2009
June 2009


Figure 6. Aquatic Areas Suitability for Cultivation Based TSM Parameters
Dahuri (2003) states that some activities on land such as logging, clearing roads and the opening of agricultural land that is not accompanied by terraces can lead to increased content of sediment in runoff (surface run-off). Sediment will enter the river and will lead to coastal and marine areas that may be the distance can be hundreds to thousands of kilometers from the headwaters. Suspended sediment will be able to cause negative impacts on coastal and marine biota, such as biota that live in bottom waters (benthic), corals, seagrass and seaweed because it can interfere their respiratory system, it would also prevents penetration of sunlight and can interfere with the process photosynthesis.
To determine suitability of marine aquaculture activities against TSM parameters, then the next process is carried out re-classified based on predetermined criteria.. If the suspended sediment concentration between 0-20 mg/I means that the location is very suitable for marine aquaculture activities (green), if the suspended sediment concentration of 20-80 mg/I means appropriate to the location of culture (yellow color), if the concentration of its TSM between 80-400 mg/I is less suitable for farming area (orange color) and when the suspended sediment concentration over 400 mg/I means that the area is not suitable for marine aquaculture activities (red color). The result of the reclassification of TSM parameters of every month can be seen in Figure 6.
In general, based on the parameters of TSM, the areas suitable for aquaculture activities is very wide in the open sea area with a great distance from the mainland and the waters are quite deep. Bathymetry data need to be added as a limiting factor because of the depth of water is one important factor for the selection of a suitable site for marine aquaculture. In February and June are the months with the most minimum TSM distribution compared with other months. Months with a minimum TSM distribution is an appropriate time for marine aquaculture activities as they relate to water quality. This information is expected to be used as one consideration in selecting an appropriate time and also location for mariculture activities.
CONCLUSSION
From the previous description can be concluded that suspended sediment concentrations derived from satellite data showed that the average range of 40-90 mg/I, with the highest suspended sediment concentration occurred in January and lowest inJune. TSM distribution mapping using satellite imagery data aqua I terra modis 250m can be used to support marine aquaculture activities, especially related to water quality. Monitoring and mapping the variability of monthly TSM can also be used as a reference for the appropriate tirning and selection of a suitable site for marine aquaculture.
REFERENCES
Aguilar-Manjarrez,]., L. G. Ross. 1995. Geographical Information System (GIS) environmental Model for Aquaculture development in Sinaloa State, Mexico. Chapman and Hall. P 103-115
Budhiman, S., T. Hobma and Z. Vederky. (2004). Remote Sensing for Mapping TSM concentration in Mahakam Delta : an Analytical Approach. Proceeding : The thirteen Workshop of OMISAR on the Application and Networking of Satellite Data. OMISAR Project Publication. 5.l-5.14 p
Buitrago J., M. Rada, H. Hernandez, E. Buitrago. 2005. A Single-use site selection technique, using GIS, for aquaculture planning: Choosing location for mangrove oyster raft culture in margarita island, venezuela. Springer Science. P 544-556
Carswell B., S. Cheesman, J. Anderson. 2005. The Use of Spatial analysis for environmental assessment of sellfish aquaculture inBaynessSound, VancouverIsland,British Columbia, Canada. Elsevier. P 408-414
Dahuri, R. 2003. Keanekaragaman Hayati Laut. Gramedia Pustaka Umum.Jakarta. Hal 223-225
Kutser, T., L. Metsamaa, E. Vahtmae and R. Aps. 2007. Operative Monitoring of the Extent of Dredging Plumes in Coastal Ecosystem Using MODIS Satellite Imagery. Journal of Coastal Research. l 80-l 84p
Miller, R.L and B.AMcKee. 2004. Using MODIS Terra 250 m Imagery to Map Concentration ofTotal Suspended Matter in Coastal Waters. Remote Sensing of Environment. Elsevier Inc. P 259-266.
Perez, O.M., L.G Ross, T.C. Telfer, L.M del Campo Barquin. 2002. Water Quality requirement for marine fish cage site selection in Tenerife (Canary Island): predictive modelling and analysis using GIS. Elsevier. P 51 -68
Radiarta, IN., S. Saitoh, A. Miyazono. 2008. GIS-based Multicriteria evaluation models for identifying suitable site for Japanesse scallop (Mizuhupecten yessoensis) aquaculture in Funka Bay, southwestern Hokkaido, Japan. Elsevier. P 127-135
Trisakti, B., Parwati and Syarif Budhiman. The Study of MODIS-AQUA Data for Mapping Total Suspended Matter (TSM) in Coastal WatersUsing theApproach of Landsat-7 ETM Data. LAPAN.
Utojo, A. Mansyur, A. M. Tangko, Hasnawi, T. Mulia. 2007. Pemilihan Lokasi Budidaya lkan, Rumput Laut clan Kerang Mutiara yang ramah lingkungan di teluk Tomini, Sulawesi Tengah. Pengembangan Teknologi Budidaya Perikanan, BBRPBL. Hal 200-210
25
Discussion and feedback