Marketing Channels Efficiency Analysis of Scad (Decapterus sp.) Catches of Traditional Fishermen in Pengambengan Village Jembrana, Bali
on
Advances in Tropical Biodiversity and Environmental Sciences 5(1): 34-39, February 2021 e-ISSN:2622-0628
DOI: 10.24843/ATBES.v05.i01.p06 Available online at: https://ojs.unud.ac.id/index.php/ATBES/article/view/68871
34
Marketing Channels Efficiency Analysis of Scad (Decapterus sp.) Catches of Traditional Fishermen in Pengambengan Village Jembrana, Bali
Dita Dwi Ayu Isukadana1*, I Wayan Restu2, and I Ketut Wija Negara3
123Department of Aquatic Resources Management, Faculty of Marine and Fisheries, Udayana University Jl. Kampus Unud Bukit Jimbaran, Kuta Selatan, Badung, Bali
*Corresponding author: ayuditadwi1230@gmail.com
Abstract: Efficient marketing is characterized by low marketing margins and high farmer's share. This research was conducted to determine the condition and level of efficiency marketing channels Scad in Pengambengan Village during February-March 2020. The method used was descriptive qualitative method and quantitative descriptive by observation and interviews. Interviews were conducted with fishermen, collectors, wholesalers and retailers. The Marketing margin analysis and farmer's share were used to determine level of efficiency marketing channel. The results of the analysis show that there were two patterns of marketing channels for Scadthat were caught by traditional fishermen in Pengambengan Village. Marketing channel pattern I was a two-level channel pattern, while marketing channel pattern II was a three-level channel pattern. The marketing margin value in the two-level channel pattern was Rp5.700/kg with a farmer's share of 71%. The marketing margin value in the three-level channel pattern was Rp9.700/kg with a farmer's share of 59%. The marketing efficiency value obtained in two-level marketing channel pattern was 6%, while in three-level channel marketing pattern the marketing efficiency value was 8%. Based on the values obtained, the marketing efficiency of two-level channel pattern was as efficient as the three-level channel pattern. Thus, the marketing of Scad that were caught by traditional fishermen in Pengambengan Village was classified as efficient marketing.
Keywords: efficiency; marketing; pengambengan; scad
-
I. INTRODUCTION
Indonesia's fishery potential as an archipelago with a very wide maritime zone is 23.18 million tons. The total production is obtained from aquaculture and capture fisheries products. Capture fisheries production is 7.07 million tons, with the main commodities being Skipjack (Katsuwonus pelamis), Tuna (Thunnus sp.), Mackerel Tuna (Euthynnus sp.), and Scad (Decapterus sp.) [1].
Scad is one of the main capture fisheries commodities in Indonesia which has high economic value, where it is spread throughout Indonesian waters including the marine waters in Bali.One of the areas in Bali that has abundant fish production is West Bali, Pengambengan Village.This village is one of the potential areas for capture fisheries business development, supported by the existence of the Pengambengan Nusantara Fishing Port (NFP).The volume fishery production of Scad in Bali is 5.8 thousand tons, and it had been distributed from local to inter-island [1].
Based on the preliminary survey, the Scad landed by traditional fishermen at Pengambengan is distributed through marketing agencies to reach consumers.Marketing Scad with several marketing agencies will help
Pengambengan fishermen, because the fish that are not directly marketed will be damaged.This can lead to a decrease in the price and quality of the catch. It is assumed that the fish marketing process through many hands or marketing agencies will be inefficient [2]. Fish marketing activities have become inefficient due to the existence of some marketing agencies that try to take profits disproportionately and incur marketing costs inefficiently [3].
Efficient Scad marketing will benefit all parties or marketing agencies involved in it.A marketing activity can be said to be efficient if the difference between the price of fish in fishermen and the price of fish in consumers is not too big. This is supported by the large share and influence of fishermen in pricing [4]. For this reason, it is necessary to know the marketing efficiency of the Scad in Pengambengan Village.
-
II. METHODS
This research was conducted for two months, in February-March 2020 in Pengambengan Village, Jembrana, Bali.The research method used was descriptive
qualitative and quantitative methods by means of observation and interviews.Respondents in this research were traditional fiber fishermen (gillnet fishing gear) and marketing agents (collectors, wholesalers and retailers).Determination of research respondents using the sampling technique based on the following Yount [5].
Based on the Yount table, the number of respondents in this research was 10% of the total population. The total population in this research was 525, so that 10% of the respondent population was 52 consisting of 30 fishermen and 22 marketing agencies.
Data Analysis
-
a. Marketing Channel Analysis
This analysis was conducted to identify existing marketing channels, to determine the process of distributing fish from fishermen to consumers.
-
b. Marketing Efficiency Analysis
Marketing margin was the price difference between the selling price and the purchase price of Scad at each marketing agency involved [6]. Marketing margin can be calculated using the following formula [7]:
MP = Pr- Pf
Noted: MP is the marketing margin (IDR/kg); Pr is the price of fish at the consumer level (IDR/kg) and Pf is the price of fish at the fishermen level (IDR/kg).
Analysis of farmer's share was useful for knowing the share of the price received by fishermen from the price at the consumer level which was expressed as a percentage [8]. To calculate the farmer's share, use the following formula [9]:
FS = pf × 100% Pr
Noted: Fs is farmer's share (%); Pf is the price of fish at the fishermen level (IDR / kg) and Pr is the price of fish at the consumer level (IDR / kg).
The criteria for making decisions on the efficiency of marketing channels, namely if the EP ranges from 0-33% then the marketing channels are efficient, if the EP ranges from 34-67% then the marketing channels are less efficient, and if the EP ranges from 68-100% then the marketing channels are inefficient using the formula as follows [9]:
EP = ^ × 100 % Np
Noted: EP represents marketing efficiency (%); Bp is the total marketing cost (IDR / kg) and Np is the value of the product marketed (IDR / kg).
-
III. RESULTS AND DISCUSSION
Catching
The catch of Scad in Pengambengan was carried out at night and will return to sea in the morning, because the fishermen in Pengambengan Village were catching one day fishing.In the catch of Scad, traditional fishermen in Pengambengan Village used fiber boats with outboard engines. The size of the fiber boat used is 10.5 × 1.2 × 1 (PxLxD) meters and gillnet with a mesh size of 1.9 cm as fishing gear.
Fishermen made preparations before fishing in the afternoon at 16.00 WITA. Preparations made such as preparing diesel fuel, nets, ice and special necessities required during fishing operations.After the preparations were complete, the fleet was ready to go to the fishing location. Then, the nets were spread in the upright position of the waters and block the currents.The nets that have been spread are left for ± 3 hours, then the nets are removed. Fish trapped in the net will be transferred to the boat's hold, where the hatch is also filled with ice to keep the catch fresh. After the sun began to rise, the fishermen returned and marketed their catch.
Marketing
Marketing of Scad caught by traditional fishermen in Pengambengan Village was indirect marketing, because in the distribution of fish to the consumers there were interference from marketing agencies such as collectors and retailers.Most of the traditional fishermen in Pengambengan Village had regular subscriptions to collecting traders when the catch was ready to be marketed. This could help fishermen in catching the Flying Fish.
The scad that had been landed will be moved using a basket measuring ± 50 kg. The transfer of Scad was assisted by shoulder workers with a wage of IDR 20,000 / basket.The baskets containing the fish were moved to the weighing location and sale and purchase transactions were carried out by collecting traders and fishermen at the agreed price. Then, wholesalers and retailers go directly to collectors to make buying and selling fish.The scads purchased from these collectors were distributed to consumers around Pengambengan Village by retailers. Meanwhile, wholesalers distribute Layang Fish to regular retailers located outside Pengambengan Village.
Marketing Channel
The condition of the marketing channel for Scad that was caught by traditional fishermen in Pengambengan Village consists of two marketing channel patterns. The marketing channel for flying fish in Pengambengan village can be seen below:
1st Marketing Channel
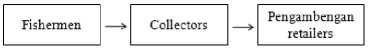
2nd Marketing Channel

Scad production from February to March traditional fishermen in Pengambengan Village got an average catch of 51 kg in one fishing trip.The selling value of Scad by fishermen ranges from IDR 12,000-15,000 / kg, with an average selling value of IDR 14,000 / kg.The operational costs incurred by fishermen during one fishing trip were IDR 6,554 / kg, the value of operational costs was obtained from the total operating costs divided by the volume of the catch. The operational costs were the costs needed by fishermen to catch fish, ranging from fuel to wages for shoulder labor and boat drains.The costs spent by fishermen for fuel were around IDR 150,000-200,000, for other necessities such as ice cubes and consumption around IDR 50,000-100,000. Shoulder labor were given a wage of IDR 20,000 / basket, while boat drained workers were given a wage of 10% of their catch after deducting the costs of fuel, consumption, ice cubes and shoulder labor.
The fish collectors traders in Pengambengan Village had an average age of 53 years with 21 years of experience as a trader.During the February-March catch, the collector traders purchase 1000-3000 kg of fly fish with an average price of IDR 14,000 / kg. Marketing costs incurred by collectors were IDR 123 / kg, marketing costs were obtained from the total marketing costs in the form of costs for fish storage ice, this cost was around IDR 240,000360,000 divided by the volume of fish purchases. Collecting traders did not incur labor costs, because those that incur marketing costs were from fishermen and buyers.Collector traders sold Scad with a price range of IDR 15,000-17,000 / kg. Scad was distributed to consumers in the Pengambengan Village area and outside the Pengambengan area through other marketing agencies. Collector traders market Scad to wholesalers and retailers in the Pengambengan area. However, collecting traders would distribute to the fishery factories in the PPN Pengambengan area if the fish purchased was abundant and the buyers did not match the price and the fish.
The big fish traders in Pengambengan Village had an average age of 42 years with 15 years of experience as a wholesaler.Wholesalers purchase Scad with collectors to be distributed outside the Pengambengan area. During the February-March catch, the wholesaler bought 1000-2000 kg of fly fish, with an average purchase price of IDR 16,000 / kg.Marketing costs incurred by wholesaler were IDR 705 / kg. These costs were incurred by large traders
for fuel, labor, ice cubes and others. Wholesalers spent IDR 200,000-250,000 for transportation fuel, IDR 400,000-800,000 for labor, and IDR 150,000-360,000 for ice cubes and others. Wholesalers distributed fly fish outside the Pengambengan Village area, with a selling price of IDR 18,000-20,000 / kg. Scad was marketed outside the Pengambengan Village area such as in the Jembrana Regency to Singaraja areas. Wholesalers would also send Layang Fish to Java Island when fishing was abundant.
Fish retailers in Pengambengan Village bought fish directly from collectors at Pengambengan NFP. The retailers had an average age of 45 years with 12 years of experience as a retailer. The total volume of fish purchased by retailers was 20-50 kg in one day.Retailers boughtScad with a price range of IDR 15,000-18,000 / kg and will be sold at an average price of IDR 20,000 / kg. Marketing costs incurred by retailers were IDR 1,001 / kg, consisting of fuel, ice and other necessities.Fuel costs range from IDR 10,000-25,000, while costs for ice and other necessities range from IDR 10,000-12,000 in one day of buying Scad. Pengambengan retailers distributedScad to consumers around Pengambengan Village by using motorbikes to go around. However, there were other retailers who distribute Layang Fish by opening shop houses at their homes.
Retailers outside Pengambengan Village purchase Scad from large traders. The average age of an outside Pengambengan retailer was 41 years with 10 years of retail experience. The total volume of fish purchased by outside retailers ranges from 20-30 kg at a price of IDR 18,00020,000 / kg.The marketing costs incurred by retailers outside Pengambengan Village are IDR 992 / kg. The marketing costs consist of the cost of fuel, ice and others. The cost of fuel incurred was around Rp. 10,000-15,000 and the cost of ice and others was Rp. 10,000. Retailers outside Pengambengan Village market the Scad around Jembrana, such as the Negara General Market at a selling price of IDR 23,000-25,000 / kg.
There were 4 distribution channel patterns, namely the zero-level channel pattern to the three-level channel pattern [10].The marketing channel pattern I of Scad in Pengambengan Village was classified as a two-level channel, while the marketing channel pattern II was classified as a three-level channel.Every Scad marketing agency took advantage of its distribution business, because besides the business it also incurs marketing costs.This statement was also reported by Ningsih et al [11], that intermediary traders (marketing agencies) incur costs for product marketing activities to consumers, the costs incurred by each intermediary were also different. Jumiati et al [8] stated that the high marketing costs incurred led to low profits.In contrast to the above statement, the Scad three-tiered marketing channel pattern in Pengambengan
Village had a higher advantage with higher marketing costs than the two-tier marketing channel pattern.
The two-level marketing channel pattern was a marketing channel in which there were 2 marketing institutions (collecting traders and retailers) that distribute Scad from fishermen to consumers. Marketing of Scad in Pengambengan Village had a two-level marketing channel pattern when the fishermen's production was not high, this was different from the research results of Saputra et al [12], a two-level marketing channel pattern was formed because of the large amount of production produced by producers. Scad were distributed by fishermen to collecting traders because collecting traders can bougth catches and can also provide initial capital, this was the same as Nuriati's research [13] that the distribution of fish from fishermen to collecting traders was due to cooperation between fishermen and collecting traders in terms of capital.
The three-level marketing channel pattern was a marketing channel pattern with 3 marketing agencies (collectors, wholesalers, and retailers) distributing Scad to consumers. The marketing of Scad in Pengambengan Village was based on a three-level marketing channel pattern, where fishermen and collectors sold fish at the same price and marketing costs as the two-level marketing channel pattern.Most of the price formation at the Scad marketing institutions was a bargaining process with a payment system made in cash, this was in line with the results of research by Pradika et al [14] where a price can be formed through a bargaining process. During the research, the price of Scad in Pengambengan village was classified as high because the production of fly fish was low. As with the research results of Damayanti et al [15], states that the ups and downs of production can affect the decline and increase in fish prices.
Efficiency of Marketing Channel
Efficient marketing would benefit all parties in the marketing chain. The beneficiaries were fishermen, traders to consumers. The efficiency of a marketing was characterized by the value of low marketing margins, low marketing costs, and the profit taking of each institution is not high [3]. Based on the research of Giamurti [4], there were several marketing aspects that need to be known to indicate the efficiency of a marketing. These aspects include marketing margin, farmer share, and marketing efficiency. The value and total farmer share, marketing costs, profits, marketing margin, and marketing efficiency can be seen in Table II.
The second size of the total marketing margin for Scad in Pengambengan Village shew the difference in prices that occur at the fishermen level and the prices for Scad at the consumer level. According to Pay and Nubatonis [16], marketing margin was not only the difference between the
consumer's purchase price and the producer selling price but was the sum of the margins of each marketing agency concerned. Thus, the longer a marketing channel can led to an increase in the value of the marketing margin.
TABLE II
Farmer's Share, Costs, Profits, Margins, and Efficiency of Scad Marketing in Marketing Channels I and II
|
Markerters |
Channel I |
Channel II |
|
(IDR/Kg) |
(IDR/Kg) | |
|
Fishermen | ||
|
Selling Price |
14.000 |
14.000 |
|
OperatingCosts |
6.554 |
6.554 |
|
Provit |
7.446 |
7.446 |
|
Collectors | ||
|
Purchase Price |
14.000 |
14.000 |
|
Marketing Costs |
123 |
123 |
|
Selling Price |
16.000 |
16.000 |
|
Marketing Margin |
2.000 |
2.000 |
|
Profit |
1.877 |
1.877 |
|
Wholesalers | ||
|
Purchase Price |
- |
16.000 |
|
Marketing Costs |
- |
705 |
|
Selling Price |
- |
18.500 |
|
Marketing Margin |
- |
2.500 |
|
Profit |
- |
1.795 |
|
Pengambengan Retailers | ||
|
Purchase Price |
16.000 |
- |
|
Marketing Costs |
1.001 |
- |
|
Selling Price |
19.700 |
- |
|
Marketing Margin |
3.700 |
- |
|
Profit |
2.699 |
- |
|
Outside Pengambengan Retailers |
- | |
|
Purchase Price |
- |
18.500 |
|
Marketing Costs |
- |
992 |
|
Selling Price |
- |
23.700 |
|
Marketing Margin |
- |
5.200 |
|
Profit |
- |
4.208 |
|
Consumer Purchase Price |
19.700 |
23.700 |
|
Total Marketing Costs |
1.124 |
1.820 |
|
Total Marketing Margin |
5.700 |
9.700 |
|
Total Profit |
4.576 |
7.880 |
|
Farmer's Share (%) |
71 |
59 |
|
Marketing Margin (%) |
29 |
41 |
|
Efficiency of Marketing (%) |
6 |
8 |
A marketing margin exists because every distribution into the hands of consumers each institution took advantage. In the research of Febrianti et al [17] their marketing channel pattern had a low marketing margin because in taking profits, marketing agencies only took a
little profit.Whereas in the research of Maisyaroh and Boesono [18] the high marketing margin was due to the large profits taken by the marketing agency. Both the results of these research indicate that the amount of profit can affect the level of a marketing margin, but it was supported by the amount of marketing costs incurred. According Pamuji et al [19], the amount of marketing margin was determined by the amount of marketing costs that occur with the amount of profit in each marketing agency involved in marketing activities. This proves that the total marketing margin for Scad in Pengambengan Village was generated from the marketing costs incurred and the profits taken by the marketing agency.
In the three-level marketing channel pattern, there was a bigger marketing margin due to the longer marketing chain that was formed. This was in accordance with the research results of Jumiati et al [8], where a longer marketing channel had a larger marketing margin.Apart from the longer chain of marketing, outside retailers take higher profits than other marketing agencies. This was the same as the results of research conducted by Giamurti et al [4], stated that the higher the profit taking at the marketing agency, the higher value of the marketing margin.
A marketing channel was said to be efficient if the share received by fishermen (farmer's share) is higher than the value of the marketing margin. Elpawati et al [20] stated that farmer's share had a negative relationship with marketing margins where the higher marketing margin, the lower fishermen's share was.In this research, the channel I (two-level) and channel II (three-level) patterns were classified as efficient marketing channels based on the comparison between the farmer's share and the marketing margin. The percentage of farmer 'share and marketing margin in channel I pattern was 71% and 29%, while in channel II pattern was 59% and 41%.The results of this research were directly proportional to the research of Apriono et al [21], namely the share obtained by producers was higher than the marketing margin, so that the marketing chain was classified as efficient.
The efficiency of the Scad marketing channel in Pengambengan Village was classified as efficient. The two-level channel pattern had an efficiency value of 6%, while in the three-level channel pattern it was 8%.The efficiency results in the two marketing channel patterns were obtained from dividing the total marketing costs by the value of the product marketed or the price paid by the end consumer.The two patterns of marketing channels indicate an efficient marketing, with the criteria for marketing efficiency values ranging from 0-33%, the marketing channel was efficient, if the efficient value ranges from 34-67%, the marketing channel was less efficient and if the value was 68-100% efficient, the marketing channel was not efficient [9]. These results were
the same as the results of the comparison between marketing margin and farmer's share, where the two marketing channels of Scad in Pengambengan Village were efficient marketing.
-
IV. CONCLUSION
Marketing of Scad in Pengambengan Village had 2 marketing channel patterns, namely a two-level marketing channel pattern: fisherman-collector-retailer-consumer and a three-level marketing channel pattern: fisherman-collector-wholesaler-retailer-consumer.This means that the marketing of Scad in Pengambengan Village was indirect marketing, where the collecting traders to the retailers who distribute the Scad to consumers. The efficiency level of the Scad marketing channel in Pengambengan Village was classified as efficient marketing. The two marketing channel patterns had a higher farmer's share value than the marketing margin, the two-level channel pattern had an efficiency value of 6% and a three-level channel pattern efficiency value of 8%.
ACKNOWLEDGEMENTS
We would like to thank Mr. Ageng at Pengambengan NFP who had helped and accompanied the data during the research, as well as all parties involved in this research activity.
REFERENCES
-
[1] [KKP] Kementerian Kelautan dan Perikanan (Satu Data). 2018. Outline Tabel Kelautan dan Perikanan dalam Angka.Jakarta: Satu Data KKP.
-
[2] Huda, M., I Solihin, E Lubis. 2015. Tingkat Efisien Pemasaran Ikan Laut Segar Di Pelabuhan Perikanan Nusantara Brondong. Jurnal Teknologi Perikanan dan Kelautan, 6(1), 91-104.
-
[3] Abidin, Z., W Handayani, M Fattah. 2016. Analysis of Masamo Catfish Marketing by Analytical
Approach at Farmer Group “Sumber Lancar”,
Blimbing, Malang City. Economic and Social of Fisheries and Marine Journal, 4(01): 90-104.
-
[4] Giamurti, ASR., AN Bambang, AD Fitri. 2015. Analisis Pemasaran Hasil Tangkapan Kakap Merah (Lutjanus sp.) di Pelabuhan Perikanan Nusantara Brondong, Lamongan, Jawa Timur. Journal of Fisheries Resources Utilization Management and Technology, 4(4), 8-17.
-
[5] Yount. 1999. Jumlah Populasi Kurang Dari 100 Lebih Baik Diambil Sebagai Sampel Penelitian Populasi. Jakarta: Bina Aksara.
-
[6] Arbi, M., T Thirtawati, Y Junaidi. 2018. Analisis Saluran dan Tingkat Efisiensi Pemasaran Beras Semi Organik Di Kecamatan Rambutan Kabupaten
Banyuasin. JSEP (Journal of Social and Agricultural Economics), 11(1), 22-32.
-
[7] Hanafie, R. 2010. Pengantar Ekonomi Pertanian. Yogyakarta: Andi Offset. 308 hlm.
-
[8] Jumiati, E., DH Darwanto, S Hartono, Masyhuri. 2013. Analisis Saluran Pemasaran Dan Marjin Pemasaran Kelapa Dalam di Daerah Perbatasan Kalimantan Timur. J. Agrifor, 12(1), 1-10.
-
[9] Soekartawi, DR. 2002. Prinsip Dasar Manajemen Pemasaran Hasil-hasil Pertanian. Jakarta: PT. Raja Grafindo. 134 hlm.
-
[10] Nugroho, AE. 2015. Analisis Pemasaran Tandan Buah Segar Kelapa Sawit di Kabupaten Kutai Kartanegara (Studi Kasus pada Petani Swadaya Kecamatan Muara Muntai). Magrobis Journal, 15 (2), 1-24.
-
[11] Ningsih, K., H Felani, H Sakdiyah. 2015. Keragaan usahatani dan pemasaran buah naga organik. Jurnal Agriekonomika, 4(2), 168-184.
-
[12] Saputra, AS., TD Hapsari, J Januar. (2015). Analisis Efisiensi Biaya Usahatani Jamur Tiram (Pleurotus Sp) dan Pemasarannya di Kabupaten Jember. Agritrop Jurnal Ilmu-Ilmu Pertanian, 13(2): 1-12.
-
[13] Nuriati, NK. 2019. Analisis Efisiensi Saluran Pemasaran Ikan Tongkol Hasil Tangkapan Nelayan Di Desa Seraya Timur Kecamatan Karangasem. Jurnal Pendidikan Ekonomi Undiksha, 10(2), 512522.
-
[14] Pradika, A., AI Hasyim, A Soelaiman. 2013. Analisis Efisiensi Pemasaran Ubi Jalar di Kabupaten Lampung Tengah. J. Iilmu-ilmu Agrib., 1(1): 1-11.
-
[15] Damayanti, R., AN Bambang. 2014. Analisis Harga Dan Pemasaran Ikan Kembung Lelaki (Rastrelliger
kanagurta) Di Pangkalan Pendaratan Ikan (Ppi) Cituis Kabupaten Tangerang. Journal of Fisheries Resources Utilization Management and Technology, 3(3), 176-182.
-
[16] Pay, YA., A Nubatonis. 2017. Analisis Pemasaran Buncis di Desa Oerinbesi Kecamatan Biboki Tanpah Kabupaten Timor Tengah Utara. Jurnal Agribisnis Lahan Kering, 2 (4) 52–54.
-
[17] Febrianti, SS., H Boesono, TD Hapsari. 2013. Analisis Faktor-Faktor yang Mempengaruhi Harga Ikan Manyung (Arius thalassinus) di TPI Bajomulyo Juwana Pati. Journal of Fisheries Resources Utilization Management and Technology, 2(3), 162171.
-
[18] Maisyaroh, N., H Boesono. 2014. Analisis Pemasaran Hasil Tangkapan Lobster (Panulirus sp.) Di Tempat Pelelangan Ikan (Tpi) Se-kabupaten Gunungkidul. Journal of Fisheries Resources Utilization Management and Technology, 3(3), 131-140.
-
[19] Pamuji, LD., AK Mudzakir, BA Wibowo. 2018.
Analisis Rantai Pasok Rajungan (Portunus pelagicus) PT Phillips Seafoods Indonesia di Pemalang, Jawa Tengah. Journal of Fisheries Resources Utilization Management and Technology, 7(3), 71-80.
-
[20] Elpawati, T Budiyanto, Zulmanery. 2014. Analisis Efisiensi Saluran Pemasaran Ikan Bandeng Desa Tambak Sari, Kecamatan Tirtajaya, Kabupaten Karawang. Jurnal Agribisnis, 8(1), 83 – 110
-
[21] Apriono, D., E Dolorosa, Imelda. 2012. Analisis Efisiensi Saluran Pemasaran Ikan Lele di Desa Rasau Jaya 1 Kecamatan Rasau Jaya Kabupaten Kubu Raya. Jurnal Social Economic of Agriculture, 1(3), 29-36.
Discussion and feedback