Performance Of Milkfish (Chanos chanos) Cultured by Different Stocking Density in Floating Net Cages Lake Batur, Trunyan Village, Bali
on
Advances in Tropical Biodiversity and Environmental Sciences 5(1): 29-33, February 2021 e-ISSN:2622-0628
DOI: 10.24843/ATBES.v05.i01.p05 Available online at: https://ojs.unud.ac.id/index.php/ATBES/article/view/68034
29
Performance Of Milkfish (Chanos chanos) Cultured by Different Stocking Density in Floating Net Cages Lake Batur, Trunyan Village, Bali
Gede Dwi Sukmawantara1*, I Wayan Arthana2, and Gde Raka Angga Kartika3
123Department of Aquatic Resources Management, Faculty of Marine and Fisheries, Udayana University
Jl. Kampus Unud Bukit Jimbaran, Kuta Selatan, Badung, Bali
*Corresponding author: dsukmawantara@yahoo.com
Abstract. Lake Batur is the largest lake in the island of Bali. Lake Batur is widely used by the community in the aquaculture sector, namely floating net cage cultivation. The research aims to determine the influence of different stocking density on the growth rate and survival rate of the milkfish (Chanos chanos) in the 4 x 1 meters floating net cages in Lake Batur, Trunyan village. Data collection was done every two weeks during two months observation, from January 2020 – March 2020. The research used a complete random design consisting of three treatments and three replications of each treatment, which the treatment A of 15 fish/0.25m3, treatment B of 20 fish/0.25m3, and the treatment C of 25 fish/0.25m3. Measurements of fish length, fish weight, and water quality were done in situ. The results showed that the difference in stocking density had no effect on the absolute length, but those difference had an effect on the specific growth rate (SGR) and the survival rate of the fish. Treatment B resulted a maximum value of the growth rate, with an absolute length value of 0.69 ± 0.115cm/2 month and SGR 1.02 ± 0.095%/day. The fish survival rate at treatment A resulted in the highest value of 89 ± 3.46%/2 month. The value of water quality during the study were temperature of 25.9 ± 0.8oC, DO of 8.3 ± 0,1 mg/L, pH of 9.4 ± 0.2, and TDS of 995.5 ± 70.8 ppm.
Keywords: batur lake; growth rate; milkfish; stocking density
-
I. INTRODUCTION
Lake Batur is the largest lake on the island of Bali, located in Kintamani, Bangli Regency. Lake Batur is currently widely used by the community in the aquaculture sector, namely floating net cage cultivation. Cultivation of floating net cage in Lake Batur is scattered almost on all sides of the lake. The distance between the cages and the land ranges from 20 meters - 50 meters. The type of fish that is often stocked by the fish farmer in Lake Batur is tilapia (Oreochromis niloticus). The existence of tilapia culture generally aims to increase fishery activities, especially floating net cage cultivation around the Lake Batur area. The increase in fishery production will continue to be carried out, based on the determination of Lake Batur as a minapolitan area for freshwater fish cultivation [1]. One of the efforts to increase Lake Batur fishery production is by adding fish commodities to floating net cage cultivation in Lake Batur. The type of fish that has economic value and has the potential for cultivation is milkfish (Chanos chanos). The condition of the inundated waters of Lake Batur has resulted in plants such as moss being able to breed in floating cage net and the abundance of plankton in the waters of Lake Batur which can be used as natural food for milkfish, because
milkfish is food for plant eaters such as moss and plankton. Milkfish can live in areas of fresh water, brackish water (ponds) and salt water (sea). Milkfish (Chanos chanos), also known by another name, namely milkfish, has a good prospect for development because it is widely favored and utilized by the community. Milkfish is one of the fish that has the potential to be an alternative solution for cultivation in Lake Batur. There are several factors that need to be considered in the growth of milkfish in the marine cage culture process, one of the important factors that affect fish growth is stocking density. Stocking density is an important factor in cultivation activities, because it can affect the growth rate and metabolism of protein-carbohydrate fat in the fish's body, as well as the possibility of stress that occurs [2]. Based on the description, this research was conducted to determine the optimum stocking density as an effort in developing milkfish to become an alternative solution for aquaculture products for cultivators in Lake Batur.
-
II. METHODS
Experimental setup
This study used an experimental method with a completely randomized design. Observations were done
every 2 weeks for 8 weeks. There were three treatments and three replications for each treatment which sre treatment A of 15 fish/0.25m3, treatment B of 20 fish/0.25m3, and treatment C of 25 fish/0.25m3. Growth rate and water quality were measured directly (in situ) at the research location, in floating net cages located in Trunyan Village, Bangli.
Materials
The materials used in this study were milkfish size 7-8 cm and culture water as the test sample. The tools used in this study were net a 1 x 0.5 x 0.5 m net, scoop net, digital scales, basin, ruler, DO meter, TDS meter, pH meter, and thermometer..
Water Quality Parameter
Water quality was measured simultaneously with growth rate measurements, which was once every 2 weeks with in situ measurements. The variables measured include temperature, dissolved oxygen (DO), degree of acidity (pH) and TDS (Total Dissolved Solid).
Data Analysis
The research data was analyzed using One Way Analysis of Variance (ANOVA) and Duncan's advanced test with a significance level of 5%. Testing on research results using Statistical Product and Service Solutions (SPSS) software. The variables measured included the absolute length of milkfish, spesific growth rate (SGR) of milkfish, survival rate (SR) of milkfish. Absolute length growth is calculated by the formula [3]:
L = Lt — Lo
Noted: L is the absolute length of the fish (cm), Lt is the length of the fish at the end of the study, Lo is the length of the fish at the beginning of the study.
The specific growth rate of milkfish was calculated used the formula [3]:
sgr = LnWt -LnWo × 1QQ%
Noted: SGR is the specific growth rate of fish (%/day), Wt is the weight of the fish at the end of the study (g), Wo is the weight of the fish at the beginning of the study (g), t is the time (days).
The survival rate of milkfish is calculated used the formula [4]:
SR = — × 100
No
Noted: SR is fish survival (%), Nt is the number of fish at the end of maintenance, No is the number of fish at the beginning of stocking.
-
III. RESULT AND DISCUSSION
Absolute Length
Based on the growth graph of the absolute average length (Figure 1) of the three treatments of milkfish during the observation, the results obtained that treatment B has the highest value compared to treatments A and C. Treatment A produces an average absolute length value of 0.56 ± 0.076 cm, treatment B produces an average absolute length value of 0.69 ± 0.115 cm, and treatment C produces the mean absolute length value was 0.61 ± 0.104 cm. Based on the results of the One Way ANOVA statistical analysis with Duncan's continued test, it shows that treatment with different stocking densities does not have a significant effect on the absolute length of the milkfish.
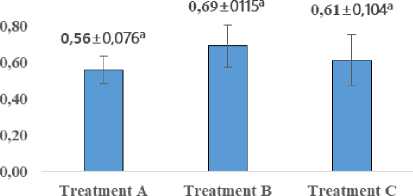
Figure 1. Absolute length of milkfish
The absolute length growth of milkfish during maintenance in the floating cage net Lake Batur has an average of 0.56 cm - 0.69 cm. Based on the observations on absolute length, treatment B with a stocking density of 20 individuals had the highest absolute length value compared to treatments A and C, namely 0.69 ± 0.115 cm. These results indicate the existence of good food utilization in fish during maintenance so as to produce maximum value. Fish growth is also influenced by the ability of fish to utilize feed [5]. Feed is a critical component of the success of cultivation. Providing proper feed nutrients will result in optimal growth and feed efficiency [6]. Growth is also influenced by several factors such as heredity, age, water quality, disease, cultivation media and endurance and the ability of these fish to use feed [4]. The results in this study from the three treatments, it was known that treatment B produced the maximum value among the other two treatments. The results of field observations in the floating cage net for 8 weeks on the growth of milkfish length showed that the maximum value was produced in treatment B with a stocking density of 20 fish.
SGR (Spesific Growth Rate)
Based on the SGR (Specific Growth Rate) graph of milkfish (Figure 2), during the observation it was known that treatment B had the highest SGR value, which was 1.02 ± 0.095% compared to treatment A which resulted in
a value of 0.74 ± 0.099% and treatment C which resulted in a value of 0.81 ± 0.150%. The results of the One Way ANOVA statistical analysis with Duncan's continued test showed that the treatment with different stocking densities of the milkfish SGR showed that the SGR value of treatment A was significantly different from the SGR value of treatment B, while the SGR value in treatment C produced a value that was not significantly different from the SR value in treatments A and B.
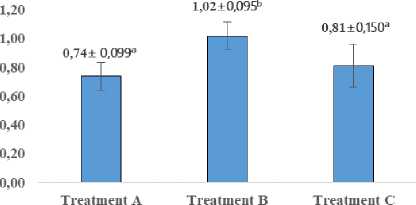
Figure 2. SGR (Specific Growth Rate) of Milkfish
Observations for 8 weeks showed an average SGR yield or a daily growth rate of 0.74% - 1.02%. The highest value of SGR was generated in treatment B while the lowest value was in treatment A. The average yield value in each treatment showed a difference in the difference in value, this result indicated that stocking density could disrupt the process of fish growth rate. This statement is in accordance with the research results of Faisyal et al. [5] which stated that the average value of each growth variable for milkfish was different in floating net cages in the abrasive waters of Kaliwlingi village, it was assumed that the high stocking density was too high in treatment C (30 fish/m2) which causes a lack of space to move limited that to the stress of fish. This is because milkfish have a clustering nature and live in the water column so that they experience competition for food due to the high stocking density. High a stocking density will stimulate the fish's body to produce an excessive amount of the hormone cortisol, which causes stress on fish. Density levels that are too high, often cause decreasing of individual growth rates and feed utilization in fish [2].
The SGR of treatment B with stocking density of 20 fish had a higher value compared to treatment A with stocking density of 15 fish. This is presumably due to the lack of use of food in the milkfish itself, apart from the lack of use of food in the fish, the condition factors also affect the condition of the fish in the fish body's metabolic system as well as affect the fish appetite. According to Sunarto and Sabariah [7], the growth rate depends on the amount of feed consumed, the amount of protein content in the feed, water quality and other factors such as heredity, age and endurance and the ability of the fish to use the feed. This shows that by using good food influences fish to produce maximum value for growth. Amount of feed that the fish
can consume every day is one of the factors that affect the potential for fish to grow optimally because it is related to emptying the stomach contents [8].
SR (Survival Rate)
The highest survival rate (SR) was produced in treatment A and the lowest was in treatment C (Figure 3). The SR value in treatment A was 89 ± 3.46%, treatment B was 82 ± 5.77% and treatment C was 79 ± 2.31%. The results of the One Way ANOVA statistical analysis with Duncan's continued test showed that treatment with different stocking densities on SR of milkfish produced a significant different effect. The results of the analysis showed that the SR value of treatment A was significantly different from the SR value of treatment C, while the SR value in treatment B produced a value that was not significantly different from the SR value in treatment A and C.
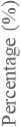
Figure 3. SR (Survival Rate) of Milkfish
Survival rate milkfish during the observation ranged from 79% - 89%. This value is higher when compared to the research of Faisyal et al. [5], which was carried out in floating net cages in abrasive waters, the average SR in this study was 74% - 84%. This value is lower when compared to research conducted by Chilmawati et al. [9], with an average survival value of 99%. This is presumably due to the addition of probiotics in the feed given in the study. Their research suggested that the addition of probiotics in feed can also increase immunity and affect survival. Used of probiotics can increase the survival rate and body resistance of fish against pathogenic infections [10].
The highest SR value during the observation was shown in treatment A with a stocking density of 15 fish. Treatment C with a stocking density of 25 fish produced the lowest SR value compared to the other two treatments. High stocking density results in competition for food as well as competition for fish space to move, which triggers stress on fish and leads to death. The results of this study are consistent with the research of Faisyal et al. [5], the density of 30 fish/m2 used in this study had the lowest survival rate of 74.96 ± 4.79%. It is assumed that at the stocking density of 30 fish/m2, the space for the fish to move is getting narrower and there is competition for feed which will cause the fish to become stressed. High
distribution density is one of the causes for the low survival rate, the more density of the distribution, the smaller the survival rate [11]. Fish mortality occurs because of the narrow space for fish to move so that it can exert pressure on the fish which can result in decreased immune system causing stress and even death [12]. These results indicate that treatment with low density results in better SR value or fish survival than those with high stocking densities. Higher the density, the increased competition for space in the container. This causes the fish to experience stress which causes the metabolic rate to increase [13].
Water quality
The water quality parameter values measured for 8 weeks of observation in the maintenance net include temperature, DO, pH, and TDS (Table 1). Based on the results of observations of water quality values, several water quality parameters were found that did not support the growth rate of fish. Based on the results of observations for 8 weeks, the average temperature value in the selection net was around 25.9°C. Research Saraswati and Sari [14], stated that the temperature range is suitable for milkfish life, where the optimal temperature for milkfish ranges from 27°C - 30°C. The temperature produced in the Lake Batur marine cage has not been optimal for the growth of milkfish in Lake Batur. The temperature value is based on SNI [15], the optimal temperature value ranges from 28ºC - 32ºC for log production. Less optimum water temperature will inhibit the growth rate of fish. Temperature is below the optimum or above the optimum fish growth becomes slow, due to relatively low feed consumption. Changes in temperature will affect food intake, metabolic processes, enzymatic processes, protein synthesis and diffusion of small molecules [16].
The DO (Dissolved Oxygen) parameter value for 8 weeks of observation resulted in an average value ranging from 8.3 mg/l. Based on SNI [15], the optimal value of dissolved oxygen in milkfish maintenance is at least 3 mg/l in log production. The DO value generated in KJA waters is still fairly optimum for fish growth and fish survival rates. Dissolved oxygen is not balanced, it will cause stress to the fish because the brain does not get enough oxygen supply, and death due to lack of oxygen due to the fish's body tissue unable to bind oxygen dissolved in the blood [17].
The value of the degree of acidity or pH in floating net cages waters during the observation showed an average value of 9.4. The pH value generated in the waters of the Lake Batur floating net cage is not good, based on SNI [15], the optimal pH value in milkfish rearing is around 7.0 - 8.5. The high pH value in Lake Batur is thought to be due to the high and low levels of rainfall affecting the water quality in the waters, besides that there is community
activity related to household waste which results in high organic matter which can increase the concentration of ammonia in the waters. Ideal pH for freshwater biota is between 6.8 - 8.5. Very low pH causes the solubility of metals in water which is toxic to aquatic organisms, on the other hand, a high pH can increase the concentration of ammonia in water which is also toxic to aquatic organism. pH that is not optimal can affect the growth rate and experience stress on the fish in the waters [17].
The solid content of the material in the waters of Lake Batur is measured based on total dissolved solids, TDS (Total Dissolved Solid). The TDS value of the waters during the observation resulted in an average value of around 995.5 ppm. Based on water quality standards, PP No. 82 [18] (class II and III), the TDS range for fish farming is 1000 mg/l. Wijayanti et al. [19], interpreted in their research that the smaller the concentration in these waters the better for fish maintenance. High level of TDS was caused by the large number of organic and inorganic compounds that were soluble in water, minerals and salt [20].
TABLE I
WATER QUALITY IN LAKE BATUR FLOATING NET CAGE DURING OBSERVATION
|
Parameters |
Average value |
Unit |
|
temperature |
25,9 ± 0,85 |
ºC |
|
DO (Dissolved Oxygen) |
8,3 ± 0,10 |
Mg/l |
|
pH |
9,4 ± 0,21 |
- |
|
TDS ( Total Dissolved Solid) |
995,5 ± 70,82 |
ppm |
-
IV. CONCLUSION
Cultivator in Lake Batur can cultivate milkfish in KJA with a stocking density of 15-20 fish/0.25m3. The best growth rate and SGR were obtained in treatment B with a stocking density of 20 fish/0.25m3. The highest survival rate was obtained in treatment A with a stocking density of 15 fish/0.25m3 with a percentage of 89%.
ACKNOWLEDGE
The author's gratitude goes to Mr. I Made Puja as the owner and cultivator of freshwater fish in the floating net cages in Trunyan Village, who helps a lot in the field. Thank you to the supervisor and all parties who have guided and assisted the author in completing this research.
REFERENCES
-
[1] Radiarta, I. N., & Sagala, S. L. 2012. Model Spasial Tingkat Kesuburan Perairan di Danau Batur Kabupaten Bangli Provinsi Bali dengan Aplikasi
Sistem Informasi Geografis. Jurnal Riset Akuakultur, 7(3): 499-508.
-
[2] Heras V de las, Martos-Sitcha JA., Yúfera M., Mancera JM., Rodríguez, G.M. 2015. Influence of stocking density on growth, metabolism and stress of thick-lipped grey mullet (Chelon labrosus) juveniles. Jurnal Aquaculture, 448: 29–37.
-
[3] Zonneveld, N., Huisman E.A., dan Boon, J.H. 1991. Prinsip-Prinsip Budidaya Ikan. PT Gramedia Pustaka Utama.
-
[4] Effendi, M.I. 1997. Biologi Perikanan. Yayasan
Pustaka Nusantara. Yogyakarta. 163 hlm.
-
[5] Faisyal, Y., Rejeki, S., dan Widowati, L.L. 2016. Pengaruh Padat Tebar Terhadap Pertumbuhan Dan Kelulushidupan Ikan Bandeng (Chanos chanos) Di Keramba Jaring Apung Di Perairan Terabrasi Desa Kaliwlingi Kabupaten Brebes. Journal of Aquaculture Management and Technology, 5(1):
155-161.
-
[6] Radona, D., Subagja, J., dan Kusmini, I. I. 2017. Kinerja Pertumbuhan Dan Efisiensi Pakan Ikan Tor tambroides Yang Diberi Pakan Komersial Dengan Kandungan Protein Berbeda. Media Akuakultur, 12(1): 27-33.
-
[7] Sunarto dan Sabariah. 2009. Pemberian Pakan Buatan Dengan Dosis Berbeda Terhadap Pertumbuhan Dan Konsumsi Pakan Benih Ikan Semah (Tor Douronensis) Dalam Upaya
Domestikasi. Jurnal akuakultur Indonesia, 8 (1):67-76.
-
[8] Setiawati, M dan Suprayudi, M. A. 2003. Pertumbuhan Dan Efisiensi Pakan Ikan Nila Merah (Oreochromis Sp.) yang Dipelihara pada Media Bersalinitas. Jurnal Akuakultur Indonesia, 2(1): 2730.
-
[9] Chilmawati, D., Swastawati, F., Wijayanti, I., Ambarynto, Cahyono, B. 2018. Pengunaan Probiotik Guna Peningkatan Pertumbuhan, Efisiensi Pakan, Tingkat Kelulusan Dan Nilai Nutrisi Ikan Bandeng (Chanos-chanos). Journal of Fisheries Science and Technology, 12(2): 119 -125.
-
[10] Iribarren, D., Dagá, P., Moreira, M. T., & Feijoo, G. 2012. Potential environmental effects of probiotics used in aquaculture. Aquaculture international, 20(4): 779-789.
-
[11] Ritonga, L. B. 2020. Pengaruh Padat Tebar yang Berbeda Terhadap Kelulushidupan dan Laju
Pertumbuhan Ikan Wader Cakul (Puntius binotatus). Jurnal Chanos chanos, 1(1): 1-6.
-
[12] Diansari, R.R.V.R., Arini, E., dan Elfitasari, T. 2013. Pengaruh Kepadatan yang Berbeda Terhadap Kelulusan Hidup Ikan Nila (Orechromis niloticus) pada Sistem Resirkulasi dengan Filter Zeolit. Jurnal of Aquaculture Management and Technology, 2(3): 37-45.
-
[13] Ismi, S., Kusumawati D., dan Asih Y.N. 2016. Pengaruh Lama Waktu Pemuasaan Dan Beda Kepadatan Benih Kerapu Pada Transportasi Secara Tertutup. Jurnal Ilmu dan Teknologi Kelautan Tropis, 8(2): 625 – 632.
-
[14] Saraswati, S.A., dan Sari, A.H.W. 2017. Kajian Kualitas Air dan Penilaian Kesesuaian Tambak dalam Upaya Pengembangan Budiaya Ikan Bandeng (Chanos chanos, Forskal) di Desa Pemuteran Kecamatan Gerokgak Kabupaten Buleleng. Samakia: Jurnal Ilmu Perikanan, 8(2): 01-05.
-
[15] [SNI] Standar Nasinal Indonesia. 2013. Ikan bandeng (Chanos chanos, forksal) - Bagian 3: Produksi benih. SNI 6148.3:2013. Jakarta. 13 hlm.
-
[16] Kelabora, D. M. 2010. Pengaruh Suhu Terhadap Kelangsungan Hidup dan Pertumbuhan Larva Ikan Mas (Cyprinus carpio). Jurnal Berkala Perikanan Terubuk, 38(1): 71-81.
-
[17] Tatangindatu, F., Kalesaran, O., dan Rompas, R. 2013. Studi Parameter Fisika Kimia Air pada Areal Budidaya Ikan di Danau Tondano, Desa Paleloan, Kabupaten Minahasa. E-Journal Budidaya Perairan, 1(2): 8-19.
-
[18] [PP No. 82] Peraturan Pemerintah No. 82. 2001. Pengelolaan Kualitas Air dan Pengendalian Pencemaran Air. Jakarta-Indonesia: Kementrian Lingkungan Hidup.
-
[19] Wijayanti, M., Khotimah, H., Sasanti, A.D.,
Dwinanti, S.H., dan Madyasta Anggana Rarassari. 2019. Pemeliharaan Ikan Nila (Oreochromis
Niloticus) Dengan Sistem Akuaponik Di Desa Karang Endah, Kecamatan Gelumbang, Kabupaten Muara Enim Sumatra Selatan. Journal of Aquaculture and Fish Health, 8(3): 139-148.
-
[20] Rinawati, Hidayat, D., Suprianto, R., dan Dewi, P.S. 2016. Penentuan Kandungan Zat Padat (Total Dissolve Solid Dan Total Suspended Solid) Di Perairan Teluk Lampung. Analit: Analytical and Environmental Chemistry, 1(1): 36-45.
Discussion and feedback