PARALLEL COMPUTING FOR BLURRING IMAGE USING MEAN AND WEIGHTED AVERAGE METHOD
on
E-Jurnal Matematika, Vol. 7 (1), Januari 2018, pp.11-16
DOI: https://doi.org/10.24843/MTK.2018.v07.i01.p178
ISSN: 2303-1751
PARALLEL COMPUTING FOR BLURRING IMAGE USING MEAN AND WEIGHTED AVERAGE METHOD
M. Reza Syahziar1,*, P. H. Gunawan2
1Program Studi Ilmu Komputasi, Fakultas Informatika - Universitas Telkom [Email: msyahziar@yahoo.com] 2Program Studi Ilmu Komputasi, Fakultas Informatika - Universitas Telkom [Email: phgunawan@telkomuniversity.ac.id]
* Corresponding Author
Abstract
Blurring is one of the basic image processing technique in order to reduce the noise in a image. In this paper two methods of blurring which are called mean and weighted average method will be elaborated. Three different sizes of mask (3 × 3, 5 × 5 and 7 × 7) are given for each method. Moreover, three dfferent Cfresolution images 1000 × 1000, 700 × 700, and 400 × 400 pixels are used. From the experiment result, the output image by mean method is shown a darker than the weighted average method. Additionally, run time of CPU using mean method is around 77.78 % shorter than weighted average method.
Keywords: Blurring, mean method, weighted Average method, parallel computing, image processing
-
1 INTRODUCTION
Image processing is the process to read an image and extract the information in that image or change the condition of the image. For example, changing image into black and white color, getting an image clearer, making an image blur and etc. This could be done using MATLAB that can be used to do image processing and image quality assessment Krasula et al. (2011); Eker and Eker (2013), or we could use C or C++ to do basic image processing technique or advanced programming technique Schlipsing and Salmen (2010).
Blurring is one of the basic technique in image processing that can be used to protect the information in image or video. For example in the news where a criminal is blurred in the face area or in television series that blurred the brand of some products. Indeed, the blurred image needs a method or some methods to process the original image. Several methods for blurring an image are available, for instance, a Gaussian, mean,
weighted average method, and etc. Those methods can be used to blur an image in order to filter or remove noises and to make image readable Patidar et al. (2014); Malviya and Ahmia (2014).
In this paper we want to compare two blurring methods which which are mean and weighted average method. The mean method is a method where calculates a pixel value of the image by averaging the total of neighbors depend on the size of mask. For example, if the size of mask is 3 × 3 it means the total of neighbors are 9.
Image processing can be done by serial or parallel programming to divide the tasks for calculating pixel in the image Saxena et al. (2013). Here, the parallel computing using mean and weighted average method will be investigated. Several experiments will be given in order to show the effect of parallel processing. Moreover, in this research, one image which is known as Lena image will be used as the benchmark.
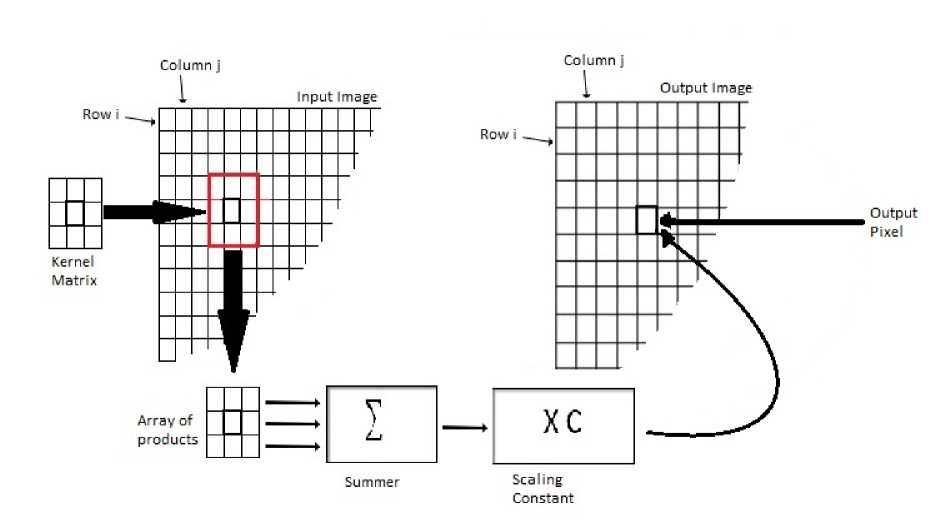
Figure 1. The convolution process of an image for each pixel.
-
2 MEAN AND WEIGHTED AVERAGE
METHOD
Convolution is an process for computing an pixel in an image by adding its local weighted neighbors. In this process, a kernel, a convolution matrix, or a mask should be given in the form of a small matrix. This process commonly used for sharpening, blurring, edge detection, and etc.
The illustration of this convolution can be seen in Figure 1. In the figure, the output image is obtained by weighting each pixels in input image in local neighbors. Moreover, the result of output image is depend on the size of local neighbors.
The convolution can be described by the following equation,
g(x, y ) = T [f (x, y)], (1)
where T is a function which operates of neighborhood of pixels and x, y is row and column value.In the form of mathematical
discrete, it can be written as
L 2 j L n j
g(i,j)= ∑ ∑ h(k,l)f(i-k,j-1),
k=-L 2 JI=-L 2 J
(2) where i, j is row and column value for g,and k, l is row and column value for h that used to find row and column value for f . where i, j, n > 2 ∈ Z+ + {0} and n × n describes the size of mask.
In this paper we will compare the results of mean and weighted average method. We used mask in different sizes for both methods, which are 3 × 3,5 × 5 and 7 × 7. Following (2), then, the mask for mean hmean and weighted average hweighted method are given as follows,
• the mask for mean method,
h
mean
3×3
1/9 1/9 1/9'
1/9 1/9 1/9
1/9 1/9 1/9
the parallel computing.
h
mean
5×5
1111111
h
mean
7×7
49 49
49 49
49 49
49 49
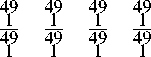
49
49
49 49 49 49 49
49 49 49 49 49
• the mask for weighted average method,
weight ed '3×3
1/10 1/10 1/10’
1/10 2/10 1/10
1/10 1/10 1/10
weight ed
5×5
weight ed h 7×7
r 1
50
1
50
1
50
1
50
1
50
1
50
1
1 216 26
26
216 26
1
50
1
50
1
50
1
50
1
50
1
50
1
1
50
1
50
1
1
50
1
50
1
1
50
1
50
1
50
1
50
1
50
1
50
1
•
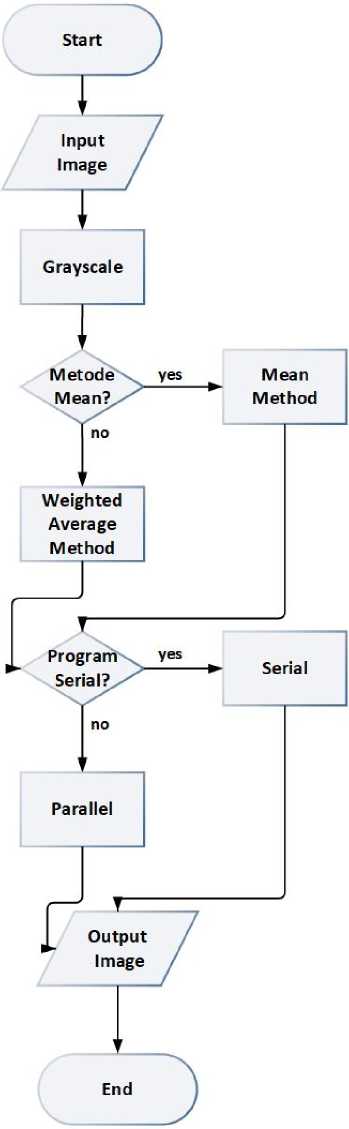
Figure 2. The research framework.
50 50 50 50 50 50 50
In addition, the serial programming and parallel programming using OpenMP library will be elaborated. The run time of CPU for serial program or parallel program will be collected in order to show the performance of
The detail of this research framework is described in Figure 2. Here, the input image should be converted to grayscale image in pre-processing part. Afterward, the method and programming architecture can be chosen which are depend on scenario.
-
3 RESULT AND DISCUSSION
In this experiment we used one image with various resolutions which will be compared to obtain blurring image and run time of CPU program. An image that we used is called Lena (see Figure 3) with format .jpg and has three resolutions 400 × 400, 700 × 700, and 1000 × 1000 pixels.

Figure 3. The original image of Lena.
As explained in previous framework, in the pre-processing, the image is converted to grayscale image which is shown in Figure 4.
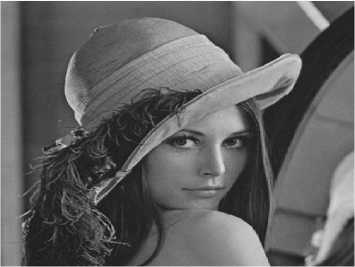
Figure 4. The grayscaled image of Lena.
The results of mean and weighted average can be seen in Figures 5 and 6 respectively. The results show the image with 3 × 3 mask (left), 5 × 5 mask (middle) and 7 × 7 mask (right).
From results image in Figures 5 and 6, we can analyze that the images from mean method have darken color than using weighted average method. This is because of the mask value of weighted average in neighborhood is smaller and in the center is bigger than mean method. Therefore, the pixel value
which is calculated by mean method produce image with neat and brighter result.
Indeed this blurring effect can be used to reduce the noise in the image Elad and Feuer (1997). Moreover, the size of mask resulting different effects. From Figures 5 and 6, using 7 mask sizes, the output image is shown more blur than the smaller sizes.
Next, the parallel performance for each mask sizes will be elaborated. Here, three different image sizes 100 × 1000, 500 × 500 and 400 × 400 are used in order to see the effect of parallel computing.
Table 1. Run Time CPU Mask 3x3 Mean Method
|
Image Size |
Mean | |
|
Serial |
Parallel | |
|
1000 × 1000 |
3.73397 s |
3.53588 s |
|
700 × 700 |
1.84321 s |
1.75139 s |
|
400 × 400 |
0.651323 s |
0.630259 s |
Table 2. Run Time CPU Mask 3x3 Weighted Average Method
|
Image Size |
Weighted Average | |
|
Serial |
Parallel | |
|
1000 × 1000 |
3.47955 s |
3.44142 s |
|
700 × 700 |
1.78398 s |
1.68373 s |
|
400 × 400 |
0.660848 s |
0.583657 s |
Table 1 and 2 show the CPU time of serial and parallel time using mean and weighted average method with mask size 3 × 3 respectively.
Table 3. Run Time CPU Mask 5x5 Mean Method
|
Image Size |
Mean | |
|
Serial |
Parallel | |
|
1000 × 1000 |
3.64039 s |
3.49135 s |
|
700 × 700 |
1.82878 s |
1.71167 s |
|
400 × 400 |
0.642003 s |
0.604389 s |
Meanwhile, the parallel performance using mean and weighted average method with mask size 5 × 5 are given in Table 3 and 4 respectively.
Table 4. Run Time CPU Mask 5x5 Weighted Average Method
|
Image Size |
Weighted Average | |
|
Serial |
Parallel | |
|
1000 × 1000 |
3.62512 s |
3.52146 s |
|
700 × 700 |
1.82303 s |
1.72832 s |
|
400 × 400 |
0.707282 s |
0.654845 s |
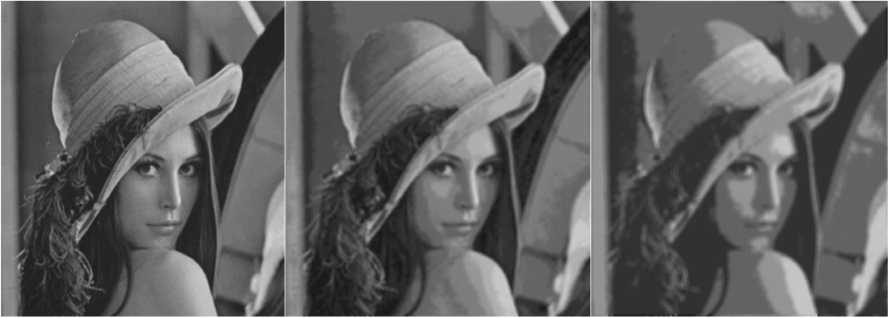
Figure 5. Result blurring mean.
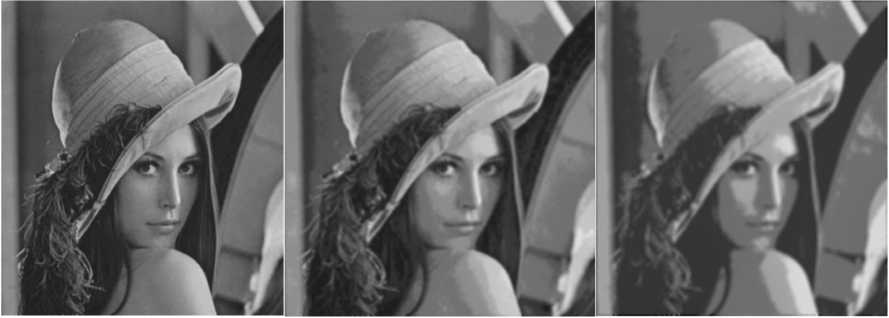
Figure 6. Result blurring weighted average.
Table 6. Run Time CPU Mask 7x7 Weighted Average Method
|
Image Size |
Weighted Average | |
|
Serial |
Parallel | |
|
1000 × 1000 |
3.77606 s |
3.52842 s |
|
700 × 700 |
1.86321 s |
1.75339 s |
|
400 × 400 |
0.721514 s |
0.661345 s |
Table 5. Run Time CPU Mask 7x7 Mean
Method
|
Image Size |
Mean | |
|
Serial |
Parallel | |
|
1000 × 1000 |
3.73397 s |
3.53588 s |
|
700 × 700 |
1.84321 s |
1.75139 s |
|
400 × 400 |
0.651323 s |
0.630259 s |
Finally, Table 5 and 6 are shown the parallel performance by mean and weighted average method in case using mask size 7 × 7 respectively. Table 7 shows the mean of the time different between serial and parallel approach.
Overall from the table of parallel performances, we can see that using parallel computing, the result run time of CPU is shown shorter than serial in all experiments. By using bigger image resolution and mask, the run time of CPU is observed in high computational cost. Moreover, from CPU time, it shows that blurring image using mean method is less computational cost than using weighted average method when the sizes of images and mask are big.
Another interesting point here is from 18 experiments (6 tables times 3 different image sizes), 14 experiments (77.78% of
Table 7. Run Time Different
|
Mask Size |
Diferent for each approach |
Time different between serial and parallel | |
|
Serial |
Parallel | ||
|
3 × 3 |
0.081684 s |
0.024206 s |
0.01916 s |
|
5 × 5 |
0.086299 s |
0.097216 s |
0.01352 s |
|
7 × 7 |
0.132281 s |
0.040546 s |
0.03058 s |
|
Mean Result |
0.100088 s |
0.053989 s |
0.021086 s |
experiments) show that mean method has smaller computational cost compared with the weighted average method.
-
4 CONCLUSION
Blurring image is categorized as the basic process in image processing. In this paper, the comparison of run time of CPU using mean and weighted average method is elaborated. From the result, bigger sizes of mask produces more blur than the original image. Moreover, using mean method, the result is a little bit darker than weighted average method. From parallel performance, the program in serial is observed has CPU time longer than in parallel. Thus the parallel computing can help to reduce the computational cost. Run time of CPU using mean method is shown smaller than weighted average method with percentage around 77.78% by 18 times of experiments.
References
Eker, B. and Eker, A. A. (2013). Matlabbased applications for image processing and image quality assessment. Center for Quality.
Elad, M. and Feuer, A. (1997). Restoration of a single superresolution image from several blurred, noisy, and undersampled measured images. IEEE transactions on image processing, 6(12):1646–1658.
Krasula, L., Kl´ıma, M., Rogard, E., and Jean-blanc, E. (2011). Matlab-based applications for image processing and image quality assessment–part i: Software description. Radioengineering, 20(4):1009–1015.
Malviya, S. and Ahmia, H. (2014). Image enhancement using improved mean filter at low and high noise density. Int. J. Emerging Eng. Res. Technol, 2(3):45–52.
Patidar, P. K., Singh, B., and Bagaria, G. (2014). Image filtering using linear and non linear filter for gaussian noise. International Journal of Computer Applications, 93(8).
Saxena, S., Sharma, N., and Sharma, S. (2013). Image processing tasks using parallel computing in multi core architecture and its applications in medical imaging. International Journal of Advanced Research in Computer and Communication Engineering, 2(4):1896–1900.
Schlipsing, M. and Salmen, J. (2010). Image processing with c/c+.
16
Discussion and feedback