Comparison of Support Vector Machine and K-Nearest Neighbor for Baby Foot Identification based on Image Geometric Characteristics
on
JURNAL ILMIAH MERPATI VOL. 9, NO. 1 APRIL 2021
p-ISSN: 2252-3006
e-ISSN: 2685-2411
Comparison of Support Vector Machine and K-Nearest Neighbor for Baby Foot Identification based on Image Geometric Characteristics
Gde Angga a1, Nyoman Piarsa a2, Made Suwijaa3 aInformation Technology Program, Faculty of Engineering, Udayana University Bukit Jimbaran, Bali, Indonesia-803611
e-mail: 1pratamanugraha38@gmail.com, 2manpits@unud.ac.id, 3putrasuwija@unud.ac.id
Abstrak
Biometric recognition of infant identification systems is critical in security access for identification and verification systems. However, until now, hospitals or health centres in Indonesia still use conventional biometric identification, such as stamping or inking on the soles of babies' feet affixed to paper and are very vulnerable to the risk of damage or loss of data. To resolve this problem, computer vision technology can accurately identify the baby's feet' soles with the final result in the form of digital data. This study compares the classification method of baby feet using the SVM (Support Vector Machine) algorithm with the K-Nearest Neighbor algorithm. The baby's feet understudy image was taken using a cellphone camera with sample data of 3 months old babies. Comparing the SVM and KNN classification methods obtained high accuracy, precision and recall values, namely 98.80% accuracy, 89.51% precision and 88.00% recall. (for the SVM Gaussian kernel classification), with an accuracy of 99.08%, 92.65%
precision and 90.75% recall (for the KNN Ecluidean Distance classification), it can be concluded that the KNN classification method using Euclidean distance is the best for applied in the baby palm identification system using the geometric image feature.
Keywords: Digital Image, Biometrics, Support Vector Machine, K-Nearest Neighbor, Image Geometry
The case of the loss or exchange of a newborn baby is a disaster that parents greatly fear around the world. Issues of loss or exchange of newborns often occur because the newborn recognition system used until now still uses ink-stamp media for baby feet and name bracelets on paper which are usually easily damaged or lost [1].
The development of increasingly sophisticated computer vision technology can replace conventional self-recognition systems with the Biometric identification method. Biometrics method can recognize the distinguishing characteristics of body parts or behaviour of a person being tested to get the identity of the owner automatically [2]. The biometric methods that are usually used as self-recognition systems are the fingerprint system, iris, facial recognition system, voice, geometry, and texture or fingerprints. The biometric method in newborns that is easiest to obtain is on the soles of the baby's feet, and this is proven because until now the baby's footprint method is still used as a marker for newborns, therefore research on the biometric identification system for newborns uses the geometric method. The soles of baby's feet, which are expected to replace conventional recognition systems applied by hospitals, switch to a more modern system with the support of Computer Vision technology.
The geometric identification system for baby feet using the Support Vector Machine classification method, SVM (Support Vector Machine) is a machine learning algorithm that is often used for the classification process because it can be easily implemented and generally has good performance in the field of pattern recognition [3], in addition to SVM, the KNN method is also used as a comparison. The geometric identification system uses data on the feet of newborns aged three months with 800 images of baby feet in which there are 20 classes of images of newborn feet.
The research methodology describes the stages of research that underlie the process of carrying out data collection and testing of baby's foot data.
The stages carried out in Baby's Foot Identification research included conducting literature studies, collecting baby footprint data, testing the KNN method, testing the SVM method, analyzing the process and results of the KNN and SVM method trials, which aim to determine which method has the most accurate value. Height for baby's foot identification system.
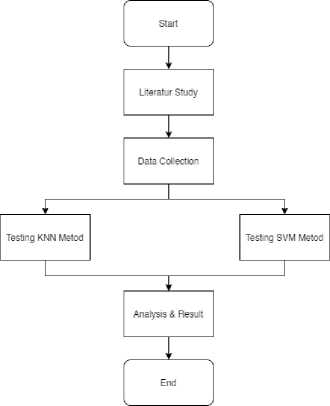
Figure 1. Research Stages
Figure 1 is a research phase to identify the soles of a baby's feet starting from the beginning to the end result. The first stage is a literature study, this stage is carried out to obtain information sources that form the basis of the research theory of baby foot identification, such as the theory of image geometry, the Support Vector Machine method, the K-Nearest Neighbor method, and the biometric system. The second stage was collecting data on the soles of the babies feet, the data collection stage focused on midwives practices and nurseries for babies with three months old babies with locations in Denpasar and Klungkung. The third stage is testing the baby's foot identification system by comparing two methods, namely the Support Vector Machine method with the K-Nearest Neighbor method, where both methods are commonly used classification methods for image identification. The fourth stage is the stage of analyzing the test results of the two methods used, from the SVM and KNN methods, which method gets the maximum accuracy for identifying the soles of the baby's feet at three months of age.
Data collection is a systematic and standard procedure for obtaining the necessary data. Research on Baby Foot Identification uses three types of data collection methods such as the method of observation, interview, and documentation [4]. Observation method is carried out to target data collection locations such as the practice of midwives, family or friends who have been through the delivery process. The interview method is used to get permission from the baby's parents so that the soles of his feet can be documented as sample data. The documentation method used in the Baby Foot Identification research is taking samples with a cellphone camera and assisted by a foam painted in black which functions to focus the camera on the object of the baby's foot. Figure 2 is a tool used to document the object of the baby's foot.
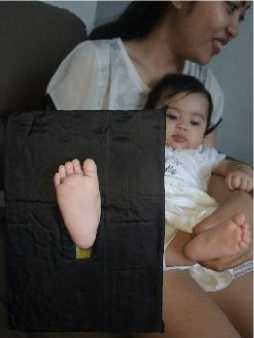
Figure 2. Data Collection
The literature review describes the literature that underlies the research process of Comparison of Support Vector Machine and K-Nearest Neighbor for Baby Foot Identification Based on Image Geometry.
Biometrics, in general, is the study of the biological characteristics of a living thing. The term biometrics comes from Greek, namely bios (life) and metron (measure), the Biometrika method is used to analyze physical and behavioural characteristics. [5]. Previously, the Biometrics system was used to guarantee the authenticity of information such as a thumbprint or a stamp written on a letter. As technology develops, several other physical characteristics and human behaviour can be processed in a biometric system automatically. In 1960, the United States Federal Bureau of Investigation invented a fingerprint recognition system called the Automated Fingerprint Identification System (AFIS) and the US military also invented a form of biometric voice recognition to recognize the voice of a fighter pilot brand. In 1999, biometric sensors were getting cheaper and easier to obtain, so that the use of biometrics as a recognition system became easier.
The digital image is a two-dimensional image in the form of a certain size matrix represented by rows and columns. Digital images, where rows and columns intersect, are called pixels, or picture elements [6]. The development of technology that is increasingly fast makes digital images can be used more deeply, for example, a human biometrics security system based on digital images. The use of digital images into a biometric security system is called computer vision or machine vision, in essence, computer vision tries to imitate the workings of the human visual system (human vision). Human vision is actually very complex. Humans see objects with the sense of sight (eyes), then the image of the object is forwarded to be interpreted in the human brain so that they understand what objects appear in their eyes. Computer vision is an automatic process that integrates a large number of processes for visual perception, such as image acquisition, image processing, classification, recognition, and decision making. Computer vision consists of techniques for estimating the features of objects in the image, measuring features related to object geometry, and interpreting information from object geometry.
Data acquisition is the stage in obtaining an image with the aim of determining the required data and selecting a method for recording digital images. The steps are taken in the data acquisition stage generally start from the preparation of objects, tools, to imaging. Imaging, namely the transformation of visible images (photographs, drawings, paintings, sculptures, etc.)
into digital images [7]. The tools used for imaging are video cameras, digital cameras, scanners, x-ray photos / infrared.
Preprocessing is the stage where the acquired image is repaired and adjusted so that the process of determining the result becomes faster and more accurate when the program is run [8]. Techniques that are usually used in preprocessing are cropping, grayscaling, segmentation and morphological transformation.
-
1. Grayscale is the image processing stage by changing the initial pixel values of a colour image into a grey image [9]. Grayscale images are obtained from the average red, green and blue (RGB) images. The value of the RGB image is divided by three. Thus the average value of the three RGB image values will be obtained. A grayscale image has a pixel intensity value that is in the range 0-255 at a grey level, so the colour that is owned by a grayscale image is solid black (at pixel intensity 0), grey (is at 1-254 pixel intensity), the whitest (is at a pixel intensity of 255) [10]. Mathematical calculations to find the average value of the RGB image are as follows:
R + G+B
(1)
Is the value of the degree of grey, and R is the value of red, G is the value of green, and B is the value of blue. The image process that is carried out is changing the RGB image to a grayscale image so that the colours from the RGB image can be combined into one grey colour, where the previous image can consist of a combination of RGB colours consisting of red, green, and blue. Changing an RGB image into a grayscale image needs to be done to support the next stage, namely the thresholding process where the thresholding process occurs in a grayscale image.
-
2. Segmentation is a process of image segmentation which is classified as a preprocessing process in the object recognition system in the image [11]. Image segmentation means dividing an image into homogeneous areas based on certain similarity criteria between the grey level of a pixel and the grey level of its neighbouring pixels. [3], Then the results of the segmentation process are used for further high-level processes that can be carried out on an image, for example, the image clarification process and the object identification process.
Geometry feature extraction/shape is a physical feature of the foot of a baby that can be seen using the human sense of sight. The extraction of geometric features is not only long and wide but many other aspects that can be used as distinguishing features of the soles of the baby's feet from one another. The geometric feature extraction used consists of the following ten types of features.
-
1. The Slimness feature is the ratio between the length of the baby's feet and the width of the baby's feet. Slimness features have the following formula [12].
Length is the maximum length of the baby's feet on the vertical axis, while the width is the maximum width of the baby's feet on the horizontal axis.
-
2. The Rectangularity feature is the principle for comparing the similarity in the shape of the baby's feet that is closer to the shape of the box. The Rectangularity calculation formula is as follows.
Dy Dx
Rectangularity = (3)
Dy is the length of the baby's feet, and Dx is the width of the baby's feet, while A is the area of the baby's feet.
-
3. Features KD ratio is the ratio between the circumference of the baby's foot and the diameter of the baby's foot. The formula for the circumference to diameter ratio can be seen as follows.
R at io kd = ^ (4)
P is the circumference of the foot of the baby, and D is the diameter of the sole of the baby's foot used in the baby's foot identification system.
-
4. The Narrow vector feature is the ratio between the diameter and the length of the image of the baby's foot. The formula for the Narrow vector calculation can be seen in equation 5.
Narrow Factor = — (5)
Dy is the length of the foot, and D is the diameter of the foot image of the baby.
-
5. The Maximum Length feature is a feature of an image geometry method. The maximum length characteristic is obtained from the process of calculating the longest distance of the pixel point on the Y / vertical axis.
-
6. The Max Width feature is a characteristic of a Geometry method. The maximum width characteristic is obtained from the process of calculating the longest distance of the pixel point on the X / horizontal axis.
-
7. The area feature is the actual number of pixels detected in the baby's foot image and returned in scalar form.
-
8. The perimeter feature is a geometric feature adapted from the rectangular feature because the shape of the human foot when detected by Regionprops resembles a rectangular shape. The formula for the baby's foot rectangle is as follows.
Perimeter Features = 2 x ( P + L ) (6)
P represents the maximum length of the baby's foot, and L represents the maximum width of the baby's foot object that has been detected.
-
9. Diameter feature is a measure of how close the baby's feet are to a circle [12]. The formula for calculating the Roundness can be seen in equation 7.
R ouridriess = (7)
The value of A is the value of the area on the foot of the baby P is the value of the circumference of the object.
-
10. MPA Ratio feature is the ratio between the circumference, length and width of the foot, which is one of the calculations used for the extraction of geometric features. The formula for calculating the ratio of perimeter, length and width can be seen in equation 8.
R kp I = —^— (8)
f (DyDDx)
The P-value is the circumference of the baby's feet while Dy is the length of the foot, and Dx is the width of the baby's feet.
Support Vector Machine (SVM) is an integrated type classification method (supervised) because when the training process requires a specific learning target [13]. SVM first appeared in 1992 by Vladimir Vapnik with his colleagues Bernhard Boser and Isabelle Guyon [14]. The foundations of SVM date back to the 1960s (including early work by Vapnik and Alexei Chervonenkis on statistical learning theory). SVM training times are mostly slow, but the SVM method is very accurate because of its ability to handle complex non-linear models.
SVM is generally used for linear and non-linear data classification. SVM with a nonlinear mapping function is performed when the data is not linearly separated [15]. Data from 2 classes separated by hyperplane is found by SVM using margins and support vectors. SVM
uses a kernel trick to link the training sample input space to the high dimensional feature space and identify the optimal separator hyperplane.
K-Nearest Neighbor (KNN) is a classification algorithm based on the similarity approach. KNN is a method commonly used in classification problems. The KNN method is effective and has been widely used in classification problems [16]. The advantages of the KNN method are quite simple, popular, effective, and efficient. The KNN method is applied frequently and gives good results. Similar objects are classified in the same category. Similarities are obtained based on the closest distance between the sample data and the object. Objects are classified based on the majority of their closest neighbours, where the k parameter indicates the number of closest neighbours.
Measurement of the performance of a classification system is important. Classification system performance describes how well the system classifies data. The confusion matrix is a method that can be used to measure the performance of a classification method. A confusion matrix is a method that is usually used to calculate the accuracy of the data mining concept [17]. The confusion matrix is illustrated by a table that states the amount of test data that is correctly classified and the amount of test data that is incorrectly classified.
Table 1. Confusion Matrix Table
Correct Classification Classified as
Predicted Positive Predicted Negative
Actual Positive True Positives (TP) False Negatives (FN)
Actual Negative False Positives (FP) True Negatives (TN)
Source: Jurnal Implementation of Rumor Detection on Twitter Using the SVM Classification Method Article in English
Table 1 it is known that the performance measurement using confusion matrix, there are 4 (four) terms as a representation of the results of the classification process. The four terms are True Positive (TP), True Negative (TN), False Positive (FP) and False Negative (FN). True positives (TP) is the number of positive data records classified as positive values, false positives (FP) is the number of negative data records classified as positive values, false negatives (FN) is the number of positive data records classified as positive values, true negatives (TN) is the number of negative data records classified as negative values.
Based on the True Negative (TN), False Positive (FP), False Negative (FN), and True Positive (TP) values, accuracy, precision and recall values can be obtained. The accuracy value describes how accurately the system can classify data correctly, or in other words, the accuracy value is a comparison between correctly classified data and the entire data. The sensitivity and specificity steps can be used to classify accuracy. Sensitivity can be designated as the true positives (recognition) rate (the proportion of correctly identified positive tuples), while specificity is the true negatives rate (the proportion of correctly identified negative tuples) [18].
TP
The differences in accuracy, precision, recall, from the classification system, are as follows [19].
TP+TN
TP
Accuracy represents how accurate a model is in classifying. Meanwhile, precision and recall represent the level of how consistent the model is in classifying. The value of precision and recall should not be too lame because it indicates the predictive trend of the model (mostly to class 1 or 0).
The results and discussion describe the process of identifying baby feet which are carried out in several stages, such as image acquisition of baby feet, image preprocessing, image feature extraction, image classification using 2 SVM and KNN methods to determine the final result of the two methods applied using the Classifier performance evaluation method.
Preprocessing data is the initial stage for the baby's foot identification system, such as the image acquisition process of the baby's feet, image preprocessing and feature extraction of the baby's feet. The baby's foot identification system uses 20 pairs of different baby feet with three months of age where each baby has 40 images of baby feet to be divided into 20 images for training data and 20 images further for test data. A total of 400 images of baby feet with age three months can be collected.
Table 2. Baby Names Table
Baby Names
|
Agus |
Azka |
Dewa |
Ibnu |
|
Keira |
Raska |
Yuni |
Alisa |
|
Deva |
Diva |
Karina |
Naira |
|
Riva |
Shabnam |
Ziya |
Bintang |
|
Kanaka |
Roy |
Bima |
Isyana |
The image of the baby's foot that has been collected with a total of 400 images will then enter the image preprocessing stage where the image of the baby's foot that was originally in the RGB colour space will be converted into a grayscale image. The purpose of changing the colour of the baby's foot image from RGB into a grayscale image is to facilitate the image segmentation process, which can only be done in grayscale image format. The next process is the image segmentation process with a method where the image segmentation process aims to remove noise that is still visible in the baby's foot image. The segmentation method used is the bwareaopen segmentation method which selects images based on the desired image area. The results of the segmentation process can be seen in Figure 3.

(a) (b) (c)
Figure 3. (a) Initial Image, (b) Image Segmentation, (c) Final Result
Figure 3 (a) is the initial image of the baby's feet before image segmentation, after the image segmentation process using the bwareaopen method, the system can select the image of the baby's foot properly without noise (b) so that the system can recognize the object of the baby's foot (c) with clear. The identification process of the baby's feet next is the process of image feature extraction where the segmented image (c) will take the ten predetermined features such as the geometric features of length, width, area, diameter, circumference, slimness, rectangularity, KD ratio, MPA ratio and narrow vector. The results of the extraction of 10 features of the baby's feet can be seen in Figure 4.
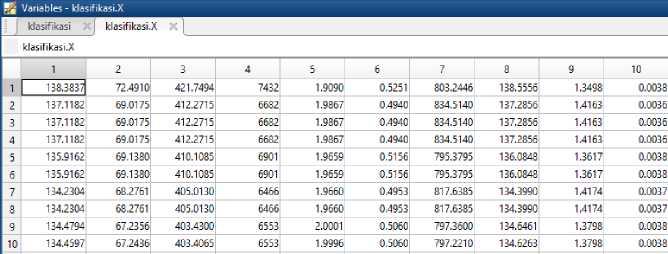
Figure 4. Image Feature Extraction
Figure 4 is a display of the results of the feature extraction process of the baby's foot image. The ten features of the baby's foot images that have been obtained will then be saved into the SVM template with .mat extension, this SVM template serves as a system training data to recognize the image of the baby's foot to be tested.
The identification system of baby's feet by using geometric image features has not been completed until the process of image feature extraction only, but the system will continue into the image classification process where the classification process will determine the image of the foot being tested has the same characteristics as whom. The classification method that is commonly used because it is easy to apply to the system and has many references is the SVM classification method and the KNN classification method. [20]. Stages of the Classification method test will compare the SVM and KNN classification methods. The SVM method will be tested with two kernel parameters, namely the Linear kernel and the Gaussian kernel, while the KNN method that will be tested is the KNN Ecludian Distance and Hamming Distance Method, after getting the results of the four parameters and two methods, then the accuracy level will be obtained and compared with the method. Evaluation of Classifier performance which can be seen in the formula of accuracy (10), Precision (11) and Recall (12).
Linear kernel is the simplest kernel function. The linear kernel is used when the analyzed data is linearly separated. Testing Linear kernel parameters aims to test how accurate the application has been. The results of the test can be seen in Figure 5.
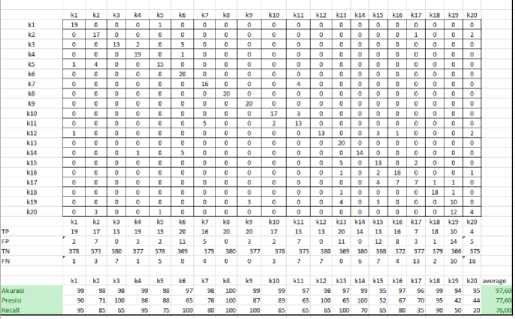
Figure 5. Linear SVM kernel
5 is the result of applying the Linear kernel to the SVM method. The results of testing the Linear kernel parameters in the SVM method got a percentage of accuracy of 97.60%, precision of 77.60% and recall of 76.60%.
A Gaussian kernel is a kernel function commonly used in analysis when data is not linearly separated. Gaussian Kernel Testing aims to test the accuracy of applications created by testing the Support Vector Machine Parameters. The parameter for testing the Baby Foot System is the Gaussian Kernel. The results of the test can be seen in Figure 6.
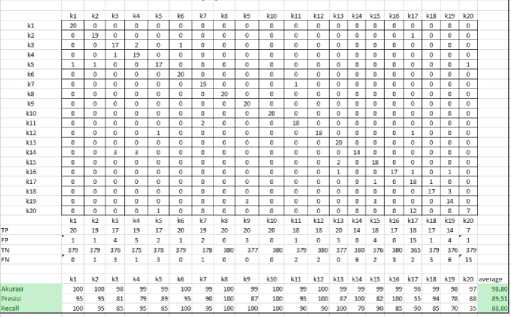
Figure 6. Gaussian SVM kernel
Figure 6 is the result of applying the Gaussian kernel to the SVM method. The results of testing the Gaussian kernel parameters in the SVM method got a percentage of 98.80% accuracy, 89.51% precision and 88.00% recall.
Euclidean Distance is a distance calculation method used to measure the distance from 2 (two) points in Euclidean space (covering two-dimensional, three-dimensional, or even more euclidean planes). Euclidean Distance testing aims to test the accuracy of the application made by testing the K-Nearest Neighbor parameter. The parameters for testing the Baby Foot System are Euclidean Distance. The results of the test can be seen in Figure 7.
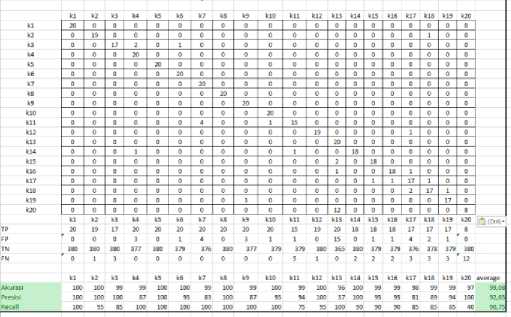
Gambar 7. CNN's Euclidean Distance Method
-
Figure 7 is the result of the application of the KNN Euclidean Distance method. The results of testing the Euclidean Distance KNN method got an accuracy percentage of 99.08%, 92.65% precision and 90.75% recall.
The Hamming distance algorithm can be used to calculate the number of differences between the two binaries that have the same length. Testing the Hamming Distance method
aims to test the accuracy of the application made by testing the KNN parameter. Parameters for testing the Baby Foot System are Hamming Distance. The results of the test can be seen in Figure 8.
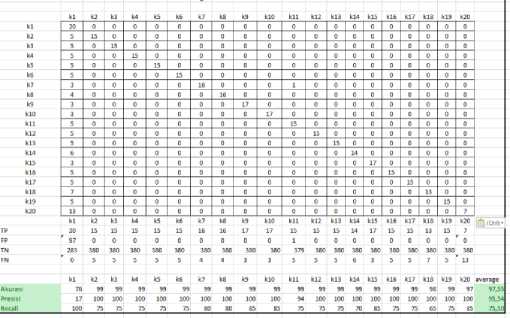
Figure 8. KNN Hamming Distance Method
-
Figure 8 is the result of the application of the Hamming Distance method at KNN. The results of testing the Hamming Distance method at KNN got a percentage of accuracy of 97.55%, precision of 95.54% and recall of 75.50%.
Classifier performance measurement aims to determine the level of accuracy, precision and recall of a system method. The higher the level of accuracy, precision and recall of the system, the higher the level of accuracy of the system functioning. Comparative study of the SVM and KNN classification methods with geometrical image features using 400 test image data and baby foot training images were tested with a scenario like the following.
-
1. Linear and Gaussian kernel SVM classification methods in the identification system of baby's feet using geometric characteristics are tested using 400 images of baby feet to determine the accuracy and recall accuracy obtained. The results obtained from these tests are shown in table 3, where the highest percentage was obtained in the Gaussian kernel with an accuracy rate of 98.80%, 89.51% precision and 88.00% recall.
Table 3. Comparison of SVM Parameter Test Results
|
SVM |
Accuracy |
Precision |
Recall |
|
Linear |
97,60% |
77,60% |
76,60% |
|
Gaussian |
98,80% |
89,51% |
88,00% |
-
2. The KNN Euclidean Distance and Hamming Distance classification methods in the identification system of the baby's feet using geometric features were tested using 400 images of the baby's feet to determine the accuracy and recall accuracy obtained. The test results obtained are shown in table 4, where the highest percentage was obtained in the KNN Euclidean Distance classification method with an accuracy level of 99.08%, 92.65% precision and 90.75% recall.
Table 4. Comparison of KNN Parameter Test Results
|
KNN |
Accuracy |
Precision |
Recall |
|
Euclidean |
99,08%, |
92,65% |
90,75%. |
|
Hamming |
97,55% |
95,54% |
75,50% |
Based on Table 3 and Table 4, it can be seen that the highest accuracy, precision and recall values of the SVM classification method are obtained using the Gaussian kernel method with an accuracy rate of 98.80%, 89.51% precision and 88.00% recall. The performance of KNN in the case of a baby's foot classification is better than that of SVM. The KNN method shows a percentage of accuracy of 99.08%, Precision 92.65% and Recall 90.75%.
Comparison of accuracy, precision and recall of the two SVM and KNN classification methods using two classification parameter methods to identify the soles of the baby's feet has been carried out and provides a value or level of high accuracy, precision and recall, namely accuracy of 98.80%, precision 89, 51% and a recall of 88.00%. (for the SVM Gaussian kernel classification), with an accuracy of 99.08%, 92.65% precision and 90.75% recall (for the KNN Ecluidean Distance classification), it can be concluded that the KNN classification method using Euclidean distance is the best method for applied in the baby palm identification system using the geometric image feature.
References
-
[1] R. Kushwaha, N. Nain, and S. K. Gupta, “Person Identification on the Basis of Footprint
Geometry,” Proc. - 12th Int. Conf. Signal Image Technol. Internet-Based Syst. SITIS 2016, no. March 2018, pp. 164–171, 2017.
-
[2] A. Giełczyk, M. Choras, and R. Kozik, “Lightweight verification schema for image-based
palmprint biometric systems,” Mob. Inf. Syst., vol. 2019, 2019.
-
[3] N. Wayan, E. Rosiana, and I. G. A. Gunadi, “Detection of Class Regularity with Support
Vector Machine methods,” vol. 11, no. 1, pp. 20–31, 2020.
-
[4] C. Tanujaya, “PERANCANGAN STANDART OPERATIONAL PROCEDURE PRODUKSI
PADA PERUSAHAAN COFFEEIN,” vol. 2, no. April, 2017.
-
[5] S. Rahman and M. Ulfayani, “Perancangan Aplikasi Identifikasi Biometrika Telapak
Tangan Menggunakan Metode Freeman Chain Code,” CESS (Journal Comput. Eng. Syst. Sci., vol. 2, no. 2, pp. 64–73, 2017.
-
[6] A. S. Somantri, “Menentukan klasifikasi mutu fisik beras dengan menggunakan teknologi
pengolahan citra digital dan jaringan syaraf tiruan,” vol. 12, no. 3, pp. 162–173, 2010.
-
[7] Y. E. Putra, S. R. Sulistiyanti, and M. Komarudin, “Sistem Akuisisi Data Pemantauan
Suhu dan Kadar Keasaman (pH) Lingkungan Perairan dengan Menggunakan Unmanned Surface Vehicle,” Electrician, vol. 12, no. 3, p. 84, 2018.
-
[8] D. B. Setyohadi, F. A. Kristiawan, and E. Ernawati, “Perbaikan Performansi Klasifikasi
Dengan Preprocessing Iterative Partitioning Filter Algorithm,” Telematika, vol. 14, no. 01, pp. 12–20, 2017.
-
[9] B. RUSMAN, “Sistem Identifikasi Menggunakan Biometrik Telinga Dengan Metode
Jaringan Syaraf Tiruan Learning Vector Quantization ( LVQ ) Sistem Identifikasi Menggunakan Biometrik Telinga Dengan Metode Jaringan Syaraf Tiruan Learning Vector Quantization ( LVQ ),” 2015.
-
[10] I. W. Agus Suryawibawa, I. K. Gede Darma Putra, and N. K. Ayu Wirdiani, “Herbs Recognition Based on Android using OpenCV,” Int. J. Image, Graph. Signal Process., vol. 7, no. 2, pp. 1–7, 2015.
-
[11] I. M. S. P. Kadek Novar Setiawan, “Klasifikasi Citra Mammogram Menggunakan Metode K-Means, GLCM, dan Support Vector Machine (SVM),” Lontar Komput., vol. 6, no. 1, pp. 13–24, 2018.
-
[12] S. Jatmika, T. Aprilianto, M. Idris, P. S. Komputer, and P. T. Informatika, “Ekstraksi fitur untuk mengidentifikasi marga tanaman menggunakan algoritma backpropagation,” vol. 6, no. 1, 2020.
-
[13] T. Marwala, “Support Vector Machines,” Handb. Mach. Learn., pp. 97–112, 2018.
-
[14] I. P. Arya, P. Wibawa, I. K. A. Purnawan, D. Purnami, S. Putri, and N. Kadek, “Prediksi Partisipasi Pemilih dalam Pemilu Presiden 2014 dengan Metode Support Vector Machine,” J. Ilm. Merpati (Menara Penelit. Akad. Teknol. Informasi), vol. 7, no. 3, pp. 182–192, 2019.
-
[15] A. F. Indriani and M. A. Muslim, “SVM Optimization Based on PSO and AdaBoost to Increasing Accuracy of CKD Diagnosis,” Lontar Comput. J. Ilm. Teknol. Inf., vol. 10, no. 2, p. 119, 2019.
-
[16] K. S. A. Wasika, “Klasifikasi Kunci Gitar Menggunakan Spectral Analysis,” J. Ilm. Merpati (Menara Penelit. Akad. Teknol. Informasi), vol. 8, no. 1, pp. 61–71, 2020.
-
[17] A. R. Chrismanto and Y. Lukito, “Identifikasi Komentar Spam Pada Instagram,” Lontar Komput. J. Ilm. Teknol. Inf., vol. 8, no. 3, p. 219, 2017.
-
[18] B. Caraka, B. A. A. Sumbodo, and I. Candradewi, “Klasifikasi Sel Darah Putih Menggunakan Metode Support Vector Machine (SVM) Berbasis Pengolahan Citra Digital,” IJEIS (Indonesian J. Electron. Instrum. Syst., vol. 7, no. 1, pp. 25–36, 2016.
-
[19] O. Natan, A. I. Gunawan, and B. S. B. Dewantara, “Grid SVM: Aplikasi Machine Learning dalam Pengolahan Data Akuakultur,” J. Rekayasa Elektr., vol. 15, no. 1, 2019.
-
[20] S. Aulia, S. Hadiyoso, and D. N. Ramadan, “Analisis Perbandingan KNN dengan SVM untuk Klasifikasi Penyakit Diabetes Retinopati berdasarkan Citra Eksudat dan Mikroaneurisma,” no. February, 2016.
Comparison of Support Vector Machine and K-Nearest Neighbor for Baby Foot Identification 95
based on Image Geometric Characteristics (Gde Angga)
Discussion and feedback