Forecasting Number of COVID-19 in Bali Province Using Neural Network Algorithm
on
JURNAL ILMIAH MERPATI VOL. 9, NO. 1 APRIL 2021 p-ISSN: 2252-3006
e-ISSN: 2685-2411
Forecasting Number of COVID-19 in Bali Province Using Neural Network Algorithm
Ida Ayu Utari Dewia1, I Kadek Noppi Adi Jayaa2, Kadek Oky Sanjaya a3 aInformation Systems Study Program, Faculty of Information Technology and Science, Hindu University of Indonesia, Denpasar
e-mail: 1utaridewi@unhi.ac.id, 2iknadijaya@unhi.ac.id, 3kadekoki@unhi.ac.id
Abstrak
COVID-19 (coronavirus disease 2019) adalah keluarga besar virus yang menyebabkan penyakit ringan seperti pilek sampai penyakit berat seperti MERS dan SARS. COVID-19 sudah menjadi pandemi, yaitu terjadi penambahan dan penyebaran kasus penyakit yang cukup cepat di berbagai negara di seluruh dunia serta menyebabkan kerugian yang sangat besar di berbagai negara. Kasus COVID-19 meningkat setiap hari di Indonesia termasuk di Provinsi Bali dan kerugian yang diakibatkan mendasari dilakukannya peramalan jumlah COVID-19 di Provinsi Bali. Peramalan dilakukan menggunakan algoritma Backpropagation Neural Network terhadap data time series jumlah COVID-19 di Provinsi Bali. Data yang digunakan adalah data jumlah COVID-19 di Provinsi Bali berupa data runtun waktu (time series) yang bersumber dari Dinas Kesehatan Provinsi Bali. Seluruh proses peramalan menggunakan tools Rapidminer Studio mulai dari preprocessing, pemodelan, pengujian dan validasi. Hasil nilai evaluasi RMSE (Root Mean Square Error) berdasarkan pengujian untuk pasien positif sebesar 18.956, pasien sembuh sebesar 15.413, pasien dalam perawatan sebesar 5.066 dan pasien meninggal sebesar 0.233.
Kata Kunci: Covid-19, Neural Network, Time Series
Abstract
COVID-19 (coronavirus disease 2019) is a large family of viruses that cause minor illnesses such as the common cold to serious illnesses such as SARS and MERS. COVID-19 has become a pandemic, which is the addition and spread of disease cases quite rapidly in various countries around the world and caused enormous losses in various countries. COVID-19 cases are increasing every day in Indonesia including in Bali Province and the resulting losses underlie the forecasting of the number of COVID-19 in Bali Province. Forecasting is carried out using Backpropagation the Neural Network algorithm for time series data on the number of COVID-19 in Bali Province. The data used is data on the number of COVID-19 in the Bali Province in the form of time series data sourced from the Bali Provincial Health Office. The entire forecasting process uses the RapidMiner Studio tools starting from preprocessing, modeling, testing and validation. The results of the RMSE (Root Mean Square Error) evaluation value based on testing for the positive patients were 18.956, the patients recovered were 15.413, the patients under treatment were 5.066 and the patients who died was 0.233.
Keywords: Covid-19, Neural Network, Time Series
The Corona virus causes respiratory infections, from the common cold to serious illnesses such as Middle East Respiratory Syndrome (MERS) and Severe Acute Respiratory Syndrome (SARS). The first case of a new type of Coronavirus found in humans occurred in the city of Wuhan, China, at the end of December 2019 and was then named Severe Acute Respiratory Syndrome Coronavirus 2 (SARS-COV 2), and caused Coronavirus Disease-2019 (COVID-19). COVID-19 is caused by SARS-COV 2, which belongs to the same large family of coronaviruses that caused SARS in 2003, only with a different type of virus. Symptoms are similar to SARS, but the SARS death rate (9.6%) is higher than COVID-19 (less than 5%), even
though the number of COVID-19 cases is far more than SARS. COVID-19 also has a wider and faster spread to several countries than SARS [1]
The World Health Organization (WHO) has stated that the 2019 Coronavirus Disease (COVID-19) is a pandemic [2] meaning that there has been an increase in cases of the disease quite rapidly and there has been spread between countries and causing enormous losses in various countries. The increasing number of COVID-19 cases every day in Indonesia, including in the Province of Bali and the resulting losses underlie the forecasting of the number of Covid-19 in the Province of Bali. Forecasting is carried out using the Neural Network method for time series data on the number of COVID-19 in Bali Province. The data used is data on the number of COVID-19 in the Province of Bali in the form of time series data sourced from the Bali Provincial Health Office.
Previous research regarding the prediction of Covid-19 was research [3] conducted with the aim of predicting confirmed positive and recovered COVID-19 cases using the TP-SMN-AR time series model. The results obtained in this study indicate that the proposed method can make predictions in confirming positive and recovering cases of COVID-19 well in a number of countries in the world. The study [4] aimed to predict epidemiological trends in the prevalence of COVID-19 in Italy, Spain, and France, the most influential countries in Europe. This study uses time series data in the form of COVID-19 prevalence data from 21 February 2020 to 15 April 2020 collected from the World Health Organization website using the Auto-Regressive Integrated Moving Average (ARIMA) model. The analysis results obtained in this study can explain the trend of the outbreak and provide an overview of the epidemiological stage of the area. In addition, predictions of COVID-19 prevalence trends in Italy, Spain and France can help take preventive action and formulate policies for this epidemic in other countries.
Forecasting in this study is carried out differently from previous studies. The difference in research using the Backpropagation Neural Network algorithm. Backpropagation algorithm is one of the most effective, popular, and easy to learn procedures in complex multilayer networks to optimize neural network training [5]. The predicted number of COVID-19 categorized as the positive patients, the patients recovered, the patients under treatment and the patients who died. Predicting the number of COVID-19 using the Neural Network algorithm is expected to be able to provide accurate results, so that the information from the forecasting results can be useful to anticipate the spread of COVID-19 in the future.
The research method describes the stages of the research which describes a logical sequence to get the output of the research. Research on forecasting number of COVID-19 in Bali Province using Backpropagation Neural Network algorithm consists of 4 stages consisting of data preprocessing, modeling, testing and validation which can be seen in Figure 1.
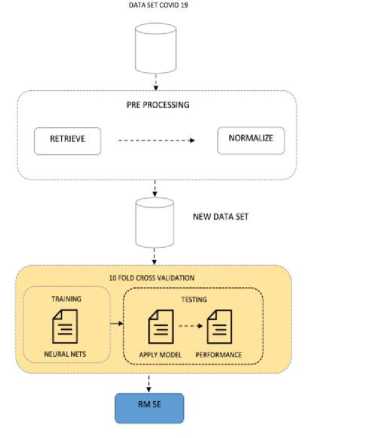
Figure 1. Stages of Research
The dataset used in the study is data sourced from the Bali Provincial Health Office with the url address https://www.pendapatan.baliprov.go.id. The data obtained are the data regarding the number of the positive patients, the patients recovered, the patients under treatment and the patients who died in Bali Province from April to August 2020, consisting of 10 districts. The data used is data in daily counts divided by 90% as training data and 10% as testing data.
The daily data set for the number of COVID-19 (the positive patients, the patients recovered, the patients under treatment and the patients who died) is taken by importing data and changing the role of an attribute, namely the attribute number from the regular attribute to a special attribute, namely as a label. Drag the data that has been set into the process, then the retrieve operator will appear as shown in Figure 2.

Figure 2. Operator Retrieve on RapidMiner
After retrieving it, then normalizing the dataset using the normalize operator on the RapidMiner as shown in Figure 3. Normalization is applied to the number attribute, and the attribute value is changed to a range of 0-1.

Figure 3. Normalize Operator on RapidMiner
The forecasting process is carried out in the RapidMiner application, which is a data processing process to find forecasts from the COVID-19 dataset. RapidMiner that will be used is RapidMiner Studio 9.7. Application used for data analysis and as a data mining machine that can be integrated into its own products use Rapid Miner tool. Rapid Miner work on all operating systems and is written in the Java language [6]. The method used in this research is forecasting with the Backpropagation Neural Network algorithm. According to [7], an effective Neural Network approach for general purposes is to determine patterns, classification, clustering and especially time series forecasting with a high degree of accuracy. The results that will be obtained from the RapidMiner process using the Backpropagation Neural Network algorithm are in the form of Root Mean Square Error (RMSE). RMSE is a frequently used measure of the difference between the values predicted by a model or estimator and the values obtained [8]. The individual difference between the model label and the prediction or forecasting result is called residual when calculations are made of the sample data used for estimation, and is called prediction error when it is calculated out of sample. RMSE functions to aggregate the
magnitude of the error in the predictions for various times into a single measure of predictive power. The label in question is the prediction result of the Neural Network algorithm, the label that appears is an additional label that appears from the forecasting process in the RapidMiner application.
The next stage is conducting training and testing using a Neural Network algorithm. Training and testing data are shared using K-Fold Cross-Validation. All data training and testing
uses K-Fold Cross-Validation. Training data by setting aside a large part of the dataset as test data an idea behind this approach is to reduce the pessimistic bias. The fold test in the K-Fold Cross-Validation does not overlap and ensures that each sample is used for validation so that each sample in the dataset has a chance to be tested. K-Fold Cross-Validation is a special case of Cross-Validation where k repeats of a dataset. The dataset is divided each cycle into k sections: one part is used for validation, and the remaining k-1 sections are combined into a training subset for model evaluation [9]. The number of folds used is 10, because 10-fold cross validation is the best choice to get accurate validation results [10]
The evaluation stage of forecasting results uses performance operators to see the value of Root Mean Square Error (RMSE) so that the level of accuracy can be analyzed according to formula (1) below.
RMSE =
√
(a c t u a I - prediction)2 n
(1)
Information: RMSE Actual Prediction n
Root Mean Square Error
The Actual Value of Covid-19 Predicted Value of Covid-19 Total Data
Evaluate linear regression models by measuring the accuracy of the estimated results of a model using Root Mean Squared Error (RMSE). RMSE is calculated by squaring the error (actual - prediction divided by the number of data (= average), then rooted. RMSE has no units.
The literature study contains material which is the research reference. Selection of references used is adjusted to the topic of research being carried out. The topic of research is predicting the number of COVID-19. The references published are related to COVID-19, Data Mining, Forecasting and Neural Network Algorithms.
Based on the WHO Global Surveillance Guidelines for the novel Coronavirus 2019 (COVID-19) as of March 20, 2020, the definition of COVID-19 infection is classified as follows [11]
-
1. Suspected Case
-
a. Patients with acute respiratory distress (fever, such as cough, shortness of breath and at least one sign / symptom of respiratory illness) and a history of travel or living in an area reporting community transmission of COVID-19 disease for 14 days before symptom onset; or
-
b. Patients with acute respiratory distress and had contact with a confirmed or probable case of COVID-19 in the last 14 days before onset or
-
c. Severe respiratory symptoms with patients (fever, such as coughing, shortness of breath and at least one sign / symptom of respiratory disease and requiring hospitalization) and absence of other diagnostic alternatives that fully explain the clinical presentation.
-
2. Probable case (probable case)
-
a. Suspected cases where test results for COVID-19 are inconclusive; or
-
b. A suspect case where the test result cannot be worked out for any reason.
-
3. A confirmed case is a patient with a positive COVID-19 infection laboratory test result, regardless of the presence or absence of clinical signs and symptoms.
Data Mining is part of the Knowledge Discovery in Database process, which applies data analysis and algorithms to a pattern. Data mining is a decision-making process from extracting information on a number of data [12]. Data Mining is used to assist the decision-
making process. Important decision making for society, one part of decision making is forecasting. Forecasting is one part of Data Mining [13].
Besides being used for forecasting, data mining is also used in other decision-making processes. Data mining can also be used for classification, clustering, association, and so on. Data mining can be used in various fields in society, such as health, economics, education and others.
Forecasting is a process carried out to predict conditions that will occur in the future [14]. Forecasting is also based on the results of decisions seen from pre-existing data. Forecasting consists of a standard framework and rules that can be explained mathematically. According to Heizer [2005], forecasting is often classified into 3 parts, namely long-term forecasting, medium-term forecasting and long-term forecasting. Short-term forecasting is usually used to predict an event in a matter of days, weeks or months in the future. Mediumterm forecasting has a wider range than the short-term, which is predicting events in the next one to two years and long-term forecasting is forecasting which is done to predict an event that extends beyond the next few years.
Artificial Neural Network is a data processing system that mimics the workings of the human nervous system. The ANN algorithm was born from the ideas of psychologists, Warren McCulloch and Walter Pitts in 1943 who explained how neural networks work with electronic network devices. Artificial Neural Network is a system consisting of many simple processing elements connected in parallel. ANN (Artificial Neural Network) consists of a number of connected units of input (input) and output (output), and in each connection there is a separate weight that can be changed to get the desired prediction results. The layers in ANN are as follows: A. Input Layer: is the layer that connects the data source to the processing network. In that sense, each input will represent independent variables that affect the output. B. Hidden Layer: is a layer of input variables propagation to get the output results that are closer to the desired. An ANN Multi-Layer can have one or more hidden layers. C. Output Layer (Output Layer): is the output of ANN data processing. The output obtained depends on the weight, the number of hidden layers, and the activation function that is set [6].
The results discussed in this forecasting are how the forecasting techniques used in the COVID-19 forecasting process in Bali Province use the Neural Network method.
The preprocessing stage is a dataset of the number of the positive patients, the patients recovered, the patients under treatment and the patients who died were taken by importing data and changing the role of an attribute consisting of date, Denpasar, Badung, Karangasem, Buleleng, Gianyar, Jembrana, Bangli, Tabanan, Klungkung, foreign nationality, other districts and the number becomes a special attribute as the label shown in Figure 4. The results of retrieving the database are then carried out normalization applied to the attribute number, and the attribute value is changed to a range of 0-1 for the binary sigmoid activation function, and -1 to 1 for the bipolar sigmoid activation function.

Figure 4. Retrieve Database Results of the Positive Patients
Modeling results for forecasting COVID-19 in Bali Province can be seen in Figure 5, starting from retrieving the database according to Figure 4 then normalizing it, then optimizing parameters and finally when modeling uses the Neural Network algorithm forecasting method

Figure 5. Retrieve, Normalize and Optimize Parameters
The testing phase carries out training and testing using the Backpropagation Neural Network algorithm. Training and testing data are shared using operator Cross-Validation. The Cross Validation operator in RapidMiner is a nested operator that has two sub-processes: the training sub-process which is used to train the model and the testing sub-process for testing as well as measuring the performance of the model. Consider the process in Figure 6 and Figure 7.
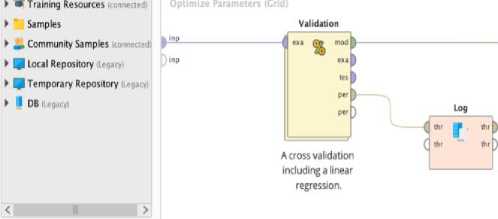
Figure 6. Cross Validation

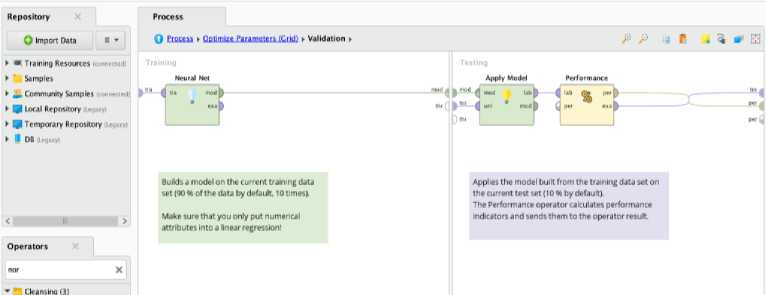
Figure 7. Subprocess on Cross Validation Operators
The testing process as in Figures 7 Sub-Process on the Cross Validation operator, there are several supporting operators as follows:
-
a. Modeling (Neural Network): this model operator applies a Neural Network algorithm with adjusted model attributes.
-
b. Apply Model: This operator will test the result data from the Neural Network operator after that, this model gets predictions on the invisible data or to change the data by applying the preprocessing model. Performance: at the end result of this process performance will display the results. The data resulting from the distribution of each data according to predictions or not to the percentage accuracy of the Neural Network categorization, provides two main results, namely the Neural Network chart and the performance table.
Based on the processing that has been done using the RapidMiner application, it shows results of the positive patients by optimizing the training cycles, operator learning rate parameters and momentum. In the training cycles, you can enter several experimental numbers so that there are 4 parameters and 396 combination options as shown in Figure 8.
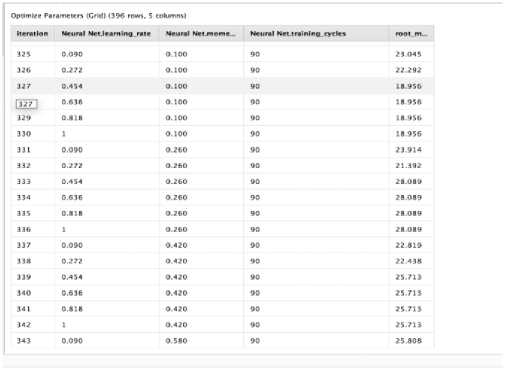
Figure 8. Optimization Parameters with Training Cycles, Learning Rate and Momentum of the Positive Patients
As shown in Figure 8, shows that the smallest RMSE value for the positive patients were 18,956, on training cycles = 90, learning rate = 0.454 and momentum = 0.1.
The calculation above produces the difference value between the number of the positive patients and the prediction number of the positive patients. To facilitate its visualization, the difference in value is shown in the form of a graph where the blue line shows the number of the positive patients, while the green color shows the prediction line of the number of the positive patients. The graph of the difference in the number of the positive and the prediction number of the positive patients which can be seen in Figure 9.
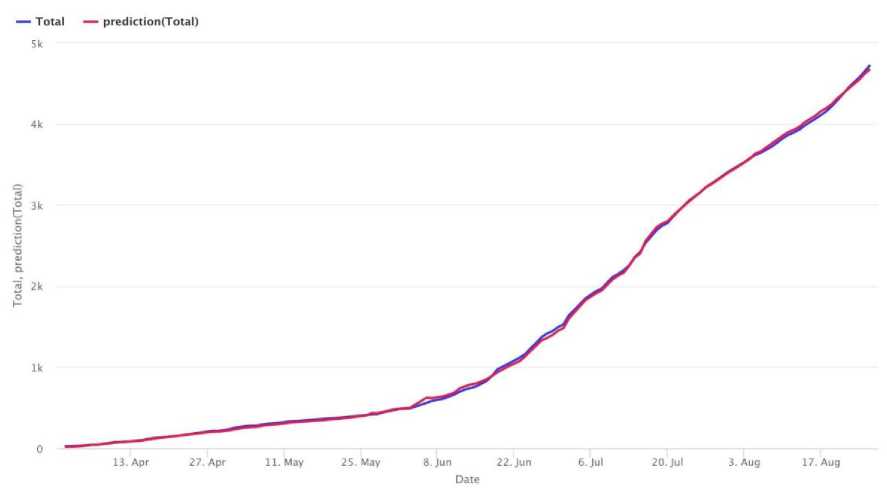
Figure 9. Graph Number of the Positive Patients and Prediction Number of the Positive Patients
Optimize Parameters (Grid) (396 rows, 5 columns)
|
iteration |
Neural Net.learπiπg.r.. |
Neural Net.momentum |
Neural Net.training__. |
ro ot_ m e an _sq u a red... |
|
148 |
0.636 |
0.100 |
41 |
24.536 |
|
149 |
0.8 IB |
0.100 |
41 |
24.536 |
|
150 |
1 |
0.100 |
41 |
24.536 |
|
151 |
0.090 |
0.260 |
41 |
18.043 |
|
152 |
0.272 |
0.260 |
41 |
25.595 |
|
153 |
0-454 |
0-260 |
41 |
25.181 |
|
154 |
0.636 |
0.260 |
41 |
25.181 |
|
155 |
0.818 |
0.260 |
41 |
25.181 |
|
156 |
1 |
0.260 |
41 |
25.181 |
|
157 |
0.090 |
0.420 |
4] |
20.605 |
|
158 |
0.272 |
0.420 |
41 |
24.740 |
|
159 |
0.454 |
0.420 |
41 |
21.007 |
|
160 |
0.636 |
0.420 |
41 |
21.007 |
|
161 |
0.818 |
0.420 |
41 |
21.007 |
|
162 |
1 |
0.420 |
41 |
21.007 |
|
163 |
0.090 |
0.580 |
41 |
18.273 |
|
164 |
___0.272 |
0.580 |
41 |
15.413 |
|
164 I | ||||
|
165 |
0-4 54 |
0.580 |
41 |
15.413 |
|
166 |
0.636 |
0.580 |
41 |
15.413 |
|
167 |
0.81 R |
0 580 |
41 |
15 413 |
Figure 10. Parameter Optimization with Training Cycles, Learning Rate and Momentum of the Patients Recovered
As shown in Figure 10, it shows that the smallest RMSE value for the patients recovered were 15.413, on training cycles = 41, learning Rate = 0.272 and momentum = 0.580.
The calculation above produces the difference value between the number of the patients recovered and the prediction number of the patients recovered. To facilitate its visualization, the difference in value is shown in the form of a graph where the blue line shows the number of the patients recovered, while the green color shows the prediction line the number of the patients recovered. The graph of the difference in the number of the patients recovered and the prediction number of the patients recovered which can be seen in Figure 11.
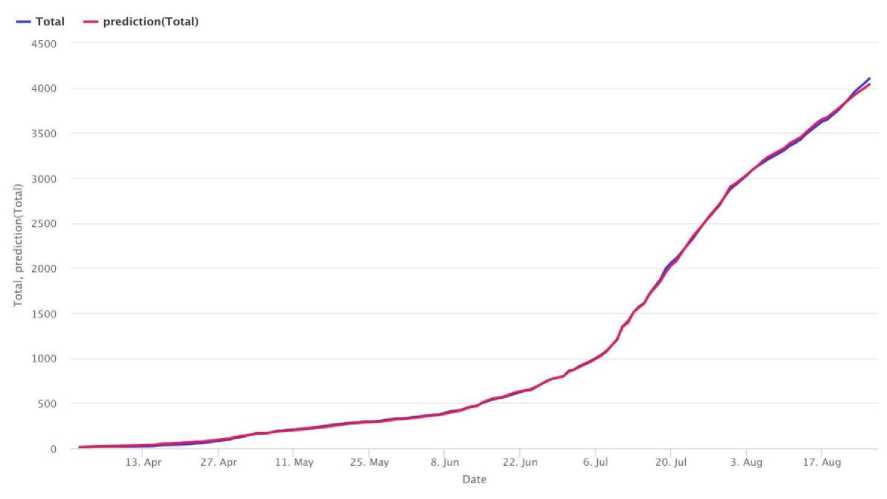
Figure 11. Graph Number of the Patients Recovered and Predictions Number of the Patients Recovered
Opumire Parameteri (Grid) (396 rows, S columns)
|
Iteration |
Neural Neι.learning rate |
Neural Net.momentum |
Neural NeLlraining cycles |
root mean squared... |
|
372 |
1 |
0.260 |
100 |
68.286 |
|
373 |
0.090 |
0.420 |
100 |
5.066 |
|
374 |
0.272 |
0.420 |
100 IlOO I |
5.351 |
|
373 |
0.454 |
0.420 |
100 |
8.020 |
|
376 |
0.636 |
0.420 |
100 |
11.870 |
|
377 |
0.818 |
0.420 |
100 |
31.481 |
|
378 |
1 |
0.420 |
100 |
31.481 |
|
379 |
0.090 |
0.580 |
100 |
4.432 |
|
380 |
0.272 |
0.580 |
100 |
5.419 |
|
381 |
0.454 |
0.580 |
100 |
10.863 |
|
382 |
0 636 |
0.S80 |
100 |
21.731 |
|
383 |
0.818 |
0.580 |
100 |
149.979 |
|
384 |
1 |
0.580 |
100 |
149,979 |
|
385 |
0.090 |
0.740 |
100 |
4.722 |
|
386 |
0.272 |
0.740 |
100 |
7.671 |
|
387 |
0.454 |
0.740 |
100 |
23.000 |
|
388 |
0.636 |
0.740 |
100 |
23.000 |
|
389 |
0.818 |
0.740 |
100 |
23.000 |
|
390 |
1 |
0.740 |
100 |
23.000 |
Figure 12. Parameter Optimization with Training Cycles, Learning Rate and Momentum of the Patients under Treatment
As shown in Figure 12, it shows that the smallest RMSE value for the patients under treatment were 5.066, on training cycles = 100, learning rate = 0.09 and momentum = 0.420.
The calculation above produces the difference value between the number of the patients under treatment and the prediction number of patients under treatment. To facilitate its visualization, the difference in value is shown in the form of a graph where the blue line shows the number of patients under treatment, while the green color shows the prediction line of the number of patients under treatment. The graph of the difference in the number of patients under treatment and the prediction number of patients under treatment which can be seen in Figure 13.
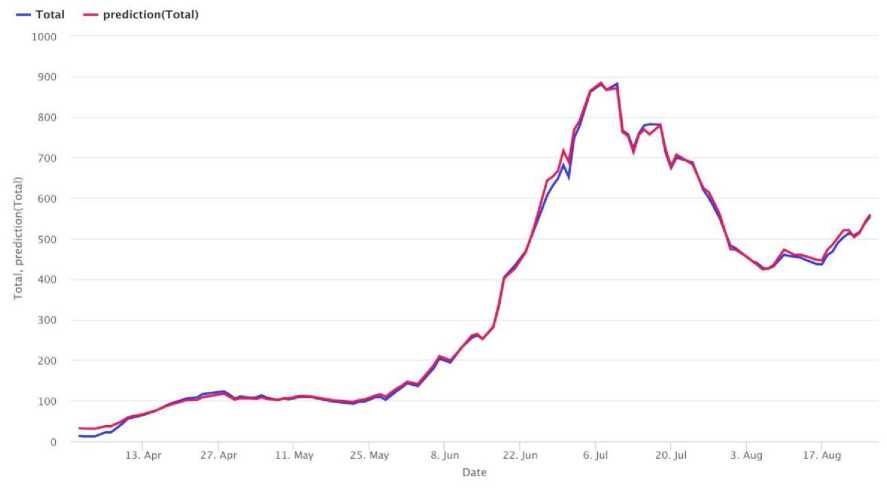
Figure 13. Graph Number of the Patients under Treatment and Prediction Number of the Patients under Treatment
|
Optimize Parameters (Grid) (396 rows, 5 columns) | ||||
|
iteration |
Neural NetJearning rate |
Neural Nermomentum |
Neural Net.training_c_. |
root mean squared_ |
|
338 |
0.272 |
0.420 |
90 |
0.257 |
|
339 |
0.454 |
0.420 |
90 |
0.344 |
|
340 |
0.636 |
0.420 |
90 |
0.344 |
|
341 |
0818 |
0.420 |
90 |
0.344 |
|
342 |
1 |
0.420 |
90 |
0.344 |
|
343 |
0.090 |
0.580 |
90 |
0.264 |
|
344 |
0.272 |
0.580 |
90 |
0.278 |
|
345 |
0.454 |
0.580 |
90 |
0.278 |
|
346 |
0.636 |
0.580 |
90 |
0.278 |
|
347 |
0.818 |
0.580 |
90 |
0.278 |
|
348 |
1 |
0.530 |
90 |
0.278 |
|
349 |
0.090 |
0.740 |
90 |
0.268 |
|
350 |
0.272 |
0.740 |
90 |
0.362 |
|
351 |
0.454 |
0.740 |
90 |
0.362 |
|
352 |
0.636 |
0.740 |
90 |
0.362 |
|
353 |
0.818 |
0.740 |
90 |
0.362 |
|
354 |
1 |
0.740 |
90 |
0.362 |
|
355 |
0.090 |
0.900 |
90 |
0.233 |
|
35® |
0.272 |
0.900 |
90 |
0.233 |
Figure 14. Parameter Optimization with Training Cycles, Learning Rate and Momentum of the Patients who Died
As shown in Figure 14, it shows that the smallest RMSE value for patients who died was 0.233, on training cycles = 90, learning Rate = 0.09 and momentum = 0.9.
The calculation above produces the difference value between the number of the patients who died and the number of prediction patients who died. To make it easier to visualize, the difference in values is shown in the form of a graph where the blue line shows the line of the number of patients who died, while the green color shows the prediction line for the number of the patients who died. The graph of the difference in the number of the patients who died and the prediction of the number of the patients who died which can be seen in Figure 15.
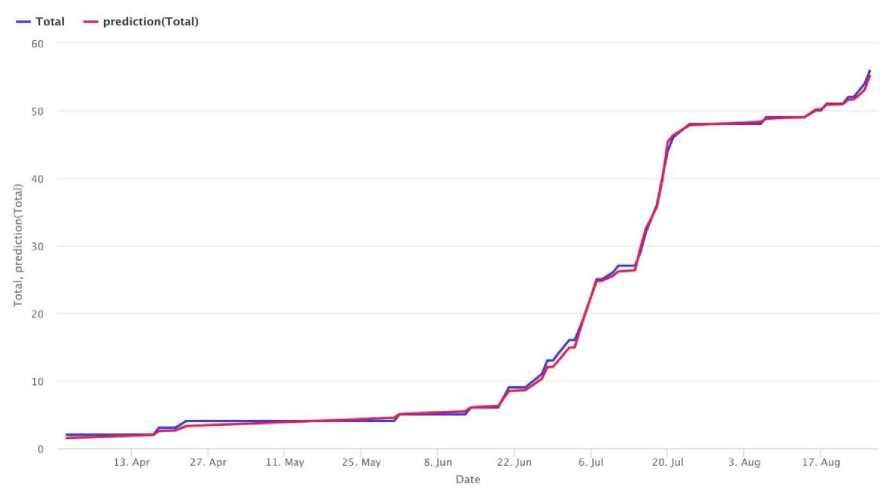
Figure 15. Graph Number of the Patients who Died and the Prediction Number of the Patients who Died
The smallest RMSE (Root Mean Square Error) test results for the positive patients were 18,956, on training cycles = 90, learning rate = 0.454 and momentum = 0.1. The smallest RMSE results for the patients recovered were 15,413, on training cycles = 41, learning rate = 0.272 and momentum = 0.580. The smallest RMSE results for the patients under treatment were 5.066 on training cycles = 100, learning rate = 0.09 and momentum = 0.420 and the smallest RMSE result for the patients who died was 0.233 at training cycles = 90, learning rate = 0.09 and momentum = 0.9. The forecasting results are expected to be useful in anticipating the spread of COVID-19 in the future.
References
-
[1] A. Yurianto, “Pedoman Pencegahan dan Pengendalian Coronavirus Disease (COVID-
19),” Germas, pp. 0–115, 2020.
-
[2] Kemenkes RI, “SE_MENKES_202_2020_protokol_isolasi_diri_COVID.pdf.” pp. 1–4,
2020.
-
[3] M. Maleki, M. R. Mahmoudi, D. Wraith, and K.-H. Pho, “Time seri es modelling to
forecast the confirmed and recovered cases of COVID-19,” Travel Med. Infect. Dis., vol. 37, p. 101742, Sep. 2020, doi: 10.1016/j.tmaid.2020.101742.
-
[4] Z. Ceylan, “Estimation of COVID-19 prevalence in Italy, Spain, and France,” doi:
10.1016/j.scitotenv.2020.138817.
-
[5] H. Putra and N. Ulfa Walmi, “Penerapan Prediksi Produksi Padi Menggunakan Artificial
Neural Network Algoritma Backpropagation,” Jurnal Nasional Teknologi dan Sistem Informasi, vol. 6, no. 2, pp. 100–107, 2020, doi: 10.25077/teknosi.v6i2.2020.100-107.
-
[6] M. Azhar Razak and E. Riksakomara, “Forecasting the Number of Fish Production Using
Backpropagation Neural Network (case study: uptd banjarmasin fisheries port),” Jurnal Teknik ITS, vol. 6, no. 1, pp. 142–148, 2017.
-
[7] I. Halimi and W. A. Kusuma, “Prediksi Indeks Harga Saham Gabungan (IHSG)
Menggunakan Algoritma Neural Network,” Jurnal Edukasi dan Penelitian Informatika, vol. 4, no. 1, p. 24, 2018, doi: 10.26418/jp.v4i1.25384.
-
[8] I. Priyadi, J. Santony, and J. Na’am, “Data Mining Predictive Modeling for Prediction of
Gold Prices Based on Dollar Exchange Rates, Bi Rates and World Crude Oil Prices,” Indonesian Journal of Artificial Intelligence and Data Mining, vol. 2, no. 2, p. 93, 2019, doi: 10.24014/ijaidm.v2i2.6864.
-
[9] A. Peryanto, A. Yudhana, and R. Umar, “Klasifikasi Citra Menggunakan Convolutional
Neural Network dan K Fold Cross Validation,” Journal of Applied Informatics and computing, vol. 4, no. 1, pp. 45–51, 2020, doi: 10.30871/jaic.v4i1.2017.
-
[10] F. Y. H. Ahmed, Y. H. Ali, and S. M. Shamsuddin, “Using K-fold cross validation proposed models for SpikeProp learning enhancements,” International Journal of Engineering & Technology, vol. 7, no. 4, pp. 145–151, 2018, doi:
10.14419/ijet.v7i4.11.20790.
-
[11] World Health Organization, “WHO Interim guidance 20 March 2020 - Global Surveillance for COVID-19 disease caused by human infection with novel coronavirus (COVID-19),” Who, no. January, pp. 1–4, 2020, [Online]. Available: https://www.who.int/publications-detail/global-surveillance-for-human-infection-with-novel-coronavirus-(2019-ncov).
-
[12] A. S. Devi, I. K. G. D. Putra, and I. M. Sukarsa, “Implementasi Metode Clustering DBSCAN pada Proses Pengambilan Keputusan,” Lontar Komputer, vol. 6, no. 3, p. 185, 2015, doi: 10.24843/lkjiti.2015.v06.i03.p05.
-
[13] P. Githa Pratiwi, I. Ketut Gede Darma Putra, and D. Purnami Singgih Putri, “Peramalan Jumlah Tersangka Penyalahgunaan Narkoba Menggunakan Metode Multilayer Perceptron,”Merpati, vol. 7, no. 2, p. 143, 2019, doi: 10.24843/jim.2019.v07.i02.p06.
-
[14] N. Putu, R. Apriyanti, I. K. Gede, D. Putra, and I. M. S. Putra, “Peramalan Jumlah Kecelakaan Lalu Lintas Menggunakan Metode Support Vector Regression,” Merpati, vol. 8, no. 2, pp. 72–80, 2020.
Forecasting Number of COVID-19 in Bali Province Using Neural Network Algorithm
(Ida Ayu Utari Dewi)
83
Discussion and feedback