Strawberry Disease Detection Based on YOLOv8 and K-Fold Cross-Validation
on
JURNAL ILMIAH MERPATI VOL. 11, NO. 3 DECEMBER 2023 p-ISSN: 2252-3006
e-ISSN: 2685-2411
Strawberry Disease Detection Based on YOLOv8 and K-Fold Cross-Validation
I Made Dicky Pranataa1, I Wayan Agus Surya Darmaa2, I Made Subrata Sandhiyasaa3, I Komang Arya Ganda Wigunaa4
aDepartment of Informatics, Institut Bisnis dan Teknologi Indonesia, Indonesia e-mail: 1pranatadicky63@gmail.com, 2surya@instiki.ac.id, 3subrata.sandhiyasa@instiki.ac.id, 4kmaryagw@instiki.ac.id
Abstrak
Penyakit tanaman stroberi dapat dideteksi dari kondisi daun, bunga, dan buah stroberi, namun petani tetap membutuhkan pengetahuan untuk mengidentifikasi jenis penyakit stroberi. Penelitian ini bertujuan untuk mengembangkan model deteksi menggunakan YOLOv8. Model deteksi dilatih menggunakan dataset yang berisi 3.243 citra daun, buah, dan bunga tanaman stroberi, dibagi menjadi tujuh kelas penyakit dan satu kelas tanaman sehat. Penelitian ini bertujuan untuk mengembangkan teknologi deteksi penyakit tanaman stroberi yang lebih efektif. Metode yang diusulkan didasarkan pada YOLOv8 dengan menerapkan K-Fold Cross Validation pada pelatihan model deteksi dan menerapkan albumentasi data untuk menghasilkan model yang robust. Berdasarkan hasil percobaan menunjukkan bahwa model YOLOv8s memperoleh nilai tertinggi pada presisi, recall, F1-score, dan mean average precision masing-masing sebesar 1,00, 0,94, 0,84, dan 0,885.
Kata kunci: Data Albumentations, Detection, K-fold cross-validation, Strawberry diseases, YOLO
Abstract
Strawberry plant diseases can be detected by the condition of the strawberry leaves, flowers, and fruit, but farmers still need knowledge to identify the type of strawberry disease. This study aims to develop a detection model using YOLOv8. The detection model was trained using a dataset containing 3,243 images of strawberry plant leaves, fruit, and flowers, divided into seven disease classes and one healthy plant class. This study aims to develop a more effective strawberry plant disease detection technology. The proposed method is based on YOLOv8 by applying K-Fold Cross Validation to the detection model training and applied data albumentations to produce a robust model. Based on the experimental results, it shows that the YOLOv8s model obtained the highest precision, recall, F1-score, and mean average precision values of 1.00, 0.94, 0.84, and 0.885 respectively.
Keywords: Data Albumentations, Detection, K-fold cross-validation, Strawberry diseases, YOLO
Strawberries belong to the division Spermatophyta, subdivision Angiosperma, class Dicotyledonae, family Rosaceae, genus Fragaria, and species Fragaria spp. Strawberry plants are long, syllabic fruit plants. Although strawberries were not the same as they are now, strawberry plants were known to the Romans long ago. The hybrid of North American Fragaria ananassa and Cabe's Fragaria Chiloensis produced the strawberry plants that we are familiar with today [1]. Several leaf and fruit diseases are the cause of declining strawberry production levels, even pests and diseases are a major problem in the agricultural industry, causing significant losses to food production. Farmers are aware of plants attacked by pests or diseases but sometimes do not know the type of disease [2].
This shows the need for technology to implement an automatic object detection system in detecting diseases in plants to improve the quality and quantity of strawberry production. Object detection is the process of identifying and localizing objects in an image or video using
computer technology and image processing. It involves the use of algorithms and pattern recognition techniques to recognize objects present in visual data, such as images or videos. The object detection process usually involves several steps, such as image or video preprocessing, feature extraction, object classification, and object localization. Various techniques can be used in object detection, such as rule-based detection, feature-based detection, and deep learning-based detection, which uses artificial neural networks to recognize objects in images or videos. Object detection technology continues to evolve and become more sophisticated by using deep learning-based approaches that can produce highly accurate results in detecting objects in visual data [3].
Deep learning is a branch of artificial intelligence that uses neural networks with multiple layers to process and analyze data. Deep learning allows computers to learn autonomously from given data, without having to be given explicit instructions or predefined rules. CNN (Convolutional Neural Network) is a deep learning architecture specifically designed to process image data. One of the main features of CNN is convolution, which is a convolution process where a filter or kernel is applied to the input image data to generate relevant features. These features are then processed through other layers such as activation layers, pooling layers, and fully connected layers to produce a final output that can be interpreted [3].
One of the Deep Learning techniques used to automatically recognize and map objects in images is YOLO. YOLO (You Only Look Once) is a system that can detect an object in realtime [3]. One of the studies conducted by Syahputri et al [4] has proposed disease detection in tomato plant leaves with the YOLOv5 method. The study trained the YOLOv5 model on 780 tomato leaf images which were divided into two types of diseases and resulted in detection performance reaching 97.4%. Widjaja et al [5] proposed a model to determine the type of mango plant using YOLOv4 by training the YOLOv4 model on 457 images and producing 95% accuracy. Based on these studies, the YOLO model can detect objects with high accuracy.
This study aims to build a detection model using the YOLOv8 model trained with a dataset of strawberry plant leaf, fruit, and flower images consisting of 3,046 images divided into seven disease classes and one healthy plant class. The model is expected to help human work in detecting strawberry plant diseases so that it can contribute to the development of more effective strawberry plant disease detection technology. With this disease detection model, it is expected to accelerate the process of identifying diseases in strawberry plants, to increase crop productivity in the agricultural sector and the income of a farmer. In addition, this study can also provide more accurate and effective information about the health condition of strawberry plants. Therefore, this study is expected to have a positive impact on the agricultural and people who depend on strawberry crops.
The construction of this strawberry disease detection model consists of 3 stages. The first stage is data augmentation to build a new synthetic image to provide variations in the strawberry plant disease dataset. Furthermore, the second stage is the training of the YOLOv8 model with its variants, namely YOLOv8n and YOLOv8s. The third stage is data sharing using k-fold cross-validation and the last stage is model performance evaluation which aims to determine the performance of each model and get the best model for strawberry leaf disease detection.

Figure 1. Research Methods
This study uses strawberry disease dataset that consist of 2,958 images. This dataset available Kaggle repository, collected by the members of the AI lab Computer Science and Engineering department, JBNU. This dataset has seven classes of diseases on strawberry plants, i.e., angular leaf spot, anthracnose fruit rot, blossom blight, gray mold, leaf spot, powdery mildew fruit, powdery mildew leaf, and healthy. Figure 2 shows a sample image from the strawberry plant disease dataset.
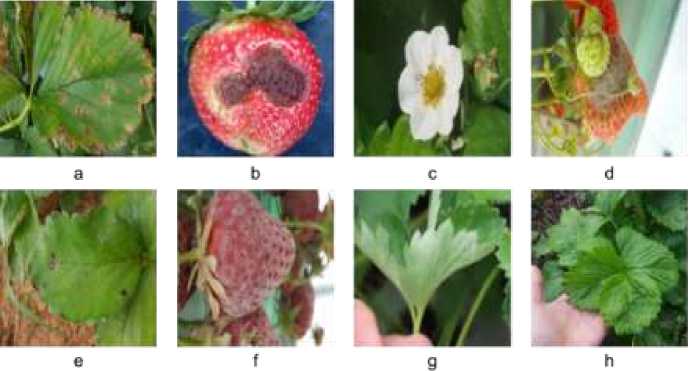
Figure 2. Sample images of strawberry plant diseases from the dataset. (a) angular leaf spot, (b) Anthracnose Fruit Rot, (c) Blosom Blight, (d) Gray Mold, (e) Leaf Spot, (f) Powdery Mildew Fruit, (g) Powdery Mildew Leaf, and (h) Healthy
In this study, we added the healthy leaf class to the dataset, to provide identification if the detected leaf is healthy. This process is done by collecting images of healthy strawberry leaves obtained from strawberry farms in the Bedugul area. We do the data annotation process, by labeling the healthy leaf class using Roboflow tools, so the total image data in this study amounted to 3,046. Table 1 shows the number of images and data classes in this study. In Table 1, the image data in each class is imbalanced, there is a difference in the amount of data in each class, so it becomes a challenge in the process of model training and model testing.
|
Table 1. The number of images per class | |
|
Classes |
#Images |
|
Angular Leafspot |
520 |
|
Anthracnose Fruit Rot |
111 |
|
Blossom Blight |
242 |
|
Gray Mold |
570 |
|
Leaf Spot |
712 |
|
Powdery Mildew Fruit |
160 |
|
Powdery Mildew Leaf |
643 |
|
Healthy |
88 |
Each image is labeled with the type of disease based on the bounding box in the disease area. This dataset consists of more than 4,500 annotations representing seven types of strawberry diseases and 1 healthy strawberry. Figure 3 shows the distribution of the number of labels in the dataset in this study.

Figure 3. The distribution of annotation label on the dataset
Data albumentations is a technique to create new data variations from existing data. This study applied albumentations technique i.e., Blur, MedianBlur, ToGray, and CLAHE. Albumentations is a fast and highly customizable image augmentation Python library that can perform any image transformation [6]. The purpose of performing this technique is to increase the number of images and provide new variations to the dataset. The previous data of 3,046 after the augmentation technique will generates 12,184 images data.
The use of k-fold cross-validation by dividing the data set into five parts, thus dividing the data set into five types of data trained on each model. The purpose of k-fold cross-validation is to reduce bias in evaluating the model and provide a more accurate picture of how well the model can be generalized to new data. This way it can identify whether the model used is overfitting or underfitting, by comparing the k-fold cross-validation results of several models or methods [7]. Figure 4 shows the K-Fold Cross- Validation in this study.

Figure 4. K-Fold Cross-Validation on training process [8]
In the training stage of the YOLO model for disease detection in strawberry plants using 2 variants of the YOLOv8 model. The variation of the YOLOv8 model aims to determine the performance of the model in the detection of strawberry disease types in models with different parameter size variations. The first model training scenario uses the YOLOv8n variant with a parameter size of 3.2 million. This model is a YOLOv8 variant with the smallest parameter size and tends to have a simpler architecture with fewer layers and features. The second training scenario uses the YOLOv8s variant with a parameter size of 28.6 million. This model is a YOLOv8 variant with a medium parameter size can handle more features and has a richer representation than the YOLOv8n variant. Table 2 shows the image size, parameters number, and model complexity comparison of YOLOv8n and YOLOv8s. The YOLOv8n has 3.2 million parameters, much less compared to YOLOv8s. In addition, the complexity model on YOLOv8s reaches 28.7 BFLOPs, larger than YOLOv8n. Pelatihan model menggunakan optimizers AdamW dengan initial learning rate = 0.01. Pelatihan model dilakukan selama 50 epoch untuk setiap fold pelatihan.
Table 2. The size, parameters number, and model complexity comparison of YOLOv8n and
YOLOv8s.
|
Model |
size (pixels) |
params (M) |
FLOPs @640 (B) |
|
YOLOv8n |
416 |
3.2 |
8.7 |
|
YOLOv8s |
416 |
11.2 |
28.6 |
This study will evaluate the performance of the YOLOv8 detection model using a confusion matrix. Confusion matrix is one of the predictive analytic tools that displays and compares the actual value with the predicted value of the model that can be used to generate evaluation metrics such as Accuracy, Precision, Recall, and F1-Score or F-Measure. There are four values generated in the confusion matrix table, including True Positive (TP), False Positive (FP), False Negative (FN), and True Negative (TN) [9]. The following formula is used in calculating the evaluation method is as follows:
recall
TP
TP + FN
(1)
(2)
(3)
. . TP precision----- r TP+FP
i n mAP — ∑ APi
Precision x Recall
F1=2x---~-------
(4)
Precision + Recall
One of the deep learning models for object recognition tasks is called You Only Look Once (YOLO). Numerous research applied YOLO in a various domain. Numerous research in the field of tomato plants have proposed using YOLO to identify various tomato plant disease. Yang et al [10] proposed tomato fruit detection to overcome the low level of automation in tomato harvesting on farms. A dataset of 3,098 images divided into three classes was trained and evaluated using the YOLO8 model which obtained precision, recall, and MAP values of 92.5%, 91.2%, and 91.9%. Further study related to detection has been done. Baihaqi et al [11] proposed a study on the detection of agricultural land affected by rat pests using YOLOv5. The study's findings came from 230 drone-captured picture data sets, which were split up into 200 datasets—20 for model testing and 10 for model validation. The study had an average validation accuracy of 88%.
YOLO has been used extensively in the field of agriculture to identify different kinds of plant diseases. Xiao et al [12] carried out more research on fruit detection to determine the degree of ripeness in the fruit. In order to forecast the fruit class, the suggested model takes visual information from fruit photos and examines the properties of the fruit skin. This work employed two "anchor-free" models, YOLOv8 and CenterNet, that were trained using internal datasets to provide precise predictions. Following a thorough analysis and comparison of the two models, it was discovered that the YOLOv8 model's C2f module greatly enhanced the categorization findings, resulting in an astounding accuracy rate of 99.5%. An enhanced YOLOv8 model was used in a different investigation by Wang et al. [13] to identify the disease. The dataset, which includes samples of PWD-infected trees at intermediate and late stages, was collected in Weihai City, China. Based on the evaluation metrics of mAP50, mAP50-95, the modified YOLOv8s-GAM model obtained optimum detection performance of 81%, 67.2%, and 76.4%, which were 4.5%, 4.5%, and 2.7% greater than the original YOLOv8s model, according to the experimental data. A YOLOv5-based flaw detection model was created by Yao et al. [14] for kiwifruit post-harvest reprocessing. The experimental findings demonstrate that YOLOv5-Ours, the enhanced network, outperforms the original and widely used detection methods in terms of overall performance. The mAP@0.5 of YOLOv5-Ours is 94.7%, an improvement over the original algorithm by over 9%. The efficiency of this model is shown by the fact that it only requires 0.1 seconds to identify a single image. The use of convolutional neural networks (CNNs), a kind of deep learning algorithm, for early pest identification in agriculture was suggested by Khalid et al. [15]. There are 9875 photos of every pest in the input dataset, all of them under different lighting settings. This research used the Yolo v3, Yolov3-Tiny, Yolov4, Yolov4-Tiny, Yolov6, and Yolov8 models for detection. With an average loss of 0.7939, Yolov8 earned the greatest mAP of 84.7%, which compares well with the findings of earlier research on tiny pest detection.
In the traffic domain, related study was proposed by Mulyana et al. [16] brought up the subject of adopting real-time detection of vehicle type categorization in Indonesia and suggested related research in the traffic domain. The YOLOv5 technique is used in this research to identify the kind of car on the roadway. 1332 photos from the Bajaj, Becak, bus, automobile, molen vehicle, pickup car, bicycle, motorbike, and truck classes make up the dataset that was utilized. With an accuracy of 90%, the validation accuracy is rather good. Wang et al [17] used the BL-YOLOv8 detection technique, which is based on YOLOv8s, to identify flaws in roadways. The YOLOv8s model was improved in this work by integrating the BiFPN approach and recreating its neck structure. The upgraded YOLOv8s algorithm's ability to identify road faults is confirmed by the testing findings. The average accuracy of mAP@0.5 is 3.3% higher than that of the original model. Furthermore, there is a loss of 11.45% and a fall of 29.92% in parameter volume. A reliable real-time helmet violation detection system is proposed by Aboah et al. [18]. The proposed approach detects helmet infractions in real-time from video frames by using a single-stage object detection model, YOLOv8, and a novel data processing technique known as few-shot data sampling to create a robust model with fewer annotations. In Track 5 of AI City Challenge 2023, the suggested approach placed seventh with a mAP score of 0.5861 based on experimental validation data. Using YOLOv8 object identification method on
urban road images, Saluky et al. [19] proposed a pothole detection strategy for urban roadways. uses transfer learning to train the model on a dataset of pothole-filled urban road photos. After being tested on a test set, the model's average pothole detection accuracy and recall were 0.92 and 0.89, respectively. The YOLOv8 algorithm was used by Patel et al. [20] to identify safety helmets. The YOLO V8 algorithm is trained on an image dataset that includes workers wearing and not wearing safety helmets as part of the suggested system. The experimental findings demonstrate that the suggested method, with an average precision of 0.99 and recall of 0.99, provides excellent accuracy in safety helmet detection. An Automatic License Plate Recognition (ALPR) system using YOLOv8 and Optical Character Recognition (OCR) was suggested by Fakhrurroja et al. [21]. Character recognition is 66% and license plate identification is 100% successful out of 50 picture samples.
YOLO has been applied in various domains. In the domain of cultural objects, Darma et al [22] proposed the detection of Balinese carving motifs using the YOLOv5 method. The dataset tested in this study amounted to 8,817 images of Balinese carving motifs divided into seven classes. The experimental results show that the detection of Balinese carvings using the YOLOv5 method shows good performance with an average precision value of 98%. YOLO has also been widely applied in various other domains to detect objects. Iskandar Mulyana et al [23] proposed sign language detection in the recognition of hijaiyah letters with the YOLOv5 method. This study uses a dataset of 1014 images with hijaiyah letter classes from alif to yes. The results show an accuracy value of 0.95 which means close to 1, which is around 95%, where in that accuracy the object can be detected properly. The application of the YOLOv8 model for real-time weapon identification to identify illegal activity in public spaces was suggested by Pullakandam et al. [9] The effectiveness of the YOLOv8 and YOLOv5 models for weapon detection was assessed in the studies. YOLOv8 yielded a Mean Average Precision (mAP) value of 90.1%, surpassing the mAP value of 89.1% attained with YOLOv5. Furthermore, a 15% reduction in inference time was achieved by effectively implementing weight quantization to the YOLOv8 model in comparison to its initial setup. A technique based on YOLOv5 was presented by Cengil et al. [24] to locate cats and dogs using the YOLOv5 algorithm with various settings. The experimental findings demonstrated that the YOLOv5 model completed the task successfully. The mAP value of YOLOv5l reached 94.1, showing the effectiveness of YOLOv5-based cat/dog detection. A technique for detecting gas cylinders using the YOLOv5 approach was suggested by Albayrak et al. [25] A dataset of several kinds of cylinders seen at gas filling stations was produced as part of this research. Based on the collected data, the YOLOv5 algorithm has a high success rate of 96.16% in detecting gas cylinders with different color and form attributes.
The training and evaluation of the detection models using NVIDIA Tesla T4 with 15GB memory on YOLOv8n and YOLOv8s models. The strawberry disease detection model uses a k-fold cross-validation strategy in model training.
This YOLOV8n model training is done by dividing the data of each class from the combined training and validation image data which will be 5-fold. Each fold will contain 464 image data which means the entire amount of data is 2320 images. in fold-1 will be validation data while folds 2-5 will be training data, so the amount of data in training is 1856 images and validation 464 image data. Furthermore, fold-2 will be validation data fold 1,3,4,5 will be training data, and so on up to fold-5. Training each fold in this model uses the AdamW optimizer and each fold will be trained on 50 epochs. Table 3. Evaluation of Detection model based on YOLOv8n.
Table 3. Evaluation of Detection model based on YOLOv8n
|
K-Fold |
Precision |
Recall |
F1 |
Mean Average Precision |
|
Fold-1 |
1.00 |
0.86 |
0.69 |
0.737 |
|
Fold-2 |
1.00 |
0.92 |
0.75 |
0.780 |
|
Fold-3 |
1.00 |
0.95 |
0.80 |
0.846 |
|
Fold-4 |
1.00 |
0.93 |
0.81 |
0.854 |
Fold-5 1.00 0.95 0.84 0.878
Based on the results of fold training on the YOLOv8 model, the highest results are obtained in fold-5 with a mAP value of 0.885. Table 4 shows the precision, recall, F1, and mean average precision values for each class in fold-5 training. The model performance in each class shows that the YOLOv8n model produces low performance in the Powdery Mildew Fruit class. This result is due to the Powdery Mildew Fruit class is similar to Anthracnose Fruit Rot and Gray Mold. In addition, the number of images in the Powdery Mildew Fruit class is very small.
Table 4. The YOLOv8n precision per class on fold-5
|
Class |
Precision |
|
Angular Leaf Spot |
0.924 |
|
Anthracnose Fruit Rot |
0.855 |
|
Blossom Blight |
0.995 |
|
Gray Mold |
0.994 |
|
Leaf Spot |
0.895 |
|
Powdery Mildew Fruit |
0.549 |
|
Powdery Mildew Leaf |
0.864 |
|
Healthy |
0.995 |
In training the YOLO8s model is the same as the YOLOV8n model, which divides the data into 5-folds using the AdamW optimizer, and each fold is trained up to 50 epochs. Based on the results of the YOLOv8s model training on each fold, the highest value is obtained on fold-4 with a precision value of 1.00, recall 0.94, F1 0.84, and mAP 0.885. Table 5. Evaluation of Detection model based on YOLOv8s.
|
Table 5. Evaluation of Detection model based on YOLOv8s | |
|
K-Fold |
n ■ ■ n Mean Average Precision Recall F1 ean verage Precision |
|
Fold-1 Fold-2 Fold-3 Fold-4 Fold-5 |
1.00 0.84 0.71 0.752 1.00 0.91 0.74 0.776 1.00 0.92 0.83 0.855 1.00 0.94 0.84 0.885 1.00 0.93 0.85 0.880 |
Table 6 shows the YOLOv8s precision per class on fold-4. Based on this result, the model can detect strawberry disease types well based on test data. However, in the Powdery Mildew Fruit class, the model shows quite low performance, with a precision of 0.625, because this type of disease attacks the fruit, which is quite difficult to recognize. However, the model can detect this type of disease. Overall, the model can detect almost all disease classes well with a precision of 0.995. The model performance in each class shows that the YOLOv8s model also produces low performance in the Powdery Mildew Fruit class, the same as YOLOv8n, but with slightly better precision.
Table 6. The YOLOv8s precision per class on fold-4
|
Class |
Precision |
|
Angular Leaf Spot Anthracnose Fruit Rot |
0.912 0.814 |
|
Blossom Blight Gray Mold |
0.995 0.941 |
|
Leaf Spot |
0.886 |
|
Powdery Mildew Fruit |
0.625 |
|
Powdery Mildew Leaf |
0.872 |
|
Healthy |
0.995 |
Based on the results of the two YOLOv8 models that have been tested, the best results of each fold in one model are obtained. Table 7 shows a comparison of the best fold of the two YOLOv8 models. The YOLOv8s outperformed the YOLOv8n by Mean Average Precision of 0.885. The performance of both model is quite similar in detecting types of strawberry plant diseases. These results demonstrated that the proposed model could detect strawberry disease types well.
Table 7. Comparison of the best fold of the two YOLOv8 models
Figure 5 shows the model evaluation on training process. We evaluated the training process based on box loss, class loss, dfl loss, precision, and recall on the best model on each scenario. Both models show good performance on training based on the convergence of each graph.

|
Model |
Precision |
Recall |
F1 |
Mean Average Precision |
|
YOLOv8n (Fold- 5) YOLOv8s (Fold-4) |
1.00 |
0.95 |
0.84 |
0.878 |
|
1.00 |
0.94 |
0.84 |
0.885 |
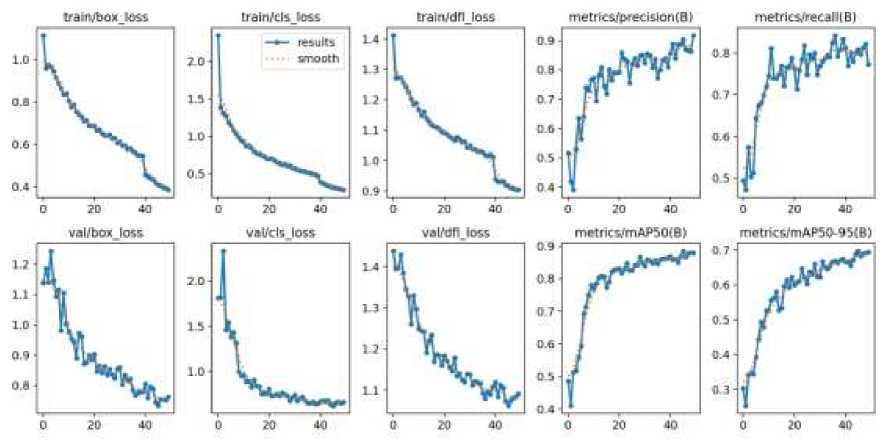
(b)
Figure 5. Training Graph on two best model: (a) YOLOv8n, (b) YOLOv8s
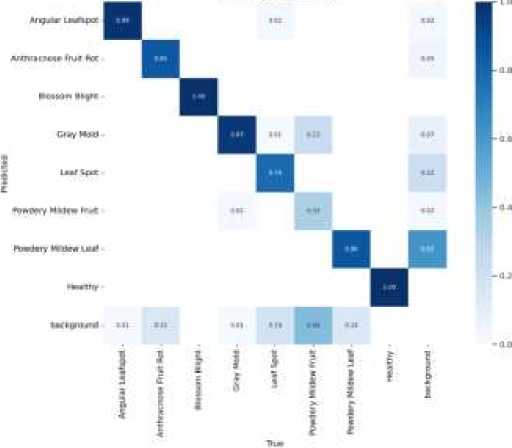
Figure 6(a) shows the confusion matrix of YOLOv8n on fold-5, where the value of the confusion matrix shows that the Angular Leaf Spot class (1) produces a precision value of 0.99, the Anthracnose Fruit Rot class (2) produces a precision value of 0.85, the Blossom Blight class (3) produces a precision value of 1.00, Gray Mold class (4) produces a precision value of 0.97, Leaf Spot class (5) produces a precision value of 0.78, Powdery Mildew Fruit class (6) produces a precision value of 0.86, Powdery Mildew Leaf class (7) produces a precision value of 0.86, Healthy class (8) produces a precision value of 1.00.
Figure 6(b) is the confusion matrix of YOLOv8s on fold-4, where the results of the value of the confusion matrix show that the Angular Leaf Spot class (1) produces a precision value of 1.00, the Anthracnose Fruit Rot class (2) produces a precision value of 0.81, the Blossom Blight class (3) produces a value of precision 1.00, Gray Mold class (4) produces a precision value of 0.89, Leaf Spot class (5) produces a precision value of 0.81, Powdery Mildew Fruit class (6) produces a precision value of 0.46, Powdery Mildew Leaf class (7) produces a precision value of 0.84, Healthy class (8) produces a precision value of 1.00.
CCfArtMOMMiii Htrntfittd
(a)

(b)
Figure 6. The Comparison of the confusion matrix. (a) YOLOv8n fold-5, (b) YOLOv8s fold-4
Based on the experiments, the detection of strawberry plant diseases using the YOLOv8 model with 2 different model variations achieved a high value. The training process utilized the albumentations augmentation technique and K-Fold Cross Validation by deviding data into 5-fold for training and validation data. In the training process, we applied AdamW optimizers for each fold trained up to 50 epochs. The model evaluation results shows that the YOLOv8s model on fold-4 produces higher performance outperformed the YOLOv8n model with a precision value of 1.00, recall 0.94, F1 0.84, and Mean Average Precision 0.885, respectively.
Reference
-
[1] D. E. Kusumandari, M. Adzkia, S. P. Gultom, M. Turnip, and A. Turnip, “Detection of Strawberry Plant Disease Based on Leaf Spot Using Color Segmentation,” in Journal of Physics: Conference Series, Institute of Physics Publishing, Sep. 2019. doi: 10.1088/17426596/1230/1/012092.
-
[2] C. Oktavia, A. Voutama, and B. A. Dermawan, “Sistem Pakar Diagnosis Hama Dan Penyakit Tanaman Stroberi Dengan Metode Certainty Factor Berbasis Web,” Jurnal Ilmiah Wahana Pendidikan, vol. 8, no. 15, pp. 117–127, 2022, doi: 10.5281/zenodo.7040696.
-
[3] Z. Munawar, M. Hasnawi, and I. Beno, “V i s i K o m p u t e r,” 2023.
-
[4] Syahputri and Indah, “Deteksi Penyakit pada Daun Tanaman Tomat dengan Metode You Only Look Once Versi 5 (YOLOV5),” repositori.usu.ac.id. Accessed: Jun. 07, 2023.
[Online]. Available: https://repositori.usu.ac.id/handle/123456789/73380
-
[5] P. A. Widjaja and J. R. Leonesta, “Determining Mango Plant Types Using YOLOv4,” Formosa Journal of Science and Technology, vol. 1, no. 8, pp. 1143–1150, Dec. 2022, doi: 10.55927/fjst.v1i8.2155.
-
[6] Alexander Buslaev, Alex Parinov, Vladimir Iglovikov, Evegene Khvedchenya, and Mikhail Druzhinin, “Albumentations,” albumentations.ai. Accessed: Nov. 14, 2023. [Online].
Available: https://albumentations.ai/docs/
-
[7] I. W. A. S. Darma, N. Suciati, and D. Siahaan, “GFF-CARVING: Graph Feature Fusion for the Recognition of Highly Varying and Complex Balinese Carving Motifs,” IEEE Access, vol. 10, pp. 129217–129230, 2022, doi: 10.1109/ACCESS.2022.3228382.
-
[8] Y. N. FUADAH, I. D. UBAIDULLAH, N. IBRAHIM, F. F. TALININGSING, N. K. SY, and M. A. PRAMUDITHO, “Optimasi Convolutional Neural Network dan K-Fold Cross Validation pada Sistem Klasifikasi Glaukoma,” ELKOMIKA: Jurnal Teknik Energi Elektrik, Teknik Telekomunikasi, & Teknik Elektronika, vol. 10, no. 3, p. 728, Jul. 2022, doi: 10.26760/elkomika.v10i3.728.
-
[9] L. Afifah, “Apa itu Confusion Matrix di Machine Learning?,” ilmudatapy.com. Accessed: May 23, 2023. [Online]. Available: https://ilmudatapy.com/apa-itu-confusion-matrix/
-
[10] G. Yang, J. Wang, Z. Nie, H. Yang, and S. Yu, “A Lightweight YOLOv8 Tomato Detection Algorithm Combining Feature Enhancement and Attention,” Agronomy, vol. 13, no. 7, p. 1824, Jul. 2023, doi: 10.3390/agronomy13071824.
-
[11] K. A. Baihaqi and C. Zonyfar, “Deteksi Lahan Pertanian Yang Terdampak Hama Tikus Menggunakan Yolo v5,” 2022.
-
[12] B. Xiao, M. Nguyen, and W. Q. Yan, “Fruit ripeness identification using YOLOv8 model,” Multimed Tools Appl, 2023, doi: 10.1007/s11042-023-16570-9.
-
[13] S. Wang et al., “Detection of Pine Wilt Disease Using Drone Remote Sensing Imagery and Improved YOLOv8 Algorithm: A Case Study in Weihai, China,” Forests, vol. 14, no. 10, Oct. 2023, doi: 10.3390/f14102052.
-
[14] J. Yao, J. Qi, J. Zhang, H. Shao, J. Yang, and X. Li, “A real-time detection algorithm for kiwifruit defects based on yolov5,” Electronics (Switzerland), vol. 10, no. 14, Jul. 2021, doi: 10.3390/electronics10141711.
-
[15] S. Khalid, H. M. Oqaibi, M. Aqib, and Y. Hafeez, “Small Pests Detection in Field Crops Using Deep Learning Object Detection,” Sustainability (Switzerland), vol. 15, no. 8, Apr. 2023, doi: 10.3390/su15086815.
-
[16] D. I. Mulyana and M. A. Rofik, “Implementasi Deteksi Real Time Klasifikasi Jenis Kendaraan Di Indonesia Menggunakan Metode YOLOV5,” 2022.
-
[17] X. Wang, H. Gao, Z. Jia, and Z. Li, “BL-YOLOv8: An Improved Road Defect Detection
Model Based on YOLOv8,” Sensors (Basel), vol. 23, no. 20, Oct. 2023, doi:
10.3390/s23208361.
-
[18] A. Aboah, B. Wang, U. Bagci, and Y. Adu-Gyamfi, “Real-time Multi-Class Helmet Violation Detection Using Few-Shot Data Sampling Technique and YOLOv8,” 2023. [Online]. Available: https://github.com/aboah1994/few-shot-
-
[19] Saluky, Y. Marine, A. Zaeni, A. Yuliati, O. R. Riyanto, and N. Bahiyah, “Pothole Detection on Urban Roads Using YOLOv8,” in 2023 10th International Conference on ICT for Smart Society (ICISS), 2023, pp. 1–6. doi: 10.1109/ICISS59129.2023.10291192.
-
[20] K. Patel, V. Patel, V. Prajapati, D. Chauhan, A. Haji, and S. Degadwala, “Safety Helmet Detection Using YOLO V8,” in 2023 3rd International Conference on Pervasive Computing and Social Networking (ICPCSN), 2023, pp. 22–26. doi:
10.1109/ICPCSN58827.2023.00012.
-
[21] H. Fakhrurroja, D. Pramesti, A. R. Hidayatullah, A. A. Fashihullisan, H. Bangkit, and N. Ismail, “Automated License Plate Detection and Recognition using YOLOv8 and OCR With Tello Drone Camera,” in 2023 International Conference on Computer, Control, Informatics and its Applications (IC3INA), 2023, pp. 206–211. doi:
10.1109/IC3INA60834.2023.10285750.
-
[22] I. W. A. S. Darma, N. Suciati, and D. Siahaan, “CARVING-DETC: A network scaling and NMS ensemble for Balinese carving motif detection method,” Visual Informatics, Jun. 2023, doi: 10.1016/j.visinf.2023.05.004.
-
[23] D. Iskandar Mulyana, M. Faizal Lazuardi, and M. Betty Yel, “Deteksi Bahasa Isyarat Dalam Pengenalan Huruf Hijaiyah Dengan Metode YOLOV5,” 2022, doi:
10.32528/elkom.v4i2.8145.
-
[24] E. Cengil, A. Çinar, and M. Yildirim, “A Case Study: Cat-Dog Face Detector Based on YOLOv5,” in 2021 International Conference on Innovation and Intelligence for Informatics, Computing, and Technologies (3ICT), 2021, pp. 149–153. doi:
10.1109/3ICT53449.2021.9581987.
-
[25] A. Albayrak and M. S. Özerdem, “Gas Cylinder Detection Using Deep Learning Based YOLOv5 Object Detection Method,” in 2022 7th International Conference on Computer Science and Engineering (UBMK), 2022, pp. 434–437. doi:
10.1109/UBMK55850.2022.9919478.
Strawberry Disease Detection Based on YOLOv8 and K-Fold Cross-Validation (I Made Dicky 210
Pranata)
Discussion and feedback