Medical Costs Estimation Using Linear Regression Method
on
JURNAL ILMIAH MERPATI VOL. 11, NO. 3 DECEMBER 2023
p-ISSN: 2252-3006
e-ISSN: 2685-2411
Medical Costs Estimation Using Linear Regression Method
Ni Made Dita Dwikasaria1, Ni Putu Sutramiania2, Komang Sri Yanisa Putria3, Nyoman Tri Rahaditya Kusumaa4, Made Dimas Aldi Dwi Pramanaa5, I Wayan Agus Surya Darmab1 aDepartment of Information Technology, Faculty of Engineering, Universitas Udayana, Bukit Jimbaran, Bali, Indonesia
bDepartment of Informatics, Faculty of Technology and Informatics, Institut Bisnis dan Teknologi Indonesia,
Denpasar, Bali, Indonesia e-mail: a1dita.dwikasari08@student.unud.ac.id, a2*sutramiani@unud.ac.id, a3sri.yanisa121@student.unud.ac.id, a4tri.rahaditya109@student.unud.ac.id, a5madedimasaldi02@gmail.com, b1surya@instiki.ac.id
Abstrak
Biaya perawatan medis merupakan isu yang signifikan dalam sektor kesehatan. Biaya kesehatan yang tinggi menciptakan kebutuhan untuk mengantisipasi risiko keuangan bagi individu dan penyedia asuransi. Oleh karena itu, analisis data biaya pengobatan diperlukan untuk memperkirakan pengeluaran medis di masa depan. Penelitian ini mengimplementasikan teknik data mining dengan metode Simple dan Multiple Linear Regression untuk melakukan estimasi biaya pengobatan dengan menggunakan data klaim asuransi dari Kaggle yang mencakup atribut-atribut seperti usia, jenis kelamin, indeks massa tubuh, jumlah anak, kebiasaan merokok, wilayah tempat tinggal, serta biaya medis. Hasil penelitian menunjukkan bahwa Multiple Linear Regression memiliki peforma yang lebih baik untuk melakukan estimasi pada dataset yang digunakan, dengan nilai R2 sebesar 80%, serta nilai MSE dan MAE yang lebih rendah dibandingkan Simple Linear Regression. Secara keseluruhan, penelitian ini menunjukkan bahwa data mining dengan menggunakan metode regresi linear merupakan pendekatan yang efektif untuk melakukan estimasi biaya pengobatan.
Kata kunci: Biaya Pengobatan, Data Mining, Estimasi, Regresi Linear
Abstract
Medical costs are a significant issue in the health sector. High healthcare cost lead to the need to anticipate financial risks for individuals and insurance providers. Therefore, medical cost data analysis is necessary to estimate future medical expenses. This research implements data mining techniques using Simple and Multiple Linear Regression methods to estimate medical costs. The dataset used consists of insurance claim data obtained from Kaggle, which includes attributes such as age, gender, body mass index, number of children, smoking habits, region, and medical charges. The research findings that Multiple Linear Regression outperforms Simple Linear Regression in estimating the provided dataset, with R2 value of 80% and lower MSE and MAE values than Simple Linear Regression. Overall, this research highlights the effectiveness of data mining techniques, specifically linear regression, in estimating healthcare costs.
Keywords : Medical Costs, Data Mining, Estimation, Linear Regression
Medical costs are a significant problem in the health sector. High medical costs lead to the need to anticipate financial risks, both for individuals or insurance providers. This can be a heavy burden for patients and their families, especially if they do not have insurance or the insurance does not cover all of the medical expenses. Knowing the possibility of future health-related expenses can help patients to choose the appropriate insurance and premium plans [1]. On the other hand, for hospitals and insurance companies, high medical costs can also be a heavy burden in planning budgets and determine the right insurance premiums. [2]. Therefore, it
is necessary to analyze health-related insurance cost data to estimate future medical costs more accurately.
To answer this problem, this study used insurance claim data available through external sources such as Kaggle. This dataset includes attributes such as age, gender, body mass index (BMI), number of children, smoking habits, region, and medical charges. These attributes provide essential information needed to analyze and predict medical costs. By using data mining techniques, it is possible to analyze the data that has been collected to identify patterns or information that is useful in predicting the medical cost in hospitals.
Several previous studies have applied data mining techniques such as Linear Regression [3], Generalized Linear Models (GLM) [4], Random Forest [5], Support Vector Machine [6] and Neural Network (NN) [7] algorithms to make an estimates. The linear regression method can be used to estimate in various fields, such as estimating software development costs [8], health benefit costs for outpatient treatment of employees [9], motorcycle sales [10], and estimating the availability of landfills [11]. In estimating software development costs, it shows that the linear regression model yielded a R2 value of 0.9476 and has a smaller MMRE value compared to other methods in previous research [8]. The Linear Regression Algorithm also shows good performance in research on social media ads data insights to estimate ad duration. The Linear Regression Algorithm yields a RMSE (Root Mean Square Error) evaluation value of 1,690, which is better than Neural Networks, Support Vector Machines, Generalized Models and Deep Learning. [12]. It appears that you are debating a research that compares different approaches and performance measures in the field of medical cost estimation. XGBoost, Decision Tree, Random Forest Regressor, Multiple Linear Regression, Support Vector Regression, Ridge Regressor, Stochastic Gradient Boosting, and k-Nearest Neighbors were among the techniques assessed in the study. Based on the presented data, Linear Regression yielded an accuracy of 74% and a Root Mean Square Error (RMSE) score of 0.479808. [13].
This study estimates medical costs using a linear regression method. Linear regression is a statistical technique used to model the linear relationship between the dependent variable and the related independent variables [14]. By applying linear regression, models are expected to be developed that can describe the mathematical relationship between variables such as age, gender, body mass index (BMI), number of children, smoking habits, and region as well as predicting medical expenses with a high degree of accuracy. This approach is based on the assumption that the relationship between the dependent and independent variables is linear, and by using linear regression techniques, the best regression line that represents the relationship pattern can be found. Therefore, this article aims to apply the data mining method using linear regression in estimating medical costs.
Research on estimating medical costs using linear regression method consists several stages start with performing data preprocessing, then dividing the dataset into train data and test data, creating the linear regression model, and performing evaluation to know the performance of the model. The stages carried out in this study are described in the flow shown in Figure 1.
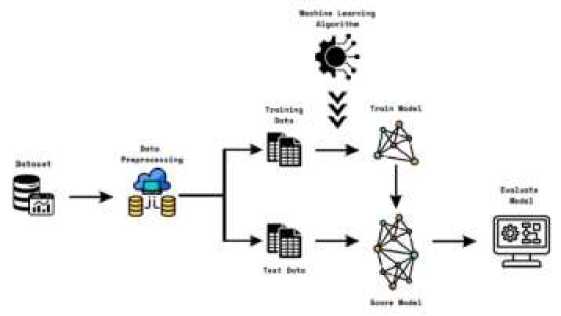
Figure 1. Research Methodology
The data set used in this study is a health insurance claims dataset obtained from the Kaggle with a total of 1338 data with 7 attributes that are interconnected with one another.
The dataset that has been obtained will be pre-processed before being analyzed with the model. In this stage, pre-processing data is performed by converting categorical data into numerical data so that it can make correlations of all the attributes in the dataset.
In this process, data analysis is carried out before moving to the modeling phase. This stage aims to understand the distribution of existing data in the dataset and see the correlation between existing attributes. After preprocessing to convert categorical data into numeric data, then from this data we will be able to see correlations between columns before proceeding to modeling.
In this study, the dataset will be divided into 80% for training data and 20% for testing data. The value of the dependent variable is determined by applying a certain algorithm to the training set. Then, the algorithm that has been trained using the training data will be used to predict the value of the dependent variable in the testing data using the existing independent variables. The prediction results of the dependent variable will be compared with the original values from the testing data, and which has the minimum error is selected as the estimation results.
Simple linear regression is a simple straight line model that connects an independent variable (X) with the dependent variable (Y)[15]. Therefore, this model can be explained using the mathematical equation of straight lines as in the equation 1.
Y = B0 +B1X1 (1)
Referring to the equation 1, B0 or intercept is the point on the y-axis that is passed by the line, whereas B1or the slope is the change in the number on the y-axis for every change of 1 unit on the x-axis. To take into account variability or uncertainty that cannot be described by an independent variables, error term (ε) is added, so that the linear regression equation can be written as follows on equation 2.
Y = B0+ B1X+ ε, (2)
In the estimation model of medical expenses using simple linear regression, variable Y represents medical expenses (charges) and X is age (age). The intercept ( ) value is an
estimated of charges when the patient's age is 0, the slope (B1) shows the average change in the charges for each additional 1 year of age. Using the given age value (X), it is possible to calculate the estimated cost of treatment based on the linear relationship between age and medical costs.
Multiple Linear Regressions is a regression method that uses more than one independent variable[16]. Multiple linear regression equations are used in combination in the following equation 3.
Y = B0 + bixi + b2 X2 +----+ BnXn> (3)
Referring to the equation 3, in the medical cost estimation model with multiple linear regression, variable Y represents medical charges, while the dependent variable consists age, sex, BMI, children, smokers, and region. The model formed then used to estimate medical costs
and understand the relative contribution of each independent variable to medical costs. The estimation results obtained are then presented in a scatter plot, which provides a visual picture of the relationship between charges and the independent variables.
The estimation results in this study evaluated using R-Squared (R2), Mean Absolute Error (MAE), and Mean Squared Error (MSE) to measure the success of the simple and multiple linear regression models in estimating medical costs. R2 is used to measure the extent to which variations in the dependent variable (medical costs) can be explained by the independent variables in the model. Meanwhile, the Mean Absolute Error (MAE) and Mean Squared Error (MSE) describe the difference between the predicted value and the actual value of medical expenses. These three methods can be explained by the following formula in equations 4, 5 and 6.
∑(y-y)2
(4)
(5)
(6)
∑(yl-y)2
MSE =
n ∑(yi-yi)2
n
The equations 4, 5 and 6 are the equations used to evaluate the estimation results of the linear regression model. yl is the actual value of the dependent variable used in the calculation process at time i, y is the predicted value of the dependent variable given by the linear regression model, y is the average value of the dependent variable in the dataset, while n is the number of observations in the dataset.
The Affordable Care Act (ACA) of 2010, which altered the markets and plans for health insurance that impact the great majority of American individuals and families, has made health insurance a topic of discussion. To improve access to care, millions of Americans—many of whom were previously uninsured—are anticipated to sign up for health insurance programs. Benefits for those who already own insurance will alter (Patient Protection & Affordable Care Act, 2010)[17].
The imbalance of life and challenges to health problems cause individuals to need to prepare early to ensure they get the opportunity to get the best health services. There are still some people who are still not aware that health and medical insurance is a policy that covers private medical care costs which may be expensive such as hospitalization and surgery costs. Through medical health insurance, treatment costs and other medical expenses due to disability and chronic illness will be transferred to the insurance company.
Extensive datasets are analyzed using data mining to find patterns and correlations that may be used to solve problems. It's a branch of science where knowledge found in data is explored. Through this method, businesses may improve their decision-making and forecast future trends. Finding patterns, anomalies, and correlations using data mining enables the creation of useful insights. Data collection, which is the first step in the process, involves gathering and organizing relevant information. Data quality is ensured by data preparation, which includes procedures like data pre-processing and cleaning. Before examining the complete dataset, some algorithms are run over sample data. After that, the data is evaluated and processed to produce analytical models that will guide future company choices. Tasks like estimate, prediction, classification, grouping, and association are all included in data mining.
Estimation is the process of optimizing the actual state of nature. In general, estimation is related to model building, namely finding the parameters that best describe the multivariate
distribution of historical data. In estimation, the goal is to estimate population parameter values by working with samples [19]. Ideally in estimation one can consider all possible samples according to a given sampling strategy and obtain a probability distribution. The probability distribution is nothing but a mapping between a list of all possible outcomes and their probabilities.
Linear regression is a data analysis technique that predicts unknown data values. Linear regression mathematically models unknown variables or dependent variables and known variables or independent variables as linear equations [20]. For example, suppose one has data about last year's expenses and income. A linear regression technique analyzes this data and determines that expenses account for half of income. Next they calculate the unknown future expenditure by dividing the known future income by two
This section discusses the trials and results of implementing the linear regression method in estimating medical costs. Implementation in estimation using two linear regression models namely Simple Linear Regression and Multiple Linear Regression is as follows.
As previously explained, the data used in this study is an insurance claims dataset consisting of 1338 data with 7 attributes. The following is a description of the dataset.
Table 1. Dataset Attributes
|
Attributes |
Description |
|
Age |
Age of a person in healthcare treatment. |
|
Sex |
Gender of the person (eg, male or female). |
|
BMI |
Body Mass Index, a measure of body fat based on weight and height. |
|
Children |
The number of children or dependents the person has. |
|
Smokers |
Smoking status of the person (eg, whether the person is a smoker or non-smoker) |
|
Region |
The area or location where the person resides or receives healthcare services |
|
Charges |
Medical charges or costs associated with the healthcare treatment |
The preprocessing stage is carried out to convert categorical data into numeric data on several attributes such as sex, smoker, and region. The results of preprocessing data can be seen in Table 2.
Table 2. Preprocessing Results
|
age |
sex |
bmi |
children |
smoker |
regions |
charges | |
|
0 |
19 |
0 |
27,900 |
0 |
0 |
0 |
16884.92400 |
|
1 |
18 |
1 |
33,770 |
1 |
1 |
1 |
1725.55230 |
|
2 |
28 |
1 |
33,000 |
3 |
1 |
1 |
4449.46200 |
|
3 |
33 |
1 |
22,705 |
0 |
1 |
2 |
21984.47061 |
|
4 |
32 |
1 |
28,880 |
0 |
1 |
2 |
3866.85520 |
Next, a correlation analysis is performed to understand the relationship between the attributes in the dataset, after which all the columns are converted into numeric data. By identifying the correlation between variables, it can be determined which attributes have a significant effect on medical expenses and become the main predictor factor in the linear regression model.
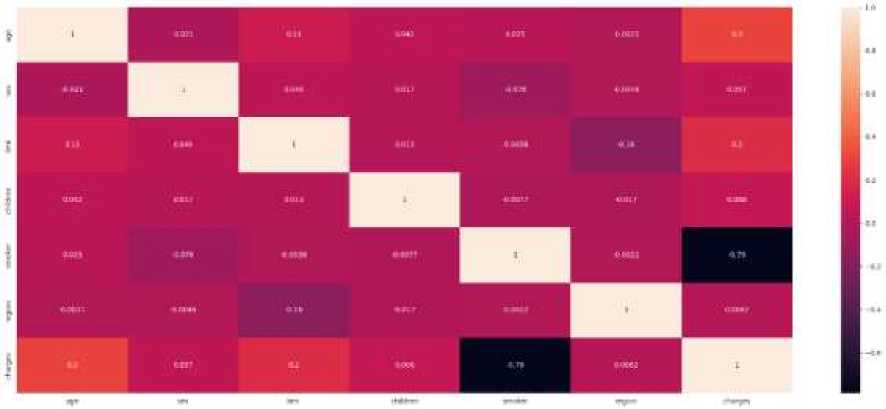
Figure 2. Correlation Matrix With HeatMap
Figure 2 is a visualization of data correlation using HeatMap. This correlation can be observed from the color in each column with the other columns. If it gets lighter, the columns show a stronger relationship with each other, whereas if it gets darker, then the relationship between the columns has a weaker one. From the correlation analysis, it can be seen that the "age" attribute has the strongest correlation with the "charges" attribute.
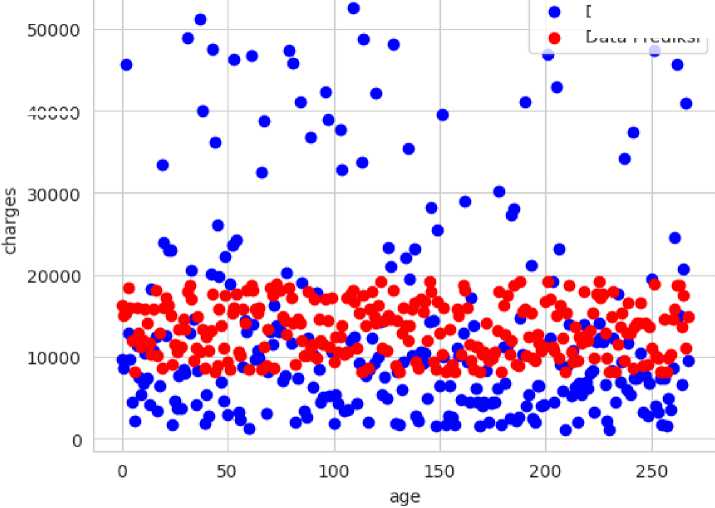
The results of the analysis using the Simple Linear Regression method with the independent variable age (age) and the dependent variable medical costs (charges) are represented in the form of a scatter plot graphic to visualize the relationship between the two variables. Figure 3 shows a plot of the results from Simple Linear Regression.
Data Aktual
Data Prediksi
40000
Figure 3. Simple Linear Regression Plots
Figure 3 shows the results of test data and train data from Simple Linear Regression using a scatter plot. From this figure it can be seen that there is a significant relationship between data age and medical cost data, as can be seen from the distribution of the points on
the scatter diagram. The results of the evaluation of the simple linear regression model are shown in Table 3.
Table 3. Evaluation Results of the Simple Linear Regression Model
|
Metric |
Score |
|
R2 |
0.07859025 |
|
MAE |
132098968.62 |
|
MSE |
9002.6355 |
Based on the evaluation results, it can be seen that the Simple Linear Regression model has a low R-squared (R2), this indicates the model's ability to explain variations in the data is low. In addition, this model produces high MSE and MAE, indicating that the level of deviation between the prediction and the actual value is also high. Thus, this model may not be sufficiently good at predicting medical costs based on age alone.
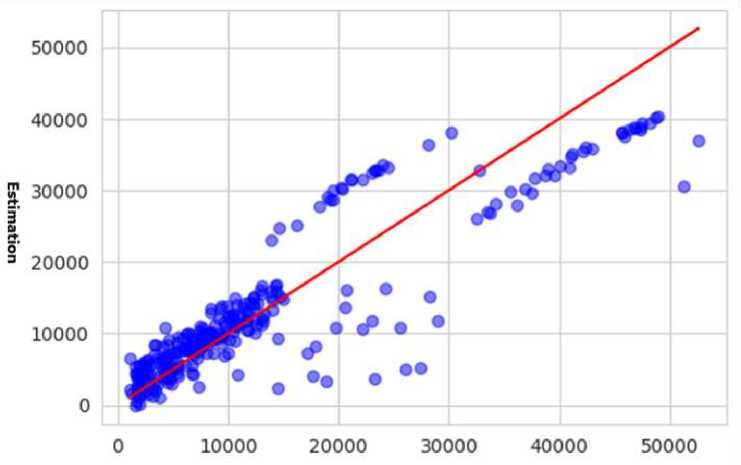
The estimation of medical expenses then uses the Multiple Linear Regression method to explain the relationship between several independent variables and the dependent variable, namely "charges". The results of the analysis are represented in the form of a scatter plot graph with a red diagonal line which shows the same value between the actual value and the estimated predicted result. Figure 4 displays a plot of the results of Multiple Linear Regression.
True values
Figure 4. Multiple Linear Regression Plots
Figure 4 is a plot of results using multiple linear regression which explains the relationship of independent variable with the dependent variable, namely charges. The red diagonal line in the plot shows the same value between the actual value and the estimate generated by the model. If the model estimation is very accurate, the points on the scatter plot will be very close to the diagonal line. It can be seen that most of the data points tend to follow a diagonal line pattern, this shows that the Multiple Linear Regression model tends to provide fairly good predictions. However, there are several data points that are spread far enough from the diagonal line, which indicates an error in the prediction for certain cases. This is also shown by the results of the model evaluation in Table 4
Table 4. Evaluation Results of the Multiple Linear Regression Model
|
Metric |
Score |
|
R2 |
0.79987471 |
|
MAE |
31845929.134 |
|
MSE |
3930.3332 |
From the evaluation table above, it can be seen that the Multiple Linear Regression model has a high R-squared (R2), indicating the model's ability to explain variations in good data. In addition, this model produces lower MSE and MAE than the previous model. Thus, this model is better at predicting medical costs by combining several independent variables, such as age, gender, body mass index, number of children, smoking habits, and region.
Based on the evaluation that has been done, it can be concluded that Multiple Linear Regression provides better performance compared to Simple Linear Regression with higher R-squared (R2) values, and lower MSE and MAE. However, the MSE and MAE values in this model are still quite high, which indicates that there are still significant limitations and deviation levels in some predictions. Therefore, for estimating medical costs based on the dataset used, the Multiple Linear Regression model is more recommended than Simple Linear Regression.
Data mining is the process of extracting useful knowledge from large and complex data sets. In this study, data mining is used to estimate medical costs. Medical cost are a significant issue in the health sector, so an accurate estimate can assist in budget planning and choosing the right insurance plan. This study uses the Linear Regression approach to estimate medical costs. The health insurance claims dataset was obtained from the Kaggle website and used for training and testing using the Simple Linear Regression and Multiple Linear Regression methods. The stages of this analysis include data preprocessing, data separation, regression and evaluation. The research results show that Multiple Linear Regression is recommended for estimating the dataset used, by obtaining an R2 value of 79.99% compared to Simple Linear Regression which can only explain the relationship of one attribute and obtaining an R2 value of 7.86% with high MSE and MAE. The application of linear regression in the analysis of insurance claims data can provide significant benefits for patients, hospitals and insurance companies. Overall, this study shows that data mining using the linear regression method is an effective approach to estimating medical costs.
References
-
[1] M. Kumar, R. Ghani dan Z.-S. Mei, “Data mining to predict and prevent errors in health insurance claims processing,” dalam Proceedings of the 16th ACM SIGKDD international conference on Knowledge discovery and data mining, Washingdon DC, USA, 2010.
-
[2] B. Milovic dan M. Milovic, “PREDICTION AND DECISION MAKING IN HEALTH CARE USING DATA,” Kuwait Chapter of Arabian Journal of Business and Management Review, vol. 1, no. 12, pp. 502-508, 2012.
-
[3] D. S. O. Panggabean, E. Buulolo dan N. Silalahi, “Penerapan Data Mining Untuk Memprediksi Pemesanan Bibit Pohon Dengan Regresi Linear Berganda,” JURIKOM (Jurnal Riset Komputer), vol. 7, no. 1, pp. 56-62, 2020.
-
[4] Y. Wilandari, S. H. Kartiko dan A. R. Effendie, “ESTIMASI CADANGAN KLAIM
MENGGUNAKAN GENERALIZED LINEAR MODEL (GLM) DAN COPULA,” JURNAL
GAUSSIAN, vol. 4, no. 9, pp. 411-420, 2020.
-
[5] Y. Li, C. Zou, M. Berecibar, E. Nanini-Maury, J. C.-W. Chan, P. v. d. Bossche, J. V. Mierlo dan N. Omar, “Random forest regression for online capacity estimation of lithium-ion batteries,” Applied Energy, vol. 232, pp. 197-210, 2018.
-
[6] Suryani dan Mustakim, “Estimasi Keberhasilan Siswa dalam Pemodelan Data Berbasis Learning Menggunakan Algoritma Support Vector Machine,” Bulletin of Informatics and Data Science, vol. 1, no. 2, pp. 81-88, 2022.
-
[7] T. Setiyorini dan R. T. Asmono, “KOMPARASI METO DENEURAL NETWORK, SUPPORT VECTOR MACHINE DAN LINEAR REGRESSION PADA ESTIMASI KUAT TEKAN BETON,” Jurnal TECHNO Nusa Mandiri, vol. 15, no. 1, pp. 51-56, 2018.
-
[8] A. Sharma dan N. Chaudhary, “Linear Regression Model for Agile Software Development Effort Estimation,” dalam 2020 5th IEEE International Conference on Recent Advances and Innovations in Engineering (ICRAIE), Jaipur, India, 2020.
-
[9] F. Nurzaman, “Prediksi Biaya Manfaat Kesehatan Pengobatan Rawat Jalan Karyawan Dengan Metode Data Mining Menggunakan Algoritma Regresi Linier,” Tekinfo: Jurnal Bidang Teknik Industri dan Teknik Informatika, vol. 20, no. 1, pp. 18-29, 2019.
-
[10] E. Rahayu, I. Parlina dan Z. A. Siregar, “Penerapan Algoritma Regresi Linier Berganda Pada Estimasi Penjualan Sepeda Motor,” Journal of Machine Learning and Artificial Intelligence, vol. 1, no. 1, pp. 1-10, 2022.
-
[11] R. Yanto, “Implementasi Data Mining EstimasiKetersediaan Lahan Pembuangan Sampah menggunakan Algoritma Regresi Linear,” JURNAL RESTI (Rekayasa Sistem dan
Teknologi Informasi), vol. 2, no. 1, pp. 361-366, 2018.
-
[12] Z. Laila dan N. Cahyono, “Estimasi Data Insight Social Media Ads Menggunakan Neural Network, Linear Regression dan Deep Learning,” Jurnal Sistem Komputer dan Informatika (JSON), vol. 4, no. 3, pp. 562-569, 2023.
-
[13] C. A. u. Hassan, J. Iqbal, S. Hussain, H. AlSalman, M. A. A. Mosleh dan S. S. Ullah, “A Computational Intelligence Approach for Predicting Medical Insurance Cost,” Mathematical Problems in Engineering, vol. 2021, 2021.
-
[14] I. M. Yuliara, “REGRESI LINIER SEDERHANA,” 2016. [Online].
-
[15] S. I. Bangdiwala, “Regression: simple linear,” International Journal of Injury Control and Safety Promotion, vol. 25, no. 1, pp. 113-115, 2018.
-
[16] D. Alita, A. D. Putra dan D. Darwis, “Analysis of Classic assumption test and multiple linear regression coefficient test for employee structural office recommendation,” IJCCS (Indonesian Journal of Computing and Cybernetics Systems), vol. 15, no. 3, pp. 295-306, 2021.
-
[17] BBADW Jinhee Kim, “Understanding Health Insurance Literacy: A Literature Review,” Family and Consumer Sciences Research Journal, vol. 42, nº 1, pp. 3-13, 2013.
-
[18] DS Sani Susanto, "Introduction to Data Mining Exploring Knowledge from Chunks of Data," Publisher Andi Offset, 2010.
-
[19] T. Hessing, “Point and Interval Estimation,” Six Sigma Study Guide Articles, [Online]. Available: https://sixsigmastudyguide.com/point-and-interval-estimation/. [Acessed on 3 July 2023].
-
[20] CYMCPENKS Ng Set Foong, “An Insight of Linear Regression Analysis,” Scientific Research Journal, 2018.
Medical Costs Estimation Using Linear Regression Method (Ni Made Dita Dwikasari)
179
Discussion and feedback