Maidekost Website Improvement Recommendations Based on User Experience and USE Questionnaire Evaluation
on
JURNAL ILMIAH MERPATI VOL. 11, NO. 3 DECEMBER 2023
p-ISSN: 2252-3006
e-ISSN: 2685-2411
Maidekost Website Improvement Recommendations Based on User Experience and USE Questionnaire Evaluation
M. Azman Maricara1, Edwarb2, Batara FS Simangunsongc3, Aura Pirdaraya Nur Anisac4 aComputer System Department, Faculty of Informatics and Computer, Institute of Technology and Business STIKOM Bali, Indonesia
bInformatics Management Department, Faculty of Bussiness and Vocational, Institute of Technology and Business STIKOM Bali, Indonesia
cInformation System Department, Faculty of Informatics and Computer, Institute of Technology and Business STIKOM Bali, Indonesia
e-mail: 1azman@stikom-bali.ac.id, 2edwar.ridwan@ stikom-bali.ac.id, 3200030268@stikom-bali.ac.id, 4210030606@stikom-bali.ac.id
Abstrak
Maidekost dibuat dikarenakan repotnya mencari informasi tempat tinggal sementara. Dari awal pembentukan sampai saat ini, Maidekost belum dioperasikan, diduga terdapat masalah usability. Maidekost telah di evaluasi dari sisi usability dengan wawancara dan USE Questionnaire. Didapatkan hasil predikat usability yang tinggi dan presentase kelayakan 79,96% dan ditemukan beberapa hal yang perlu dibenahi. Fokus penelitian ini bertujuan memberikan rekomendasi perbaikan berupa prototype dan rekomendasi tersebut diuji kembali dengan USE Questionnaire. Hasil yang didapatkan adalah terjadi peningkatan rata-rata usability sebesar 0,11 namun tidak mempengaruhi predikat usability yaitu tetap pada predikat tinggi. Dari sisi presentase kelayakan ada peningkatan sebesar 1,95%. Dengan kata lain, rekomendasi yang diberikan mampu memberikan peningkatan usability dan dapat diterapkan.
Kata kunci: Kebergunaan, Kuesioner USE, Maidekost, Pengalaman Pengguna, Rekomendasi Perbaikan.
Abstract
Maidekost was created because of the hassle of finding information on temporary residence. From the beginning of its formation until now, Maidekost has not been operated, it is suspected that there are usability problems. Maidekost has been evaluated from a usability perspective with interviews and the USE Questionnaire. The results of a high usability predicate and a feasibility percentage of 79.96% were obtained and several things needed to be fixed. The focus of this study aims to provide recommendations for improvement in the form of a prototype and these recommendations are tested again with the USE Questionnaire. The results obtained are an increase in the average usability of 0.11 but does not affect the usability predicate, which is still at the high predicate. In terms of the percentage of eligibility, there was an increase of 1.95%. So, the recommendations given are able to increase usability and can be implemented.
Keywords : Improvement Recommendation, Maidekost, Usability, USE Questionnaire, User Experience.
Searching for residential information for migrants is often considered troublesome and tiring, because migrants have to come to the location to survey the residence. Apart from being a hassle for migrants, managing residential houses, especially boarding houses, is also considered troublesome for boarding house managers to monitor rental times, payment times, etc. These problems are the background to the establishment of the Maidekost platform. From the beginning of 2022, this platform is still under development and not yet operational. This existence raises the assumption that there is a usability problem on the platform.
The usability of a digital product is very important to evaluate. This is illustrated by several reasons, namely to know that a product has met user expectations, to align business decisions with the use of the product in the market, to eliminate or minimize product deficiencies, to see the success of users in solving their problems and needs through the product, and to obtain feedback from related users existing products [1].
Usability evaluation of the Maidekost website has been carried out in previous research using interview methods and the USE Questionnaire. The USE evaluation results show a high average usability with a percentage above 70%, which indicates that the platform is suitable for use. However, from the results of the interviews it was found that several things were found lacking and needed to be improved according to the respondents [2]. The evaluation of this research succeeded in getting feedback from users. There were things that were felt to be lacking and needed to be addressed, which was the reason for developing a prototype of the Maidekost website. Prototype development aims to provide recommendations for design solutions as an alternative to current websites in order to meet user expectations. Design solution recommendations are made using the Figma application. The resulting design solutions were evaluated in the same way, namely by using the USE Questionnaire and with the same number and type of respondents, as used in previous research, namely, in research [2]. The evaluation results are compared to determine the average and percentage of usability obtained.
This research was carried out in several stages. The stages or flow of this research are shown in Figure 1.
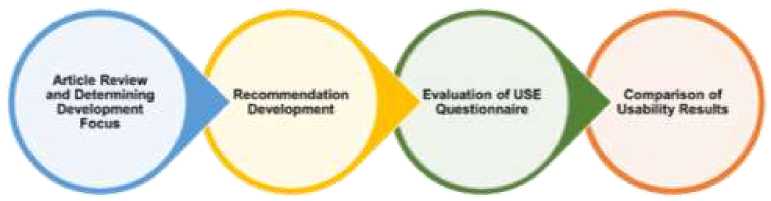
Figure 1. Research Flow
In determining the focus for developing recommendations, an in-depth review or analysis of research is carried out [2], in order to find out what things can be developed.
Recommendation development was made using the Figma application. The development of recommendations in this research is presented in the form of a Mockup and Prototype on the website platform.
The evaluation used in this research was the USE Questionnaire which was distributed using Google Form to 15 respondents representing user segmentation, namely 5 representing the segmentation of migrant students, 5 representing the segmentation of migrant employees, and 5 representing the segmentation of boarding house owners or managers. The reason for using 15 respondents is because in the usability evaluation process the number of respondents required is not many, using 5 respondents is considered to represent 80% of usability problems [3], [4].
Because in research [2] a usability assessment was carried out using the USE Questionnaire, the results of this assessment will be compared with the assessment carried out in this study. This is done to see how big the contribution of the recommendations given is whether they are able to increase the usability value or not.
In this literary study, there are several previous research results outlined in the state of the art. Apart from that, there are theories related to the tool used, namely Figma, the output produced from this research is recommendations in the form of mockups and prototypes, and also the evaluation method used, namely the USE Questionnaire.
The use of the USE Questionnaire has been used in previous studies. These studies are used as state of the art in this research. The first is research conducted in 2023 with the title Usability Analysis of the Flavor Fog Application Using the USE Questionnaire. This research aims to determine the usability value of applications created for ordering and searching for information about vapes or e-cigarettes and to determine the influence of other factors on user satisfaction. By using feasibility percentage measurements, the results were 85%, which means the application is very suitable for use [5]. Next is research with the title Application of USE Questionnaire Mode to Analyze Usability Influenced by User Experience in the Shopee Application which was conducted in 2023. The focus of this research is to determine the influence of user experience on usability and find out other factors on user satisfaction. This research assessed usability with a feasibility percentage of 79% in the Feasible category [6].
The third research with the title Usability Analysis using the Usefulness, Satisfaction, and Ease of Use Questionnaire in Digital Banking was conducted in 2023. Government and private banking institutions released digital banking applications that can be used via smartphone, with the aim of making customer transactions easier, especially during the COVID pandemic. -19. With the release of this application, complaints were received regarding the use of the application. By using the USE Questionnaire. However, this research does not focus on usability assessments in the form of average values or percentages of usability feasibility. This research focuses on the influence of the independent variables (usefulness, ease of use, and ease of learning) on the dependent variable (satisfaction) [7].
From the previous research above, there are differences from what was done in this research. This research focuses on developing recommendations for improvements in the form of prototypes to increase usability values which are presented in average form to show usability predicates and percentages to show the feasibility of using digital products in terms of usability.
Figma is an application used by UI designers to create designs from digital products on various platforms [8], [9]. Mockup is a visualization of a design concept in mid/high fidelity form that depicts colors, layout, typography, and the overall appearance of the product [10]. Meanwhile, a prototype is a design that represents the original product, which can be used as a tool to measure the success of a product before the product is released [9], [11]. Users of a product will use the prototype as a testing medium. When the user is able to interact well and get a positive experience, then the use of the prototype can be said to be successful [12].
The USE Questionnaire is an evaluation that can measure usability values quantitatively. The USE Questionnaire has 30 statements that will be rated by respondents on a Likert scale of 1-5 which means from strongly disagree to strongly agree. These 30 statements represent 4 aspects of assessment which include 8 usefulness statements, 7 satisfaction statements, 11 ease of use statements, and 4 ease of lo learning statements [13]–[15]. The 30 statements are shown in Table 1.
Table 1. USE Questionnaire Statement [16]
|
Utility |
Satisfaction |
Ease of Use |
Ease of Learning |
|
Maidekost helps me be more effective. |
I am satisfied with Maidekost’s services. |
This Platform is easy to use. |
I learned quickly to use Maidekost. |
|
Maidekost helps me be more productive. |
I will recommend this Platform to my friends. |
This Platform is simple to use. |
I can easily remember how to use this Platform. |
|
This Platform is useful. |
very |
Maidekost is pleasure to use. |
a |
This Platform is user friendly. |
It is very easy to | |
|
study using Platform. |
this | |||||
|
Maidekost gives more control over activities in my life. |
me the |
Maidekost works as I wanted. |
Maidekost did not require many steps to achieve what I wanted to do with this Platform. |
I quickly became skilled with this Platform | ||
|
Maidekost makes the things I want to achieve easier to do. |
This Platform awesome. |
is |
This Platform is flexible. |
- | ||
|
Maidekost saves when I use it. |
time |
I feel the need have this Platform |
to |
Using this Platform is very easy. |
- | |
|
Maidekost meets needs. |
my |
This Platform is to use. |
fun |
I can use this Platform without written instructions. |
- | |
|
Maidekost did everything I wanted it to do. |
- |
I did not notice any inconsistencies when I use it. |
- | |||
|
- |
- |
Both casual users and occasional users will like it. |
- | |||
|
- |
- |
I can fix errors quickly and easily. |
- | |||
|
- |
- |
I successfully use this Platform every time. |
- | |||
Usability assessment in this research was carried out by calculating the average usability. To calculate the average usability using the equation (1).
UAx = -^-
(1)
( Q xR}
Where : UAx ∑J Q R
-
= Usability Aspects of USE assessment
= Total number of answers given by respondents
= Number of USE assessment Aspect Questions
= Number of respondents
Apart from calculating average usability, this study also assessed usability in percentage form. To calculate the usefulness of a presentation using the equation (2) [17], [18].
% UAx = ∙^∙ ( Q x))
(2)
Where : %UAx ∑J SR Q
= Usability Percentage Aspects of USE Assessment
= Total number of answers given by respondents
= Likert scale = 5
= Number of USE assessment Aspect Questions
R = Number of respondents
Equations (1) and (2) are used to calculate the average and percentage of usability per aspect of the USE Questionnaire. To calculate the average and overall usability percentage by adding up the calculation results for each aspect and dividing by 4. The average usability results to see the usability predicate, the average assessment range and usability predicate are shown in Table 2. Meanwhile the usability percentage results. To measure the suitability of a product, the percentage range and usability suitability are shown in Table 3.
Table 2. Usability Predicate [16]
|
Usability Average Value |
Usability Predicate |
|
1,00 - 1,79 |
Very Low |
|
1,80 - 2,59 |
Low |
|
2,60 - 3,39 |
Enough |
|
3,40 - 4,19 |
High |
|
4,20 - 5,00 |
Very High |
|
Table 3. Usability Feasibility Percentage [19], [20] | |
|
Percentage (%) |
Feasibility |
|
< 21 |
Very Unfeasible |
|
21 - 40 |
Unfeasible |
|
41 - 60 |
Enough |
|
61 - 80 |
Feasible |
|
81 - 100 |
Very Feasible |
Based on the research flow in Figure 1, the following are The results obtained from each stage.
Previous research has evaluated the Maidekost website qualitatively and quantitatively. The results obtained In this research based on the USE Questionnaire evaluation results are shown in Table 4.
Table 4. USE Questionnaire Evaluation Results Previous Research
|
Aspects |
Usability Average |
Usability Predicate |
Usability Percentage (%) |
Feasibility |
|
Usefulness |
3,76 |
High |
75,17 |
Feasible |
|
Satisfaction |
3,79 |
High |
75,81 |
Feasible |
|
Ease of Use |
4,18 |
High |
83,52 |
Very Feasible |
|
Ease of Learning |
4,27 |
Very High |
85,33 |
Very Feasible |
Overall the Usability percentage obtained on the research USE Questionnaire was 79,96%, which means the website is suitable for use. Meanwhile, the results of the qualitative evaluation revealed the fact that there were things That were felt to be lacking and neededto be addressed based on the average respondent’s information during the interview process. The things that need to be added or improved include :
-
1. Ratings and Reviews of boarding houses.
-
2. Information on the distance of the boarding house to strategic places
-
3. Information on facilities, room categories and prices that need to be placed on the website.
-
4. The need for suggested input in the search feature.
Based on the results of the review of previous research articles, points were obtained that needed to be focused on for development. The recommended design display is shown in Figures 2,3 and 4.
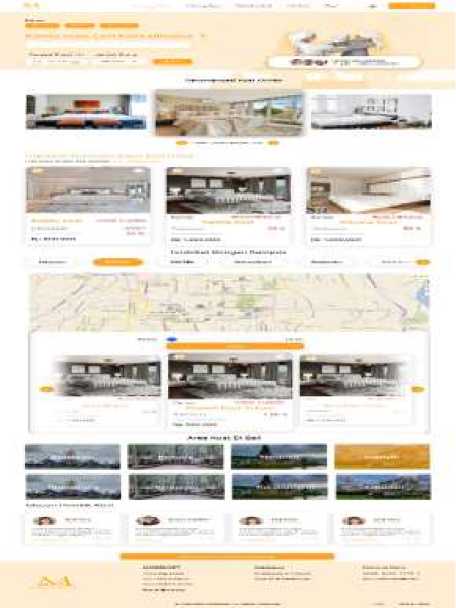
Figure 2. Landing Page Recommendations
In Figure 2, the Landing Page Recommendations are shown. On the Landing page there is a search column which is equipped with a selection of duration of stay, check-in date or boarding entry date, and the number of people who will occupy the boarding room. There are also recommendations for preffered costs and payment discounts with certain conditions. Apart from that, on the landing page there is also a map containing the distance to boarding houses within a certain radius determined from the campus of choice. There are also boarding house areas in Bali based on districts and there are illustration of reviews of boarding house owners who have used the services of the Maidekost website.
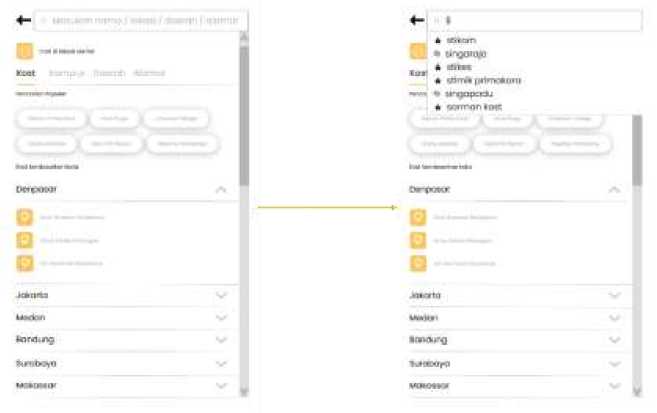
Figure 3. Search and Suggest Recommendations
Picture 3 on the left shows search page recommendations. On this page, users can input the name of the boarding house, location, area or specific address. Apart from that, popular searches are also shown. Meanwhile, on the right side, it shows search suggestions according to the characters entered by users.
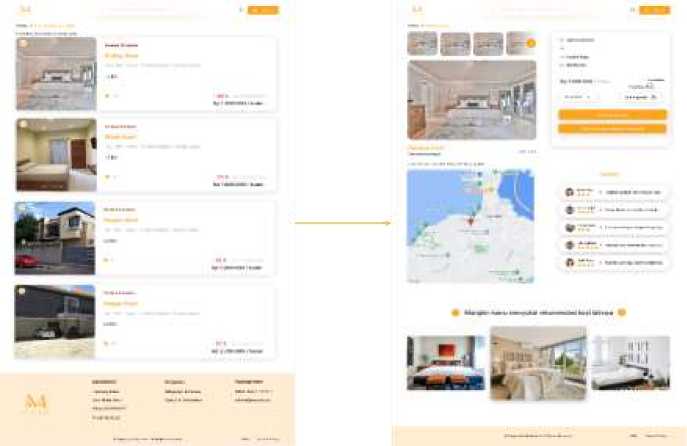
Figure 4. Search Results and Boarding Details
Picture 4 on the left shows the results of the search carried out in the form of a list of boarding houses. When one of the options on the list is clicked, it will appear as shown in the right side of the image. Complete photo of the boarding room, next to which information on prices and facilities is provided. Then there is a map that shows the location of the boarding house, as well as the results of reviews of the boarding houses.
The Recommendations provided in the form of mockups and prototypes were tested using the USE Questionnaire with a list of statements shown in Table 1. The results of distributing the questionnaire were then calculated for the average and percentage of usability using equations (1) and (2) and the predicate and feasibility were measured as stated in shown in Tables 2 and 3. The results of these calculations are also shown in Table 5.
|
Table 5. Recommendations Evaluation Results with USE | ||||
|
Aspect |
Average Usability |
Usability Predicate |
Usability Percentage (%) |
Feasibility |
|
Usefulness |
3,93 |
High |
78,50 |
Feasible |
|
Satisfaction |
4,00 |
High |
80,00 |
Feasible |
|
Ease of Use |
4,22 |
Very High |
84,36 |
Very Feasible |
|
Ease of Learning |
4,27 |
Very High |
85,33 |
Very Feasible |
Apart from that, the usability percentage results obtained for all aspects contained in the USE Questionnaire were 81.91%, which means that the recommendations given are very suitable for use.
From the results of review of previous research and the results of the evaluation carried out in this study, the two results were compared based on the average results and percentage of usability. Comparisons will be made per aspect and shown in Table 6 for a comparison of average usability and Table 7 for a comparison of usability percentages.
Table 6. Comparison of Average Usability
|
Aspect |
Usability Average - Pre |
Usability Predicate - Pre |
Usability Average - Post |
Usability Average - Post |
|
Usefulness |
3,76 |
High |
3,93 |
High |
|
Satisfaction |
3,79 |
High |
4,00 |
High |
|
Ease of Use |
4,18 |
High |
4,22 |
Very High |
|
Ease of Learning |
4,27 |
Very High |
4,27 |
Very High |
|
Table 7. Usability Percentage Comparison | ||||
|
Aspect |
Usability Percentage (%) |
Feasibility - Pre |
Usability Percentage (%) |
Feasibility -Post |
|
- Pre |
- Post | |||
|
Usefulness |
75,17 |
Feasible |
78,50 |
Feasible |
|
Satisfaction |
75,81 |
Feasible |
80,00 |
Feasible |
|
Ease of Use |
83,52 |
Very Feasible |
84,36 |
Very Feasible |
|
Ease of Learning |
85,33 |
Very Feasible |
85,33 |
Very Feasible |
The Usefulness aspect shows an average increase in usability of 0,17. However, this increase does not affect the usability predicate which still has a High predicate. In terms of percentage, it also shows an increase, namely 3,33%, the increase does not affect feasibility, that is, it is still considered feasible. This shows that the recommendations given are able to increase the average usability value and percentage for this aspect.
The Satisfaction aspect shows an increase in the average usability of the satisfaction aspect of 0,21. However, this increase does not affect the usability predicate which still has a High predicate. In terms of percentage, it also shows an increase, namely 4,19%, the increase does not affect feasibility, that is, it is still considered feasible. This shows that the recommendations given are able to increase the average usability value and percentage for this aspect.
The Ease of Use aspect shows an increase in the average usability from the ease of use aspect of 0.04. This increase affects the usability predicate, which previously had a High predicate, to a Very High predicate. In terms of percentage, it also shows an increase, namely 0.84%, the increase does not affect feasibility, that is, it is still considered very feasible. This shows that the recommendations given are able to increase the average score and usability predicate for this aspect.
The Ease of Learning aspect does not show any increase or decrease in either the average or percentage of usability. In other words, this aspect still has a very good predicate and very reasonable feasibility.
Overall the percentage of usability shows an increase, which in previous research was at 79.96%. After being given recommendations, the overall usability percentage was 81.91%, an increase of 1.95%. Which indicates that the recommendations given are able to increase the feasibility percentage of the Maidekost website, which was initially suitable for use to become very suitable for use. In other words, the recommendations given are not to improve but to optimize the existing website.
Recommendations for improvements are provided in the form of mockups and prototypes. able to increase the average usability score from 3 aspects, namely Usability from 3.76 to 3.93, Satisfaction from 3.79 to 4.00, Ease of Use from 4.18 to 4.22. Meanwhile, the Ease of Learning aspect has a constant average usability figure. With these results, it can be stated that the recommendations given are able to increase the average usability value. Apart from being able to increase the average usability score, the recommendations given were able to increase the percentage of feasibility for using the website which previously got a figure of 79.96%, which means it is suitable for use, to 81.91%, which means it is very suitable for use.
Things that can be done in the future are to carry out further evaluations with a wider scope, to find out other problems, and this evaluation can be carried out 6 to 12 months after the website is implemented. Apart from that, existing websites can be developed into mobilebased applications to increase usage access.
References
-
[1] D. P. Kesuma, “Penggunaan Metode System Usability Scale Untuk Mengukur Aspek
Usability Pada Media Pembelajaran Daring Di Universitas XYZ,” Jurnal Teknik Informatika dan Sistem Informasi, vol. 8, no. 3, pp. 1615–1626, 2021, [Online]. Available: http://jurnal.mdp.ac.id
-
[2] M. A. Maricar, Edwar, A. P. N. Anisa, and B. F. Simangunsong, “Evaluasi User
Experience Terhadap Website Maidekost Menggunakan Use Questionnaire,” TEMATIK: Jurnal Teknologi Informasi Komunikasi (e-journal), vol. 10, no. 1, pp. 67–73, Jun. 2023, doi: 10.38204/tematik.v10i1.1298.
-
[3] R. A. Hasani, M. R. A. Yudianto, P. Sukmasetya, and Y. Febriyanto, “Uji Prototype
Metode Design Thinking pada penyebaran Informasi COVID-19,” Jurnal Kajian Ilmiah, vol. 22, no. 2, pp. 163–172, 2022, [Online]. Available:
http://ejurnal.ubharajaya.ac.id/index.php/JKI
-
[4] M. R. A. Pramudya, A. Muliawati, and R. Astriratma, “Analisis User Experience Pada
Aplikasi Alpukat Betawi (Akses Langsung Pelayanan Dokumen Kependudukan Cepat Dan Akurat) Dengan Menggunakan Metode Cognitive Walkthrough Dan Metode User Experience Questionnaire,” in SENAMIKA (Seminar Nasional Mahasiswa Ilmu Komputer dan Aplikasinya), Jakarta, Aug. 2022, pp. 306–315.
-
[5] A. M. N. Theovanus, A. Yunus, and A. Muawwal, “ANALISIS USABILITY PADA
APLIKASI FLAVOUR FOG MENGGUNAKAN USE QUESTIONNAIRE,” Jurnal
KHARISMA Tech, vol. 18, no. 01, pp. 139–150, 2023, [Online]. Available:
https://play.google.com/store/apps/details?id=com.trigee.flavor_fog.
-
[6] M. K. Sari, H. J. Setyadi, and V. Z. Kamila, “Penerapan Model Use Questionnaire untuk
Menganalisis Usability yang Dipengaruhi oleh User Experience pada Aplikasi Shopee,” JITSI: Jurnal Ilmiah Teknologi Sistem Informasi, vol. 4, no. 2, pp. 64-73, 2023, [Online]. Available: http://jurnal-itsi.org
-
[7] C. R. Pirie and J. J. C. Tambotoh, “Analisis Kebergunaan menggunakan Usefulness,
Satisfaction, and Ease-of-Use Questionnaire pada Perbankan,” Sistemasi: Jurnal Sistem Informasi, vol. 12, no. 1, pp. 154–165, 2023, [Online]. Available:
http://sistemasi.ftik.unisi.ac.id
-
[8] M. A. Muhyidin, M. A. Sulhan, and A. Sevtiana, “Perancangan Ui/Ux Aplikasi My Cic
Layanan Informasi Akademik Mahasiswa Menggunakan Aplikasi Figma,” Jurnal Digit, vol. 10, no. 2, pp. 208–219, 2020, doi: 10.51920/jd.v10i2.171.
-
[9] M. A. Maricar, D. Pramana, and E. Edwar, “Pengujian Prototype Pemesanan Creative
Gift Menggunakan HEART Framework,” JURNAL MEDIA INFORMATIKA BUDIDARMA, vol. 6, no. 2, p. 1166, Apr. 2022, doi: 10.30865/mib.v6i2.3982.
-
[10] D. Arifudin, L. Heryanti, and D. Pramesti, “PELATIHAN DESAIN MOCKUP DAN LOGO SEBAGAI BRANDING PRODUK UNTUK MENINGKATKAN NILAI JUAL BAGI UMKM,” JMM (Jurnal Masyarakat Mandiri), vol. 5, no. 5, pp. 2640–2651, 2021, doi:
10.31764/jmm.v5i5.5847.
-
[11] M. Martono, “Implementasi Prototype Aplikasi Pengelolaan Inventaris Barang,” Jurnal Ilmiah Media Sisfo, vol. 12, no. 2, pp. 1099–1110, 2018, doi:
10.33998/mediasisfo.2019.13.1.566.
-
[12] A. Yuwono and R. E. Indrajit, Pengantar Konsep Dasar Design Thinking - What, Why, Where, When, Who, and How. Yogyakarta: Penerbit ANDI, 2020.
-
[13] D. Hudaifa, I. Aknuranda, and K. C. Brata, “Evaluasi dan Perbaikan Aplikasi Mobile Malang Menyapa Menggunakan Metode Usability Testing dan USE Questionnaire,” Jurnal Pengembangan Teknologi Informasi dan Ilmu Komputer, vol. 3, no. 5, pp. 4846– 4855, 2019, [Online]. Available: http://j-ptiik.ub.ac.id
-
[14] Y. S. M. Putra and R. Tanamal, “Analisis Usability Menggunakan Metode USE Questionnaire Pada Website Ciputra Enterprise System,” TEKNIKA, vol. 9, no. 1, pp. 58–65, Jul. 2020, doi: 10.34148/teknika.v9i1.267.
-
[15] M. Gao, P. Kortum, and F. Oswald, “Psychometric evaluation of the USE (usefulness, satisfaction, and ease of use) questionnaire for reliability and validity,” in Proceedings of the Human Factors and Ergonomics Society, Human Factors and Ergonomics Society Inc., 2018, pp. 1414–1418. doi: 10.1177/1541931218621322.
-
[16] E. R. Nainggolan and S. Susafa’ati, “PENGUJIAN USABILITY SISTEM INFORMASI PELAYANAN RUKUN WARGA MENGGUNAKAN USE QUESTIONNAIRE,” Jurnal AKRAB JUARA, vol. 3, no. 4, pp. 27–34, 2018.
-
[17] M. D. Fahmi, H. M. Az-Zahra, and R. K. Dewi, “Perbaikan Usability Aplikasi Pemesanan Tiket Bioskop Menggunakan Metode Usability Testing dan USE Questionnaire,” Jurnal Pengembangan Teknologi Informasi dan Ilmu Komputer, vol. 2, no. 12, pp. 6653–6660, 2018, [Online]. Available: http://j-ptiik.ub.ac.id
-
[18] S. W. Ningrum, I. Akrunanda, and A. R. Perdanakusuma, “Evaluasi dan Perbaikan Usability Aplikasi Mobile Ojesy Menggunakan Metode Usability Testing dan Use Questionnaire,” Jurnal Pengembangan Teknologi Informasi dan Ilmu Komputer, vol. 3, no. 5, pp. 4825–4834, 2019, [Online]. Available: http://j-ptiik.ub.ac.id
-
[19] N. Alamsyah, M. Muflih, M. E. Rosadi, and M. Muharir, “Analisis Usability untuk Penggunaan Aplikasi Signature QR Code pada Keabsahan Dokumen Skripsi terhadap Kepuasan Pengguna Menggunakan USE (Usefulness, Satisfaction, Ease Of Use) Questionnaire,” Technologia, vol. 14, no. 1, pp. 78–88, 2023.
-
[20] E. Retnoningsih and N. F. Fauziah, “Usability Testing Aplikasi Rekomendasi Objek Wisata Di Provinsi Jawa Barat Berbasis Android Menggunakan USE Questionnaire,” BINA INSANI ICT JOURNAL, vol. 6, no. 2, pp. 205–216, 2019.
Maidekost Website Improvement Recommendations Based on User Experience and USE 170
Questionnaire Evaluation (M. Azman Maricar)
Discussion and feedback