Vacant Car Parks Detection Using Digital Image Processing Methods
on
LONTAR KOMPUTER VOL. 13, NO. 1 APRIL 2022
DOI : 10.24843/LKJITI.2022.v13.i01.p02
Accredited Sinta 2 by RISTEKDIKTI Decree No. 158/E/KPT/2021
p-ISSN 2088-1541
e-ISSN 2541-5832
Vacant Car Parks Detection Using Digital Image Processing Methods
Milyun Ni’ma Shoumia1, Ridwan Rismantob2, Arie Rachmad Syulistyoa3 aDepartment of Information Technology, State Polytechnic of Malang 1milyun.nima.shoumi@polinema.ac.id 3arie.rachmad.s@polinema.ac.id(corresponding author)
bDepartment of Advanced Science and Technology Information Science Program, Hiroshima University, Japan
Abstract
Long car queues are often encountered in some public facilities because visitors should be around to find an empty parking space. One way to minimize this case is to use a parking information system that shows the location of the parking lot that is empty or occupied with their amounts. This research presented two digital image processing methods for detecting empty space occupied in the image of the car parking area. There are vehicle detection and edge detection method. Vehicle detection is the method used to detect objects in the image by subtracting the parking area image, an empty parking lot, from the image containing the car. In contrast, the edge detection method detects the object's edge. The results from these two methods were then compared using the AND function to obtain the condition of an empty or occupied box for each box in the parking lot. Threshold values affect the determination of the parking lot. In this research, the data used are images of open car parks in the Malang Town Square (Matos) shopping center, Mall Olympic Garden (MOG), and data sourced from journals with similar topics [16]. The test results show that the best detection results are obtained in detecting occupied parking spaces in the parking lot in Malang Town Square (Matos), with a threshold of 10 and an accuracy of 99.4% with a threshold of 10.
Keywords: parking lot, vacant car park, image subtraction, edge detection, digital image processing
Currently, the number of motorized vehicles, two-wheeled or more, shows a significant development, especially in big cities. The development of the number of cars indirectly impacts the need for parking spaces in several public facilities, such as offices, campuses, hospitals, shopping centers, or recreational areas. These public facilities need to expand their parking space to accommodate all visitor vehicles. However, even though a relatively large parking area is provided, long queues are still common, such as in shopping centers or recreational areas during weekends or long school holidays [1], [2]. This long queue in the parking lot occurs because visitors have to look for an empty place in the parking lot.
The development of technology, especially computers, provides many conveniences for humans. Almost every office, company, industry, household, or school has used a computer as the primary tool for various purposes. One of the uses of computer technology to facilitate human activities is to manage parking lots [3]. The existence of a computerized parking management system can make it easier for visitors to find empty spaces in the parking lot. Parking management systems refer to programs that can efficiently use parking resources [4]. Several parking lot technologies have been developed to replace the traditional method, which is only a sign the number of full or empty places on a board located at the parking lot entrance. The delivery of parking information that has been developed includes mobile phones, Personal Data Assistants (PDAs), Variable Message Display (VMS), Parking Guidance and Information System (PGIS), which displays the
number of empty and filled parking spaces, or through Urban Traffic Management and Control (UTMC) [5].
There are four car parking guidance system categories based on different technologies. There are based on the number of vehicles, wired sensors, wireless sensors, and image-based [6], [7]. Among the four categories, image-based technology is a technology that has many advantages over the other three technologies [8]. With this system (image-based technology), visitors can find out exactly and specify the vacant place's location. In addition, this system does not require high costs for its development because it only requires CCTV cameras which have previously been installed in several places for security purposes [9].
In this study, images of the car park were used, which were taken using a digital camera to replace the CCTV image. Pictures of the car park area are taken periodically at different times: afternoon, evening, and night. Several image processing techniques are used to obtain information on empty spaces in car parks. Image processing is one form of information processing with input in the form of an image and output, which is also an image or can also be part of the image which aims to improve image quality [10], [11]. The image processing method used to detect empty spaces in the car park is the detection of vehicles or objects in the parking lot, using the threshold value set for pixel detection at a particular value [12]. The second method reduces detection errors due to shadows coming from vehicles. Without this second method, the system can incorrectly detect the shadow of a car as a parked vehicle. This method uses median filtering and Sobel edge detection techniques. Median filtering is a spatial filter used to reduce noise, where the gray values of the points in the sub-image matrix are sorted from the smallest to the largest value and then the median value is determined. While Sobel edge detection is a method in image processing that is useful for detecting the edges of an object in a digital image [13], [14]. That two methods are then compared with the AND function operation to determine an empty parking space or filled with vehicles. The novelty of this study is that the two datasets used in the testing process are self-collected, not open datasets. In addition, the combination of image processing methods used in this research is through an experimental process to produce good method stages and accuracy. With the parking information system developed with this image-based technology, it is hoped that it can minimize the search time for parking spaces by visitors so that there are no long queues at the entrance to the parking lot [15].
The steps taken in this research are as follows: First, learn the methods used to detect space in the car parks from journals or proceedings. Second, analyzing and designing the software to detect empty spaces in car parks by combining the methods used. Third, collecting data in the image form of outdoor car parks in Malang Town Square (Matos), Mall Olympic Garden (MOG), and data sourced from journal authors entitled "Vacant Parking Space Detection in Static Image," Nicholas True [16]. Fourth, developing software based on the analysis and design that has been done. Fifth, software testing to detect empty space in car parks, using the collected field data. Sixth, evaluating detection results carried out by the software to determine the accuracy. The research steps can be illustrated in Figure 1.
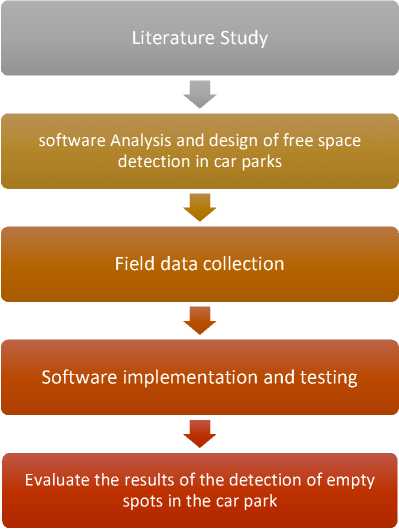
Figure 1. The Research Stage Design
The system developed in this study is a system that can assist users in searching for empty places in the car park automatically. The user only enters the image data of the car park. Then the system will process the input image until an empty car park is found. The input image used in the testing was the car parking area image, which was taken from the 3rd-floor car park at the shopping center Malang Town Square (Matos), Mall Olympic Garden (MOG), and there is also data sourced from journals with similar topics [16]. The input image is 572 x 2275 for data on Matos, 572 x 322 for data with a location on MOG, and 572 x 345 for data sourced from a previous journal [16]. The input image data is stored in a bitmap file according to the original size, without any prior cutting or resizing of pixels. The methods used to detect empty spaces in this car park are entirely based on digital image processing.
The stages contained in this study can be seen in Figure 2. Generally, there are five stages to detect empty spaces in parking lots, as follows:
-
1. The user selects an image of a car park already available on the computer as an input image to be processed by the system.
-
2. The initialization process is a process to detect the dividing line in each parking lot through the coordinates of each corner stored in a .txt file. The input image in this initialization process is an empty parking lot image. The corner points of each parking lot box are selected from the input image to save the coordinates of the selected parking lot corner points. The initialization process and the coordinates of the selected corner points can be seen in Figure 3.
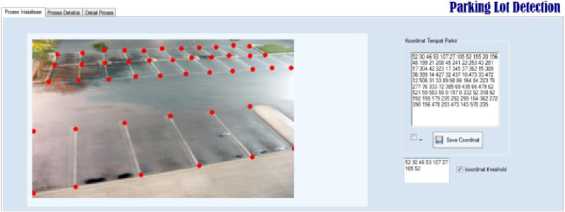
Figure 3. The Initialization Process
-
3. The vehicle detection process with four subprocesses that is:
-
a. The color distribution in the input image is changed to be more even by using the histogram equalization method.
-
b. Image subtraction where the input image is calculated for the difference in pixel values with an empty parking lot image.
-
c. The resulting image subtraction is converted into a grayscale image.
-
d. The grayscale image is converted into a binary image using a predetermined threshold.
-
4. In edge Detection, the input image that has been converted into a grayscale image will be improved in quality with the histogram equalization method to even out the color distribution, the median filtering to reduce noise in the image, and the Sobel edge detection method to detect the edges of the image so that detection results are obtained object in the image. An example of edge detection results can be seen in Figure 4.
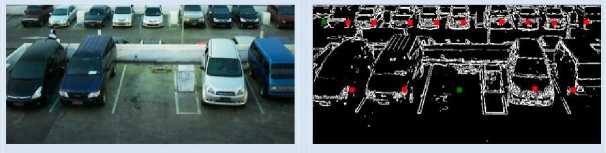
Figure 4. An example of an Edge Detection Result
-
5. AND function, the detection results in the vehicle detection and edge detection processes will be compared so that the final detection results are obtained.
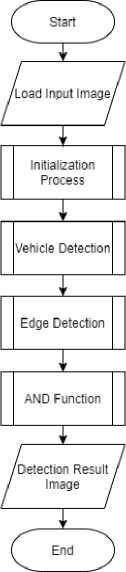
Figure 2. Flowchart of Research Method
A histogram is a diagram that shows the number of points contained in an image for each gray level [17]. The x-axis on the histogram shows the color level, while the y-axis shows the frequency with which the points appear. The histogram of an image can be modified to obtain the image's histogram as desired. One way that can be used to modify an image histogram is histogram equalization. Histogram equalization is a process that changes the distribution of the gray degree values in an image so that it becomes uniform [17].
The purpose of histogram equalization is to obtain an even histogram distribution so that each degree of gray has a relatively equal number of pixels. Histogram alignment is obtained by changing the gray degree of a pixel (r) with a new gray degree (s) using a transformation function T. Mathematically, and it can be written as in equation 1.
s = T(r) (1)
r can be recovered from s by the inverse transformation as in equation 2.
r = T-1(s), where 0 ≤ s ≤ 1 (2)
Detection of differences in two almost identical images can be done by subtraction operation, commonly called image subtraction. To find the difference, it is necessary to take the first image and the second one, then subtract one image from the other [10]. They are mathematically written as in equation 3.
g(χ,y) = f(x,y) - h(x,y) (3)
g is a new image where the intensity of each pixel is the difference between the intensity of the f and h pixels. An example of implementing an image subtraction operation is to obtain an object from two images. Image subtraction can also detect changes occurring during a certain time interval if the two images taken are from the same angle/place.
Binarization is used to convert an image with a grayscale format (with a possible value of more than 2) into a binary image with only two values, 0 and 1. The operation that will be used in the binarization process is a threshold operation, which changes the object pixels in the gray image into pixels with the maximum intensity (255) and changes the background pixels in the gray image into pixels with the minimum intensity (0) in the binary image, or vice versa (objects with an intensity value of 0 and a background with an intensity value of 255 in the resulting binary image). The pixel values that meet the threshold conditions are mapped to the desired value in the thresholding operation.
There are two types of thresholding: single thresholds and multiple thresholds [17]. At a single threshold, the object and background pixels have gray levels grouped into two dominant modes. One way to separate an object from the background is to select the boundary value T. The point (x,y) where f(x,y) > T, is called the object. At multiple thresholds, object and background pixels have gray levels, which are grouped into three dominant modes, namely classifying one point (x,y) as an object class if T1 < (x,y) T2, another object class if f(x, y) > T2, and is the background if f(x,y) T1. T function on thresholding: T = T[x,y,p(x,y),f(x,y)], where f(x,y) is the gray level value at points (x,y) and p(x ,y) shows some local properties at that point.
The optimal T threshold value can be found using the Otsu method. The purpose of the Otsu method is to automatically divide the histogram of the gray level image into two different areas. The approach taken by the Otsu method is to perform discriminant analysis, which is to determine a variable that can distinguish between two or more groups that arise naturally. The discriminant analysis will maximize these variables to divide the foreground and background objects.
Noise in an image can occur due to gray-level characteristics or random variables that occur due to the characteristics of the Probability Density Function (PDF) [10]. If the image containing noise is directly processed and extracted, its important features can cause accuracy problems. So, the image should be cleaned of noise first and then processed to extract the important features. One technique for reducing noise is order-statistics filters, which are spatial filters where the response results are based on the ordering of the pixel values enclosed by the filter. Median filtering is the best-known order-statistics filter [10].
Median filtering takes a particular image area according to a predetermined mask size (usually 3x3), then looks at each pixel value in that area and replaces the center value in the area with the median value. How to get the median value, which is the gray value of the points in the matrix sorted from the smallest to the largest value, then determine the value in the middle of the pixel series. Median filtering gives good results for images affected by bipolar and unipolar impulse noise. This filter provides excellent noise reduction capabilities for certain types of noise, with less blurring than linear smoothing filters for the same image size.
The value of the specified parameter affects the level of accuracy of the detection results. The parameter is the threshold used as a limit to determine the status of the parking lot, empty or filled. The test was conducted using three threshold values: 10, 30, and 70. The selection of this threshold value was based on an experiment with several values, and it was found that the three values had the most significant difference in detection results. The minimum value limit of 10 and a maximum of 70 were chosen because if the threshold value is less than the minimum value or more than the maximum value, the detection result will result in many errors, where vacant parking spaces are detected as occupied, and conversely occupied parking spaces are detected as vacant parking spaces so that the resulting level of accuracy is low. This happens because the threshold value to determine the number of white points in a parking box area is too small or too large. While testing with a threshold of 20, 40, 50, and 60 aims to determine the details of changes inaccuracy. The tests were carried out on 35 car parking image data. An example of the detection results carried out in the testing process can be seen in Figure 5.
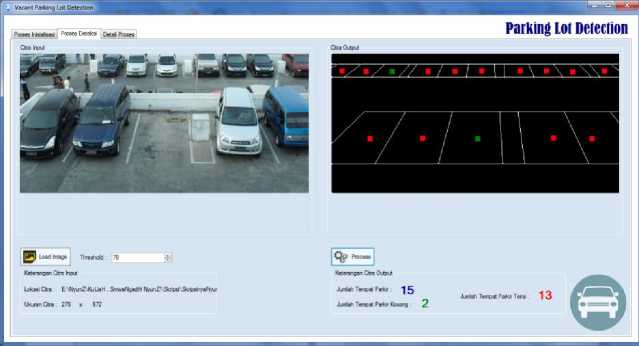
Figure 5. Example of Detection Result
The results of empty spaces detection in the car park for the experimental image data located in Matos can be seen in Table 1.
Table 1. Detection Results in Matos
|
Number of Places |
Threshold |
Filled |
Empty |
Filled & Empty |
|
15 |
10 |
99,4% |
60,3% |
93,8% |
|
15 |
20 |
99,4% |
70,1% |
96% |
|
15 |
30 |
98,8% |
70,8% |
87,7% |
|
15 |
40 |
96,8% |
70,8% |
95,4% |
|
15 |
50 |
96,8% |
70,8% |
95,4% |
|
15 |
60 |
95% |
83,3% |
94,9% |
|
15 |
70 |
92,6% |
83,3% |
92,8% |
The number of places in table 1 shows the number of parking boxes in the parking lot image data in Matos, and this number is different for each parking lot location. For example, the number of parking boxes in the Matos parking lot is different from the number of parking boxes in the MOG parking lot. From table 1, it is found that the threshold of 10 and 20 are the best thresholds for detecting occupied parking spaces. Thresholds of 60 and 70 are the best thresholds for detecting empty parking spaces at the Matos location. In addition, the threshold value of 20 is also the best threshold for detecting empty and filled parking spaces. A graph that illustrates the considerable influence of the threshold on the detection of parking spaces, whether filled, empty, or overall, at the Matos location can be seen in Figure 6.
From Figure 6, it can be seen that the threshold of 10 and 20 produces the highest accuracy level of 99.4% when detecting an occupied parking lot. The 99.4% accuracy rate means that the system can detect 99.4% of the parking spaces filled correctly and 0.6% of the total number of parking spaces. This indicates that the method applied is optimal enough to detect the presence of filled parking spaces. 0.6% of detection errors came from data in dark conditions (afternoon towards night), and one car had just been parked with the car's headlights still on. When processed, the number of white pixels in the area is less than the threshold, so the parking box area is assumed to be empty when filled. In the blue line that shows the effect of the threshold on the accuracy level of detecting occupied places, it is found that the greater the threshold value, the lower the resulting accuracy will be. The greater the threshold value, the greater the resulting level of accuracy. This is in contrast to the effect of the threshold on the level of accuracy for detecting blank spaces indicated by the red line.
The Effect of Threshold Value on the Detection Result of Matos Location
120
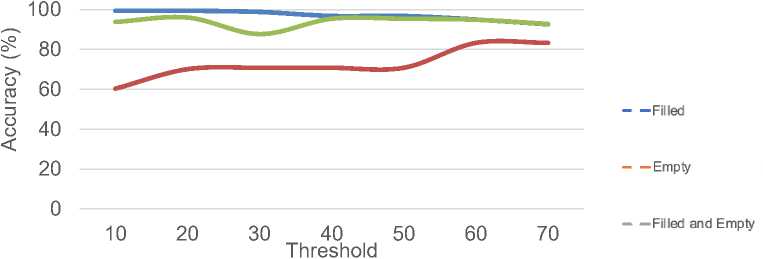
Figure 6. Line chart of the Threshold Effect on the Detection Result of Matos Parking Area
Data from previous journals, which were used for the testing process in this study, amounted to 18 data. The data is an image of an open car park. The data comes from CCTV in the morning, afternoon, and evening conditions. Figure 7 shows an example of data coming from [16].
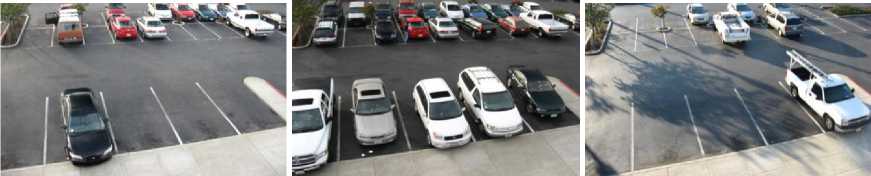
Figure 7. Example of data from Journal Data Sourced [16]
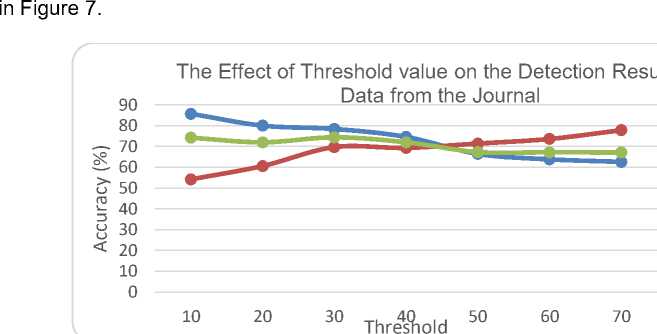
In testing data from journals [16], a threshold with a value of 10, 70, and 30 is used. Threshold 10 is the best threshold for detecting filled parking lots. The threshold of 70 is the best threshold to detect empty parking space, and the threshold of 30 is the best threshold to detect the entire
parking space. A graph depicting the significant effect of the threshold on the detection of a
parking space, whether filled, empty, or completely, on data sourced from journals can be seen
of
Figure 7. Line Chart of the Threshold Value Effect on Detection Results for Data from Journal
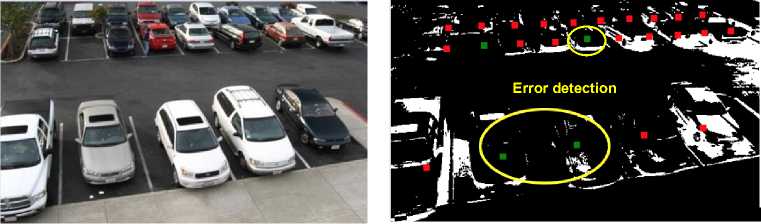
Figure 8. Illustration of an Occupied Parking Lot Detection Error
From Figure 7, it can be seen that the threshold of 10 produces the highest level of accuracy of 85.77% when it detects an occupied parking lot. The blue line on the graph shows that the greater the threshold value, the lower the resulting accuracy will be. The accuracy rate of 85.7% means that the system can detect a parking lot filled correctly by 85.7%, and the detection error is 14.3% of the total number of parking spaces. Several things can cause the detection error of a filled parking lot. One of them is the car's color, which tends to be dark or too light. When the vehicle detection and edge detection process is carried out for dark car colors like black, or those too bright like white, a binary image is generated with a predominance of black in the parking lot that should contain the car. This causes the number of white pixels in the parking lot containing black or white cars to be smaller than the predetermined threshold, so the system will show that the parking space is empty. An example of an error when detecting a parking lot filled with dark or light-colored cars can be seen in Figure 8.
From the line chart in Figure 7, it can also be seen that the highest level of accuracy when detecting an empty parking lot is 77.8%, with a threshold of 70. The 77.8% accuracy rate means that the system can detect a vacant parking lot correctly at 77, 8%, and a detection error of 22.4% of the total parking spaces. Several things can cause the system error detecting a parking space that should have been empty. One of them is the presence of noise in the form of car shadows hitting a vacant parking lot or a puddle of water in that place. If there is noise in the input image, the system will produce a binary image with many white pixels in the empty parking box when the edge detection process is carried out. So that when a selection is made using a predetermined threshold, the number of white pixels in the box will be greater than the threshold. So, the system will show that the parking space that should be empty is filled. An example of an error when detecting an empty parking space can be seen in Figure 9.
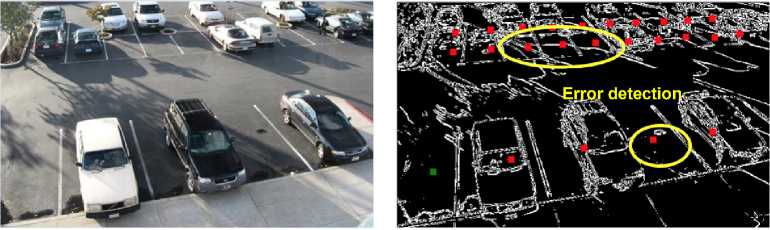
Figure 91. Illustration of an Empty Parking Lot Detection Error
The data used in the MOG parking lot is the image of an open parking area taken during daytime conditions, and the data used is 5 data. Based on the experiment, 10 is the best threshold to detect an occupied parking lot. Thresholds of 50, 60, and 70 are the best thresholds for detecting empty parking spaces, and the threshold of 30 is the best threshold for detecting the entire parking space. A graph depicting the significant effect of the threshold on the detection of parking spaces, whether filled, empty, or whole, on the data located in MOG can be seen in Figure 10.
From the graph in Figure 10, it can be seen that 70 produces the highest level of accuracy of 98% when detecting an empty parking space. The 98% accuracy rate means that the system can detect an empty parking lot correctly by 98% and an error detection rate of 2% from the total number of parking spaces. The effect of the threshold on the results of the detection of an empty parking space, namely, the larger the threshold value, the higher the accuracy result. Conversely, the higher the threshold value when detecting a filled parking lot, the lower the accuracy. The highest accuracy result for detecting an occupied parking lot is 68.2%. This means that the system can correctly detect the presence of an empty parking lot at 68.2% and an error rate of 31.8%.
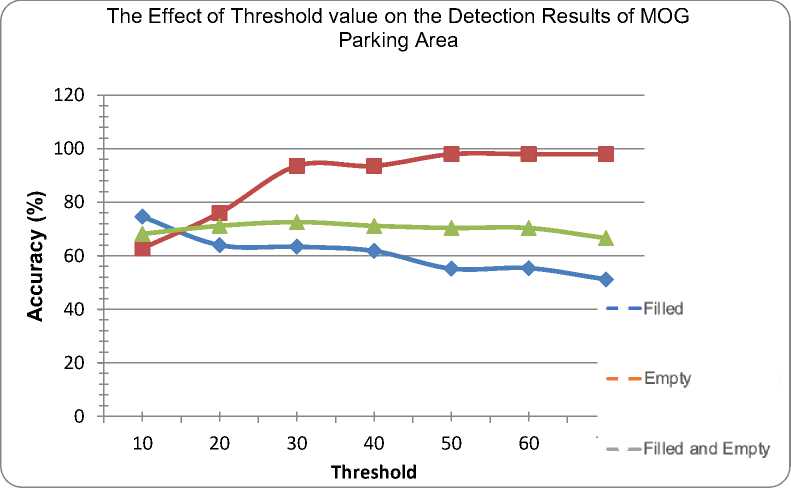
Figure 10. the Effect of Threshold on Detection Results for MOG Parking Areas
The system error when detecting the parking lot's condition at the MOG location is caused by several things. The parking lot is covered by trees located around it. When the vehicle detection process is carried out, an image with the dominance of black pixels will be generated in the parking lot, which should be covered by trees. The system will detect the place as an empty place. In addition, the detection error in the data of MOG parking is caused by the parking lot in the second row from the bottom having a significant slope. So that calculating the boundary for the parking box area in this row, a very small area will be produced. Therefore, the system will detect the box as empty, even though it is filled. Third, error detection is caused by drivers who do not park their cars according to the dividing line provided. There are several cars parked beyond the dividing line. This will cause the system incorrectly detects the parking lot conditions. An example of this error can be seen in Figure 11.
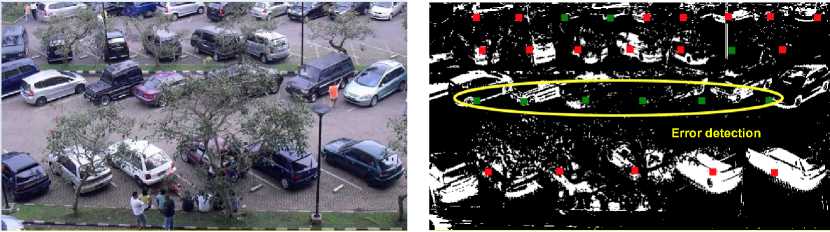
Figure 11. Example of Errors Detection at MOG Parking Area
The analysis results show that a good accuracy value is obtained when data collection is carried out at an angle parallel to the parking area, not in a sloping condition. From the three types of datasets used in the testing process, it can be seen that the best accuracy was obtained in the first experiment using the parking lot dataset at the Matos shopping center. When viewed in the second and third datasets, the parking lot image is taken with a certain inclination angle, making it difficult to determine the boundaries for each parking lot box. In addition, the second and third datasets have a lot of noise in most of their parking boxes, such as car shadows, areas blocked by large trees, and many people in the parking area, thus allowing these objects to be converted to white pixels during binarization process, so it is detected as a car object.
Based on the results and discussions of the experiments that have been carried out, several things can be concluded as follows: first, detecting empty spots in the car park by using vehicle detection and edge detection methods. The vehicle detection process consists of 3 processes, namely histogram equalization, image subtraction, and binarization. Meanwhile, the edge detection process consists of 5 stages: converting color images to grayscale, histogram equalization, median filtering, single edge detection, and binarization. The results of both stages are compared using the logical AND operator. The threshold used as a limit for determining parking space conditions in this study is 10, 20, 30, 40, 50, 60, and 70.
Second, the detection accuracy value varies depending on the threshold value. The highest detection accuracy value for detecting filled parking spaces is 99.4%, with a threshold of 10 with data located in Malang Town Square (Matos). The highest detection accuracy value for detecting vacant places is 98%, with a threshold of 50, 60, and 70 with data located at Mall Olympic Garden (MOG). Meanwhile, the highest detection accuracy value for the entire parking lot is 96%, with a threshold of 20 on the data located in Matos.
For further research, it is necessary to add a method to eliminate noise in the parking lot to reduce the detection error rate. In addition, the corner point search process during the initialization process can be developed automatically with one of the corner point algorithms to save time on initialization. And a more effective and efficient method can be developed to calculate the area of each parking lot box. This research is an initial study, which still uses image data taken manually (not using images from CCTV). It is hoped that this research can be developed in the next stage so that it is integrated with CCTV in real-time, and the detection results can be displayed on an information board that can be placed at the entrance area of the car park.
References
-
[1] S. Yamin Siddiqui, M. Adnan Khan, S. Abbas, and F. Khan, "Smart occupancy detection for road traffic parking using deep extreme learning machine," Journal of King Saud University - Computer and Information Science, vol. 34, no. 3, pp. 1–7, 2020, doi:
10.1016/j.jksuci.2020.01.016.
-
[2] R. Singh, C. Dutta, N. Singhal, and T. Choudhury, "An Improved Vehicle Parking Mechanism to reduce Parking Space Searching Time using Firefly Algorithm and Feed Forward Back Propagation Method," in Procedia Computer Science, 2020, vol. 167, no. 2019, pp. 952– 961, doi: 10.1016/j.procs.2020.03.394.
-
[3] G. F. Shidik, E. Noersasongko, A. Nugraha, P. N. Andono, J. Jumanto, and E. J. Kusuma, "A systematic review of intelligence video surveillance: Trends, techniques, frameworks, and datasets," c, vol. 7, pp. 170457–170473, 2019, doi: 10.1109/ACCESS.2019.2955387.
-
[4] T. Perković, P. Šolić, H. Zargariasl, D. Čoko, and J. J. P. C. Rodrigues, "Smart Parking Sensors: State of the Art and Performance Evaluation," Journal of Cleaner Production, vol. 262, 2020, doi: 10.1016/j.jclepro.2020.121181.
-
[5] T. Litman, Parking Management Strategies, Evaluation, and Planning. 2013.
-
[6] Faheem, S. A. Mahmud, G. M. Khan, M. Rahman, and H. Zafar, "A survey of intelligent car parking system," Journal of Applied Research and Technology, vol. 11, no. 5, pp. 714–726, 2013, doi: 10.1016/S1665-6423(13)71580-3.
-
[7] S. Han, Y. Han, and H. Hahn, "Vehicle detection method using Haar-like feature on real-time system," Internasional Journal of Electrical and Computer Engineering, vol. 59, pp. 455–459, 2009, doi: 10.5281/zenodo.1080822.
-
[8] P. R. L. De Almeida, L. S. Oliveira, A. S. Britto, E. J. Silva, and A. L. Koerich, "PKLot-A robust dataset for parking lot classification," Expert System with Application, vol. 42, no. 11, pp. 4937–4949, 2015, doi: 10.1016/j.eswa.2015.02.009.
-
[9] T. Fabusuyi and V. Hill, "Designing an integrated smart parking application," in
Transportation Research Procedia, 2020, vol. 48, no. 2019, pp. 1060–1071, doi:
10.1016/j.trpro.2020.08.133.
-
[10] R. C. Gonzalez, R. E. Woods, and P. Prentice Hall, Digital Image Processing Third Edition Pearson International Edition prepared by Pearson Education. 2008.
-
[11] I. Young, J. Gerbrands, and L. van Vliet, Fundamentals of Image Processing. 2009.
-
[12] M. Lopez, T. Griffin, K. Ellis, A. Enem, and C. Duhan, "Parking lot occupancy tracking through image processing," in Proceedings of 34th International Conference on Computers and Their Applications, CATA 2019, 2019, vol. 58, pp. 265–270, doi: 10.29007/69m7.
-
[13] Kuntz, "Canny Tutorial," 2006.
http://www.pages.drexel.edu/~nk752/Research/cannyTut2.html.
-
[14] A. W. and E. W. R. Fisher, S. Perkins, "Sobel Edge Detector," 2003.
https://homepages.inf.ed.ac.uk/rbf/HIPR2/sobel.htm.
-
[15] J. Liu, M. Mohandes, and M. Deriche, "A multi-classifier image based vacant parking detection system," IEEE International Conference on Electronics, Circuits and System, pp. 933–936, 2013, doi: 10.1109/ICECS.2013.6815565.
-
[16] N. True, "Vacant parking space detection in static images," Univ. California, San Diego, 2007, [Online]. Available: http://cseweb.ucsd.edu/classes/wi07/cse190-a/reports/ntrue.pdf.
-
[17] N. Longkumer, M. Kumar, and R. Saxena, "Contrast Enhancement Techniques using Histogram Equalization: A Survey," International Journal of Current Engineering and Technology, vol. 4, no. 3, pp. 1561–1565, 2014.
-
[18] M. Fang, G. Yue, and Q. Yu, "The study on an application of otsu method in canny operator," in International Symposium on Information, 2009, vol. 2, no. 4, pp. 109–112, [Online]. Available:
http://scholar.google.com/scholar?hl=en&btnG=Search&q=intitle:The+Study+on+An+Applic ation+of+Otsu+Method+in+Canny+Operator#0.
22
Discussion and feedback