Water and Air Quality Monitoring System based on the Internet of Things
on
LONTAR KOMPUTER VOL. 12, NO. 3 DECEMBER 2021
DOI : 10.24843/LKJITI.2021.v12.i03.p03
Accredited Sinta 2 by RISTEKDIKTI Decree No. 30/E/KPT/2018
p-ISSN 2088-1541
e-ISSN 2541-5832
Water and Air Quality Monitoring System based on the Internet of Things
Komang Try Wiguna Adhitya Primantaraa1, Putu Wira Bhuanaa2, Kyle Doranb3
Information Technology, Udayana University Bukit Jimbaran, Bali, Indonesia 1adhityaprimantara@student.unud.ac.id
2wbhuana@it.unud.ac.id(Corresponding author)
Mechatronics Engineering (Honours), Deakin University
Melbourne Burwood Campus, 221 Burwood Highway, Burwood, Victoria 3125, Australia
Abstract
Environmental pollution is a global issue that occurs at this time. It is caused by various human activities that produce pollutants that endanger their lives. By utilizing current technology, it is possible to design a Water and Air Quality Monitoring System based on the Internet of Things to monitor air and water quality quickly and in real-time in the surrounding environment. The users can access this system via the web and Android / IOS mobile applications that display the data obtained by the sensor in the form of real-time graphics of water and air conditions. In addition, this system consists of several sensor nodes in charge of providing field data regarding the parameters used as the basis for assessing water and air quality according to the applicable standards in Indonesia. Sensors for water using a Turbidity Sensor, DS18B20 Sensor, PH Sensor, DHT 11, and TDS (Total Dissolved Solids) Sensor. Sensors for air consist of the DHT11 sensor, the MQ-7 sensor, the MQ-135 sensor, and the dust sensor GP2Y1010AU0F.
Keywords: Water Quality, Air Quality, Internet of Things, Web, Android, IOS, Real-time
Environmental pollution is a global issue that occurs at this time. It is caused by various human activities that produce pollutants, commonly referred to as Man-made Pollution [1]. Pollution is defined as the introduction into the environment of substances harmful to humans, and other living organisms [2]. The most easily encountered pollution, especially in industrial and overpopulated areas, is Water and Air pollution. Likewise, in Indonesia, the public and the government often do not realize that the quality of the surrounding water and the air is getting worse. Thus, it can cause health problems due to the lack of Air Quality Monitoring Stations (AQMS) and water quality measurements by Badan Lingkungan Hidup (BLH) due to the limited tools they have. By utilizing current technology called the Internet of Things, it is possible to solve these problems. Internet of Things is a new paradigm that allows communication between electronic devices and sensors via an internet connection, which aims to simplify human life [3]. Water and Air Quality Monitoring System is designed to monitor air and water quality in real-time in the surrounding environment. The information can be accessed using a website or mobile application. Thus, the community and government can take preventive actions to avoid pollution and its impacts.
This system consists of several sensor nodes for providing data on the parameters used as the basis for assessing water and air quality under applicable standards in Indonesia. The air quality classification process uses Index Standard Pencemar Udara (ISPU). A number (does not have
units) describes the air quality conditions ambient in a definite location based on the impact on human health, aesthetic value, and other living things [4]. In our research, the ISPU value determines based on three primary pollutants, namely: Carbon Monoxide (CO), Nitrogen Dioxide (NO2), and Dust Particles (PM10). Classification of water quality in our research focuses on determining the suitability of drinking water and the need for Sanitary Hygiene. Drinking water is processed water or without processing suitable with health requirements and can be drunk directly [5]. Meanwhile, Water for Sanitary Hygiene Purposes is certain quality water used daily, in which its quality is different from the drink water quality [6]. Parameters used to determine water quality are PH, Temperature, Turbidity, and Total Dissolved Solids (TDS).
The sensor nodes for measuring water quality use a Turbidity Sensor to measure the water turbidity level, a DS18B20 Sensor to measure water temperature, a PH Sensor to measure acidity levels, and a TDS sensor to measure dissolved solids. The sensor nodes for measuring air quality consist of a DHT11 sensor to measure humidity and temperature, MQ-7 Sensor to measure levels of Carbon Monoxide, MQ-135 Sensor to measure levels of Nitrogen Dioxide, and Sensor GP2Y1010AU0F to detect dust particles (PM10). In addition to the sensor node, this tool is also equipped with an Arduino Uno microcontroller, equipped with a NEO-6M GPS sensor as a location marker. Data from sensor nodes with their location will send to the server via an internet connection accessed via ESP-8266.
The application of Internet of Things technology in the Air and Water Quality Monitoring Systems manufacture has been successfully applied in previous studies. Some of them use as a reference in this research.
Research on the Water Quality Monitoring System has been conducted by Hendrawati et al. [7] with the aim of monitoring pollution in river water caused by industrial activities. Water quality is measured based on three parameters obtained from the sensor node in the form of PH, turbidity, and water temperature. Data from the sensor node will send to the primary node using the nRF24L01 radio communication module. Then, the data will send to the server using ESP-8266, and the user can access information via the web and android application. Similar research has also been conducted by Waleed et al. [8] to provide community information about river water quality. The parameters measured by sensors are PH level, turbidity, and water temperature. Sensor input data will convert into valid sensor values and send to the server via Long Range Network (LoRa). Then the server will classify into three statuses, namely low, medium, and high, using the Fuzzy Logic Method to display on websites that can access by users. The difference between the two studies is that this study uses a TDS sensor to improve the classification results. The created system’s output can also provide information regarding the feasibility of using drinking water and sanitation based on standards that apply in Indonesia.
Research related to Air Quality Monitoring System has been carried out by Teguh et al. [9] to obtain air quality values in an area not covered by the Ministry of Environment and Forestry (KLHK) measurements. The design tool used uses the Node MCU ESP-8266 with IC4051 Analog Multiplexer addition as a microcontroller where the sensors used include MQ-7, Analog Infrared CO2, Dust Sensors (PM10), DHT -11, and Wind speed direction. Data from these sensors will send via an internet connection that has been accessed on the ESP-8266 to a third-party server, Ubidots, to perform data visualization. The data will display through the Ubidots website in the form of a graph of values. Then, the user can use the AQI and ISPU standards to perform the air-quality status classification process manually. Similar research was conducted by Hakim et al. [10] to overcome the problem of high air pollution in the city of Bandung. The sensors used in this tool are MQ-7 (CO), MQ-135 (NO), MQ-131 (O3) sensors, and DHT22 sensors (temperature and humidity) connected to the ATMega328 microcontroller. Then the data obtained by the sensor is sent using a SIM900A connection and monitored via the Thingspeak IoT platform. The difference between the two studies is that this study can display the results of air quality classification automatically and in real-time with ISPU standard calculations. In addition, information regarding air
quality will be displayed through websites and mobile applications with interactive displays so that they are easier to understand than using visualizations from third parties.
The water and air quality monitoring system in this study consists of two separate systems. Both also have a GPS sensor to provide a live location of the water quality monitoring tool. Data from this system will be displayed in real-time and can access by the public through the website or mobile application (Android/IOS). It can function independently, but the data is displayed on the same mobile application and website. In addition, this system is also equipped with a feature to display water and air conditions closest to the user’s location. With a more concise packaging, it expects that the tool can be used in more mobile. It is also supported by data transmission, simply using a personal hotspot from a mobile phone.
An overview system is the system flow description starting from the required input. Then, the input is processed to become information that the user can access. In addition, the system overview also displays the components involved in the running of the system processes. An overview of the Water and Air Quality Monitoring System based on the Internet of Things can see in figure 1.
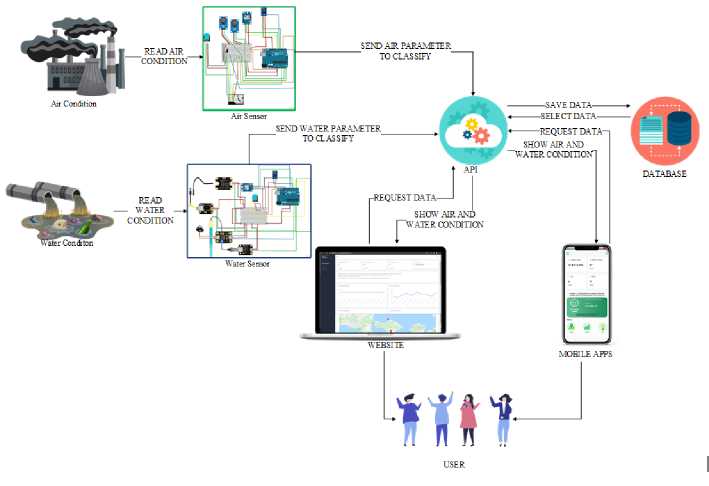
Figure 1. System Overview
Figure 1 Shows an overview of the Internet of Things-based Water and Air Monitoring System. The system works described in the general description are that devices connected to the internet can place in areas where water and air quality checks are carried out. When the tool can function stably, the data obtained by the water and air sensors will be sent to the server to be processed and stored in the database. Then the processed data is classified using ISPU standards, Water Quality Standards (Sanitation), and Drinking Water Quality Requirements. Further, water and air quality information will display via the web and mobile applications in real-time based on the nearest location or the location selected by the user.
The hardware design used in the Air and Water Quality Monitoring System consists of two modules, namely the water module and the air module. Each module has different and separate components so that both modules can use as mobile when they want to measure water and air quality in different places. The hardware design of this system can see in Figure 2 and Figure 3.
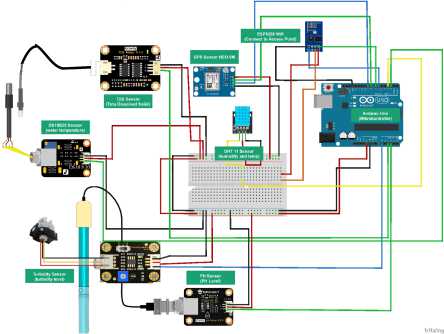
Figure 2. Design Hardware for Water Module
Figure 2 shows a hardware design for the water module. It consists of several sensor nodes whose task is to provide field data on the parameters used as a base to assess water and air quality under applicable standards in Indonesia. The water module uses a Turbidity Sensor to measure the level of turbidity, a DS18B20 sensor to measure water temperature, a DHT 11 sensor to measure air temperature, a PH sensor to measure acidity levels, and a TDS (Total Dissolved Solid) sensor to measure dissolved solids. Then, all these sensors will connect to the Arduino Uno microcontroller, and there is also an ESP-8266 as an internet connection to send data to the API. In addition, there is also a NEO 6M GPS sensor to get the location point of this module.
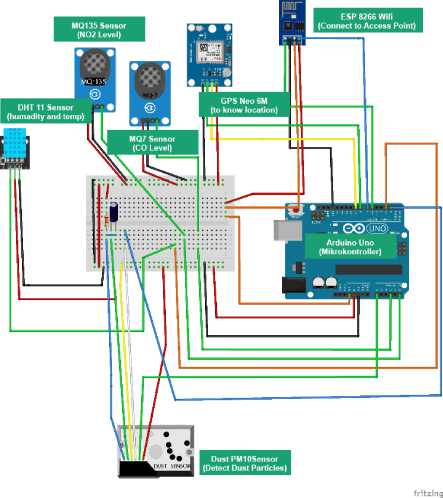
Figure 3. Design Hardware for Air Module
Figure 3 shows a hardware design on the air module. The air module consists of a DHT11 Sensor to measure humidity and temperature, an MQ-7 Sensor to measure Carbon Monoxide levels, an MQ-135 Sensor to measure Nitrogen Dioxide (NO2) levels, and a GP2Y1010AU0F Dust Sensor to detect particles (PM10). In addition to sensor nodes, each module is also equipped with an Arduino Uno microcontroller, equipped with a NEO-6M GPS sensor as a location marker. Data from sensor nodes with their location will send to the server via an internet connection accessed via ESP-8266.
The database used in this system uses a MySQL database because information can access in general, so it does not require a table to store user authentication. The database design used in this system can see in Figure 3.
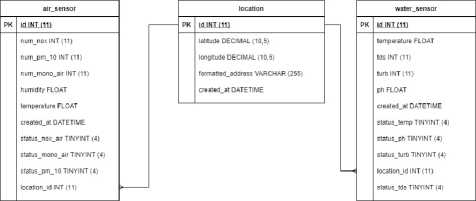
Figure 4. Design Database
Figure 4 shows a database design used in making this system. The database is specially designed to store processed data by the server so that the data stored in the database is ready to be displayed on the user side. The database consists of three tables, namely air, and water sensor, that generally store data from the sensor module, location, and date obtained by the tool. In addition, table location serves to keep location in the form of latitude, longitude, and complete addresses of measurements carried out on both the water and air modules.
Flowchart system to carry out the monitoring process of water and air quality starting from data read by sensors to information that can access by users via the web and mobile applications. This Air and Water Quality Monitoring System is designed to assess the quality of two variables where each variable certainly has its parameters and classification. The system flowchart can see in Figure 4 and Figure 5.
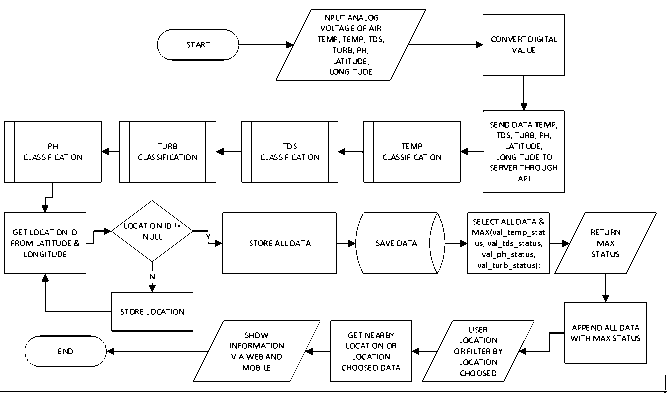
Figure 5. Water Flowchart
Figure 5 shows a flowchart to carry out the process of monitoring air quality. The initial process is marked by the input obtained by the water sensor node in the form of an analog voltage value, which will later be converted into the measurement result value on the Arduino Uno microcontroller and sent to the server via the API. The measurement results from the PH, Turbidity, TDS and Temperature sensors will be classified according to the Sanitation Water Quality Standards [6] and Drinking Water Quality Requirements [5]. The final status of the water that the end-user wants to test will look for the highest status of the four parameters. The user can select the
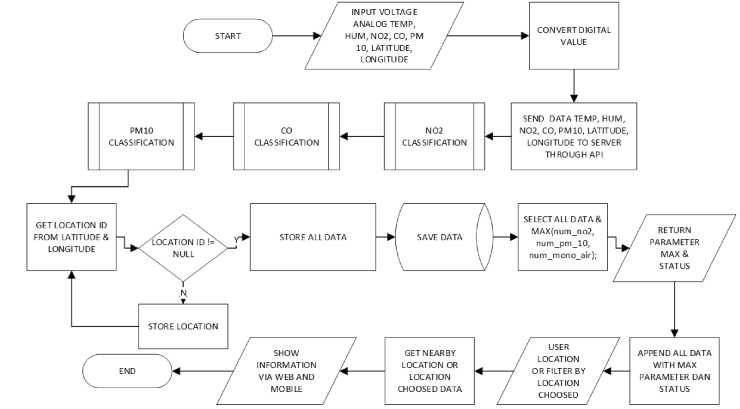
Figure 6. Air Flowchart
nearest measurement location or location when they open the web or mobile application for the first time.
Figure 6 shows a flowchart to carry out the process of monitoring air quality. The initial process is marked by the input obtained by the air sensor node in the form of an analog voltage value, which will later be converted into the measurement result value on the Arduino Uno microcontroller and sent to the server via the API. The value of the measurement results that will be used as a parameter in the ISPU calculation is only NO2, PM10, and CO. So that the three values will be processed first to be classified according to the ISPU calculation procedure [4]. After getting the status of each classified parameter, the data is stored in the database. Then the final status of the ambient air that the end user wants to test is obtained from the highest value of the ISPU parameter. When you open the web or mobile application for the first time, the user can select the nearest measurement location or location.
This section discusses the implementation results of hardware, web, mobile application, and system evaluation.
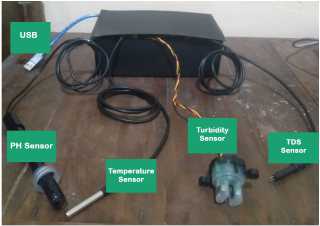
Figure 7. Hardware for Monitoring Water Quality
Figure 7 shows the design result of the water sensor IOT tool that has been packaged and ready to use. This tool has four sensor probes outside that will be inserted into the water to be tested, namely PH, temperature, turbidity, and TDS. After all sensor probes are inserted, plug in the device power via USB on the back using either an adapter or a power bank. If there is a connected WIFI connection, the value obtained will automatically be sent to the server and can view on the website or mobile application.
Figure 8 shows the design result of the air sensor IOT tool that has been packaged and ready to use. This tool has four sensor probes outside that will analyze the surrounding air quality, namely
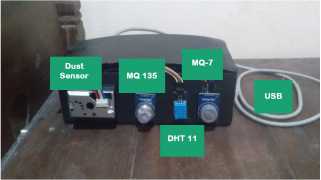
Figure 8. Hardware for Monitoring Air Quality
Dust Sensor (PM10), MQ-135 (NO2), DHT 11 (temperature and humidity ), and MQ- 7 (CO). Insert the device power via USB on the back using either an adapter or a power bank. If there is a connected WIFI connection, the value obtained will automatically be sent to the server and can view on the website or mobile application.
A website to display the results of water and air quality monitoring from the Internet of Things hardware was built using the Vue JS framework with the Javascript programming language. Besides speeding up the UI development process, the usage of this framework also can implement responsive two-way data binding through API and reduce repetitive development with reusable components to build an extensive system [11].The results of the website design can see in Figure 9 and Figure 10.
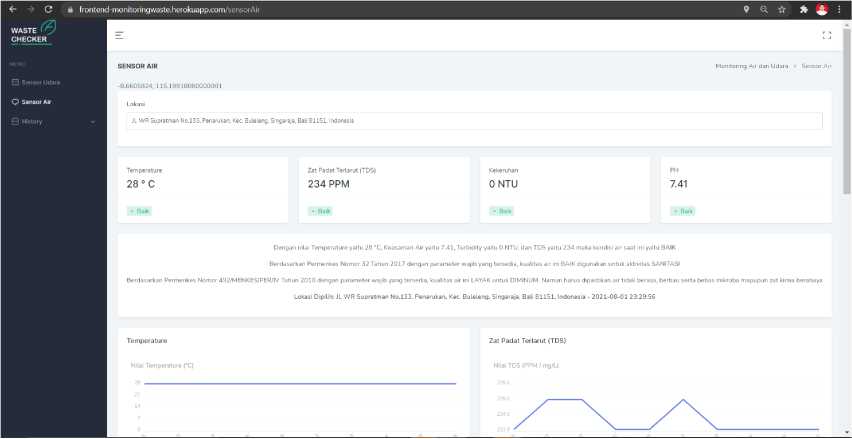
Figure 9. Dashboard Web for Water Sensor
Figure 9 shows the main page of the website in the water sensor menu section. The display consists of information on the latest values and status of the Temperature, TDS, Turbidity, and PH parameters as the water quality determinant according to water quality standards and drinking water requirements. Then, there is a conclusion regarding the highest value and the worst status of the parameter representing the overall water quality. In addition, there is also the status of water eligibility for sanitation and drinking activities.
Figure 10 shows the main page of the website in the air sensor menu section. The display consists of location filters and information on the latest values and status of the NO2, PM10, and CO parameters as a determinant of air quality according to the Air Pollutant Status Index (ISPU). There is a conclusion regarding the highest value and the worst status of the parameter representing the overall water quality status. The description and recommendations are based on the ISPU status obtained. Besides these parameters, the temperature and humidity values of the surrounding air are also displayed as additional information.
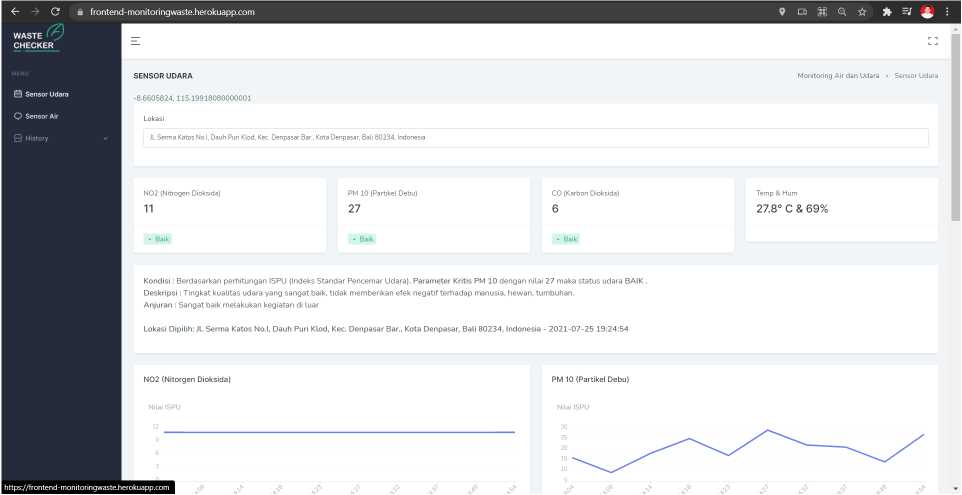
Figure 10. Dashboard Web for Air Sensor
A mobile application to display water and air quality monitoring results from the Internet of Things hardware was built using the Flutter framework with the Dart programming language to produce applications that can run on Android and IOS operating systems. Besides speeding up the development process, the usage of this framework also creates a more modern, responsive, nearly native performance and interactive display [12].
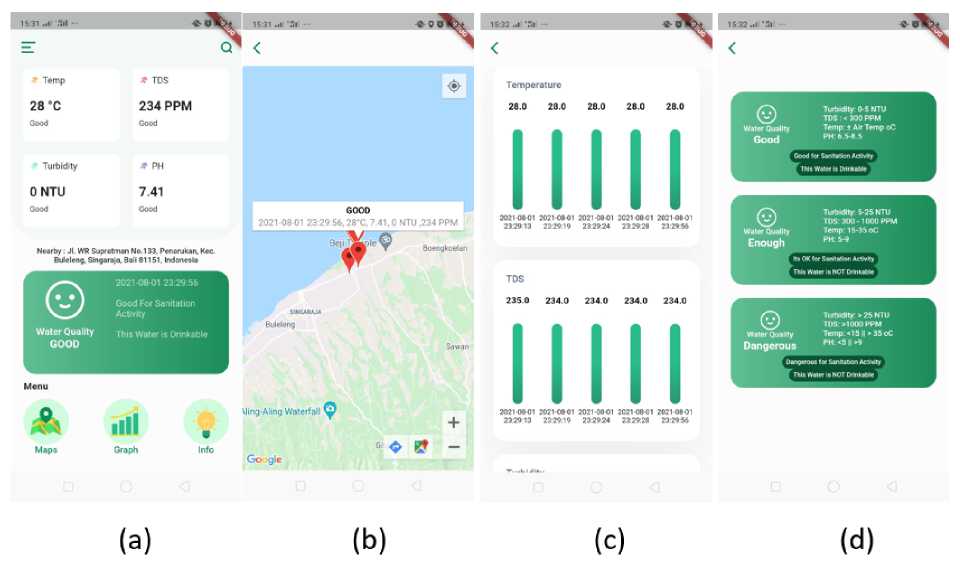
Figure 11. Mobile App for Water Sensor
Figure 11 shows Home Water Sensor (a). There is information about the values of temperature, TDS, Turbidity, and PH with the status obtained following water quality standards. The water quality status that will display is Good, Enough, and Dangerous. This status is made based on the Water Quality Standards for Sanitation and Drinking Water Requirements that apply in Indonesia. Description of the status and threshold of each parameter can be seen in Water Sensor Info in Figure 11. In addition, there is a card that shows the final status of water quality, location, time, and a brief description of water conditions. Maps Water Sensor (b) shows the latest location and data for water sensor testing. Graph Water Sensor (c) shows the last five data of each parameter is updated every 3 seconds. Water Sensor Info (d) shows a description of each water quality status with the threshold value.
Figure 12 shows Home Air Sensor (a), there is information about the values of temperature,
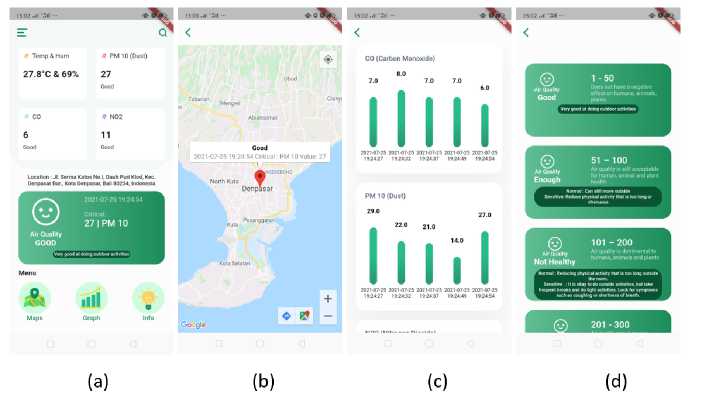
Figure 12. Mobile App for Air Sensor
humidity, PM10, CO, and NO2 along with the status obtained according to the ISPU. The air quality status that will display is Good, Enough, Not Healthy, Very Unhealthy, and Dangerous. In addition, there is a card that shows the final status of air quality, location, time, critical value, and a brief description of the air quality status. Maps Air Sensor (b) can display the latest location and data for air sensor testing. Graph Air Sensor (c) shows the last five data of each parameter updated every three seconds. Air Sensor Info (d) shows descriptions and recommendations for each air quality status with ISPU threshold values
Precision describes the uniformity and repeatability of measurements under the same conditions without significant variation in values [13]. The higher the precision level of the measuring instrument, the smaller the variation produced in each measurement. The precision test of the water and air sensors can see in table 1 and table 2.
Table 1. Table Result of Precision Testing Water Sensor
|
No |
PH |
TDS (PPM) |
Turb (NTU) |
Temp (°C) |
|
1 |
7.57 |
141 |
0 |
30 |
|
2 |
7.56 |
142 |
0 |
30 |
|
3 |
7.55 |
145 |
0 |
30 |
|
4 |
7.53 |
143 |
0 |
30 |
|
5 |
7.53 |
147 |
0 |
30 |
|
STDEV |
0.016 |
2.154 |
0 |
0 |
Table 1 shows the result of the precision test of the water sensor module in the residential environment. Based on the tests carried out five times, the results obtained are that each sensor can display values that tend to be stable with variations in the value of each measurement not too far away and a small standard deviation.
Table 2 shows the result of the precision test of the air sensor module in the residential environment. Based on the tests carried out five times, the results obtained are that each sensor can display values that tend to be stable with variations in the value of each measurement not too far away and a small standard deviation.
LONTAR KOMPUTER VOL. 12, NO. 3 DECEMBER 2021 p-ISSN 2088-1541
DOI : 10.24843/LKJITI.2021.v12.i03.p03 e-ISSN 2541-5832
Accredited Sinta 2 by RISTEKDIKTI Decree No. 30/E/KPT/2018
Table 2. Table Result of Precision Testing Air Sensor
|
No |
PM10 (µg/m3) |
CO (µg/m3) |
NO2 (µg/m3) |
Temp (°C) |
Hum (Percent) |
|
1 |
17.82 |
413.78 |
15.36 |
32.2 |
65 |
|
2 |
18.56 |
413.78 |
15.67 |
32.2 |
65 |
|
3 |
22.59 |
417.63 |
15.63 |
32.2 |
65 |
|
4 |
12.22 |
413.78 |
15.38 |
32.2 |
65 |
|
5 |
21.35 |
409.96 |
15.46 |
32.2 |
65 |
|
STDEV |
3.599 |
2.425 |
0.127 |
0 |
0 |
The sensor calibration test aims to ensure that the sensor used can display the value according to the actual standard measuring instrument. The calibration method used in this study is the Root Mean Square Error (RMSE) which is the magnitude of the error in the measurement results by comparing measurement results from sensor with standard tools. The smaller the RMSE value, the more accurate the measurement results will be [14]. The calibration test of the water and air sensors can see in tables 3 and 4.
Table 3. Table Result of Calibration Testing Water Sensor
|
No |
Parameter |
Range Error |
Total Data |
RSME |
|
1 |
PH |
(-0.04) - 0.08 |
12 |
0.048 |
|
2 |
TDS |
(-11) - 18 |
6 |
9.092 |
|
3 |
Turb |
(-19) - 0 |
9 |
11.503 |
|
4 |
Temp |
0 - 0.38 |
12 |
0.219 |
Table 3 shows the result of the water sensor calibration process with actual measuring instruments. In this calibration process, the tested liquid is varied to get maximum calibration results. Then the results obtained show the range of measurement errors on the sensor with measuring instruments for each parameter is relatively small, so the RMSE value is relatively small. It shows that all sensors can perform measurements close to the standard measuring instrument.
Table 4. Table Result of Calibration Testing Air Sensor
|
No |
Parameter |
Range Error |
Total Data |
RSME |
|
1 |
NO2 |
- |
- |
- |
|
2 |
PM10 |
(-3) - 7 |
10 |
2.966 |
|
3 |
CO |
0-2 |
10 |
1.048 |
|
4 |
Temp |
0.7 - 0.9 |
10 |
0.824 |
|
5 |
Hum |
(-2) - 1 |
10 |
1.923 |
Table 4 shows the result of the air sensor calibration process with Denpasar ISPU data and a digital thermometer. In this process, calibration conducts using processed sensor values into ISPU values on CO and PM10 sensors. Because NO2 data is not available on the Denpasar ISPU website, this parameter does not calibrate. The calibration results show that all the measurement error range parameters are not far from the standard measurement data, and the resulting RMSE value is relatively small. It indicates that all air sensors can perform measurements close to standard gauges.
This test aims to ensure that websites and mobile applications can run well with capable indicators of displaying the value obtained by the hardware to be processed into information. Thus, the user can understand it. Software testing used in this research is Black-box testing. Black-box testing
is a software testing method that focuses on application functionality from the user side, so no special knowledge is required in conducting this test [15]. The results of Black-box testing can see in table 5.
Table 5. Table Result of Blackbox Testing
|
No |
Feature |
Test Result |
|
1 |
The website displays the latest sensor data, status, and conclusions. |
Success |
|
2 |
The website displays a graph of the ten most recent sensor data. |
Success |
|
3 |
The website displays a history page based on filters. |
Success |
|
4 |
The website displays maps with markers. |
Success |
|
5 |
The mobile application displays the latest sensor data, status, and conclusions. |
Success |
|
6 |
The mobile app displays a graph of the latest five sensor data. |
Success |
|
7 |
The mobile application displays maps with markers. |
Success |
|
8 |
The mobile application displays detailed information. |
Success |
Table 5 is the result of Black-box testing, where all the features tested were successfully run on the mobile application and website.
The overall system testing is carried out at several locations to ensure that the tools that have been made have succeeded in obtaining data from water and air quality, which is then displayed through web and mobile applications. Table 6 shows testing the water quality monitoring system. Of the four samples tested, the system successfully displays data and water quality status. The sea and brackish waters have a hazardous status for sanitation and are unfit for drinking because of their very high dissolved solids (TDS) content. Table 7 shows the results of testing the air quality monitoring system. Of the four samples tested, the system successfully displays data and air quality status. The air near the motor has an "ENOUGH" ISPU status due to high CO levels.
Table 6. Table result of Monitoring System Testing for Water Quality
|
Location |
Type |
PH |
TDS |
Turb |
Temp |
Sanitation |
Drinkable |
|
Jl. WR Supratman |
Mineral Water |
7.57 |
145 |
0 |
30 |
Good |
Yes |
|
Jl. WR Supratman |
PDAM Water |
7.41 |
234 |
0 |
28 |
Good |
Yes |
|
Jl. Pantai Kerobokan |
Sea Water |
8.26 |
1158 |
0 |
28 |
Dangerous |
No |
|
Jl. Pantai Kerobokan |
Brackish Water |
8 |
1158 |
0 |
28 |
Dangerous |
No |
Table 7. Table result of Monitoring System Testing for Air Quality
|
Location |
type NO2 PM10 CO Temp Hum ISPU Status |
|
Jl. WR Supratman Jl. WR Supratman Jl. Serma Katos Jl. Mataram |
Near Motorcycle 11 65 68 31.7 65 Enough/CO/68 Normal 11 15 7 31.7 65 Good/PM10/15 Normal 11 27 6 27.8 69 Good/PM10/27 Normal 11 13 7 29.4 62 Good/PM10/13 |
This research can overcome the problem of the lack of location of air quality monitoring stations and water quality measurements carried out by Badan Lingkungan Hidup (BLH). In monitoring air quality, this tool can measure three ISPU parameters, namely NO2, PM10, and CO, while in water, it can measure four parameters, namely Temperature, PH, Turbidity, and TDS. In addition, it
makes it easier for the public to know the quality of water and air around them through mobile applications or websites. The information displayed is complete with a description of the conditions, problematic parameters, and a map feature to determine the measurement location.
References
-
[1] R. R. Appannagari, “Environmental Pollution Causes and Consequences: A Study,” NAIRJC : A Journal Of Social Science and Humanities, vol. 3, 2017.
-
[2] M. Ioannis, S. Elisavet, S. Agathangelos, and B. Eugenia, “Environmental and Health Impacts of Air Pollution: A Review,” Frontiers in Public Health, vol. 8, p. 14, 2020.
-
[3] S. Kumar, P. Tiwari, and M. Zymbler, “Internet of Things is a revolutionary approach for future technology enhancement: a review,” J Big Data, vol. 6, p. 111, 2019.
-
[4] Menlhk. Indeks standar pencemar udara. [Online]. Available: http://jdih.menlhk.co.id
-
[5] Menkes. Persyaratan kualitas air minum. [Online]. Available: https://www.mapurna.id
-
[6] Kemkes. Peraturan menteri kesehatan republik indonesia nomor 32 tahun 2017. [Online]. Available: http://hukor.kemkes.go.id
-
[7] T. D. Hendrawati, A. R. A. Tahtawi, and F. Fadilah, “Sistem monitoring pencemaran air sungai berbasis teknologi sensor nirkabel dan internet of things,” in Proc. IRWNS POLBAN 2019, vol. 10, 2019, pp. 286–292.
-
[8] K. Waleed, P. Daru, and C. Setianingsih, “Sistem pemantauan dan klasifikasi kondisi pencemaran air sungai dengan metode fuzzy logic,” in Proc. e-Proceeding of Engineering 2019, vol. 6, 2019, pp. 1604–1610.
-
[9] R. Teguh, E. D. Oktaviyani, and K. A. Mempun, “Rancang Bangun Desain Internet Of Things untuk Pemantauan Kualitas Udara pada Studi Kasus Polusi Udara,” Jurnal Teknologi Informasi, vol. 12, no. 2, 2018.
-
[10] T. N. Hakim and M. F. Susanto, “Sistem monitoring kualitas udara berbasis internet of things,” in Proc. IRWNS POLBAN 2020, vol. 11, Bandung, 2020, pp. 496–502.
-
[11] J. Song, M. Zhang, and H. Xie, “Design and implementation of a vue.js-based college teaching system,” International Journal of Emerging Technologies in Learning (iJET), vol. 14, p. 59, 07 2019.
-
[12] Mamoun, Ragda and Nasor, Mohamed and Abulikailik, Sahar H., “Design and Development of Mobile Healthcare Application Prototype Using Flutter,” in 2020 International Conference on Computer, Control, Electrical, and Electronics Engineering (ICCCEEE), 2021.
-
[13] S. Budiantono, S. M. Retnaningsih, and D. F. Aksioma, “Measurement System Analysis Repeatability dan Reproducibility (Gauge R and R) pada Alat Vickers Hardness Tester Di PT Jaykay Files Indonesia,” JURNAL SAINS DAN SENI ITS, vol. 5, no. 2, 2016.
-
[14] R. Waliyansyah and N. D. Saputro, “Forecasting New Student Candidates Using the Random Forest Method,” Lontar Komputer : Jurnal Ilmiah Teknologi Informasi, vol. 11, no. 1, 2020.
-
[15] M. Y. Mahendra, I. N. Piarsa, and D. P. Githa, “Geographic Information System of Public Complaint Testing Based On Mobile Web (Public Complaint) ,” Lontar Komputer : Jurnal Ilmiah Teknologi Informasi, vol. 9, no. 2, 2018.
162
Discussion and feedback