Customer Segmentation Based on RFM Model Using K-Means, K-Medoids, and DBSCAN Methods
on
LONTAR KOMPUTER VOL. 11, NO. 1 APRIL 2020
DOI : 10.24843/LKJITI.2020.v11.i01.p04
Accredited B by RISTEKDIKTI Decree No. 51/E/KPT/2017
p-ISSN 2088-1541
e-ISSN 2541-5832
Customer Segmentation Based on RFM Model Using K-Means, K-Medoids, and DBSCAN Methods
Rahma Wati Br Sembiring Berahmanaa1, Fahd Agodzo Mohammedb2, Kankamol Chairuangc3
aDepartment of Information Technology, Udayana University Bukit Jimbaran, Bali, Indonesia 1rahmabrahmana28@gmail.com
bDepartment of Computer Engineering, Chandigarh University NH-95, Ludhiana – Chandigarh State Hwy, Punjab, India 2fahdmoh.1@gmail.com
cDepartment of Business Administration, Chandigarh University NH-95, Ludhiana – Chandigarh State Hwy, Punjab, India 3smilekankamol@hotmail.com
Abstract
A problem that appears in marketing activities is how to identify potential customers. Marketing activities could identify their best customer through customer segmentation by applying the concept of Data Mining and Customer Relationship Management (CRM). This paper presents the Data Mining process by combining the RFM model with K-Means, K-Medoids, and DBSCAN algorithms. This paper analyzes 334,641 transaction data and converts them to 1661 Recency, Frequency, and Monetary (RFM) data lines to identify potential customers. The K-Means, K-Medoids, and DBSCAN algorithms are very sensitive for initializing the cluster center because it is done randomly. Clustering is done by using two to six clusters. The trial process in the K-Means and K-Medoids Method is done using random centroid values and at DBSCAN is done using random Epsilon and Min Points, so that a cluster group is obtained that produces potential customers. Cluster validation completes using the Davies-Bouldin Index and Silhouette Index methods. The result showed that K-Means had the best level of validity than K-Medoids and DBSCAN, where the Davies-Bouldin Index yield was 0,33009058, and the Silhouette Index yield was 0,912671056. The best number of clusters produced using the Davies Bouldin Index and Silhouette Index are 2 clusters, where each K-Means, K-Medoids, and DBSCAN algorithms provide the Dormant and Golden customer classes.
Keywords: Customer Segmentation, RFM Model, K-Means, K-Medoids, DBSCAN
The main goal of the company is to strengthen the relationship between one customer with another customer to get a significant profit in the market competition. This showing that companies must develop skills in identifying customers and providing customer requirements [1]. Distribution companies need to produce management that can identify the best customers and tasks with increasing the company's understanding of customer needs so that company loyalty can be maintained [2]. Customer Relationship Management (CRM) can support the customer segmentation process by implementing appropriate marketing strategies so that companies can identify the quality and behavior of customers. Customer segmentation is the process of dividing customers into groups based on past data with the demands, characteristics, and the same functioning [3]. Customer segmentation analysis of company transaction data is done to find profitable customers. The first thing to do is to change company data to Present Value, Frequency, and Monetary (RFM). RFM is a method used to analyze customer behavior, such as how recently a customer buys (Current), how often a customer buys (Frequency), and how much money a customer spends in conducting transactions (Monetary). The RFM Model
attribute explained by linguistic variables. For example, the linguistic variable from Recency is defined using the terms 'old' and 'very new,' the Frequency attribute is explained using the terms 'rarely' and 'often,' and the Monetary attribute explained using the terms 'low' and 'high' values [4]. K-Means, K-Medoids, and DBSCAN are algorithms with RFM models used in this study. These three methods are often used to segment customers because they are easy to understand. Also, three methods are applied in customer segmentation research to determine the diversity of customer classes and to get the best customer class so that companies can use it. K-Means algorithm is sensitive to outliers because of objects with tremendous values. It can substantially distort data distribution, to take the average amount of an object in a cluster as a reference point, a medoid can be used, which is the object in a cluster that is most centralized [5]. The basic strategy of the K-Medoids grouping algorithm is to find k clusters in n objects by first arbitrarily finding representatives of objects (medoid) for each cluster [6]. The DBSCAN method uses the minimum input point parameters (minpts) and epsilon (eps). The process of determining parameter values is trial and error, which means that the determination of parameter values must be tested several times to obtain several clusters [7]. This research explains the transaction data of companies employed in food and beverage distribution. Data transactions generate segmentation of potential customers using the K-Means, K-Medoids, and DBSCAN methods. The results of customer segmentation obtained will be used by the company to find out potential customers in the company so that the company can provide the best service to all customers based on the needs of each customer.
Customer segmentation is done by inputting annual transaction data from January 2013 to December 2018, consisting of 334,641 rows of data.
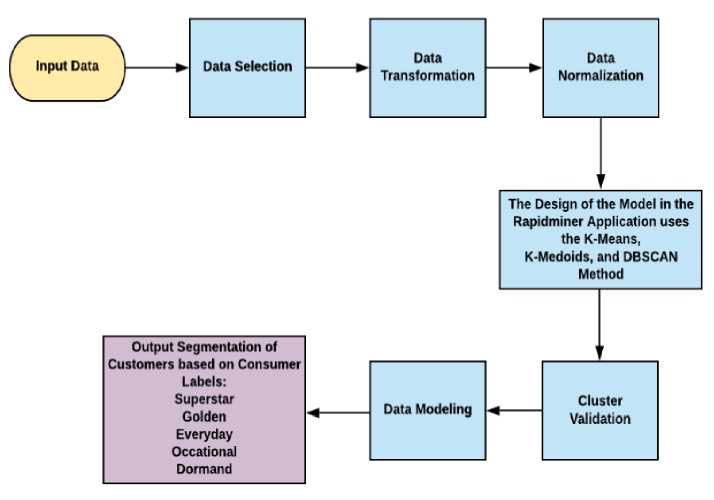
Figure 1. Research Flow
Figure 1 is a general description of the system for customer segmentation, where the data used are sales transaction data of PT. Cimory from January 2013 to December 2018. This paper analyzes 334,641 transaction data and converts them to 1661 Recency, Frequency, and Monetary (RFM) data lines to identify potential customers. The data selection process based on the characteristics of the RFM model. Namely, the creation attribute, the value of the difference between the date of the last transaction and the date of the segmentation process, the frequency attribute is the number of transactions made by customers, and the monetary attribute is the total transactions made by customers. The data transformation process is a
transaction data process that has gone through the data selection stage to converted into the RFM model. The data that is transformed will be normalized to produce values with a range that is not too far away so that the results are more optimal. The clustering model design is performed on the RapidMiner Application using the K-Means, K-Medoids, and DBSCAN methods. In this paper, three methods work to form the optimal consumer class for use in distribution companies. The group validation process is done using the Davies-Bouldin Index and the Silhouette Index Method. Then the data modeling process is based on the results obtained from the data modeling process. The results of clustering will group data based on five customer labels, namely Superstar, Golden, Every Day, Occasional and Dormant.
Normalization is part of data transformation that used to convert data into values that are easily understood. Normalization is used to improve the accuracy of numerical calculation processes with data scales in the range of 0 to 1 [8]. This study uses the min-max normalization technique, with the following equation.
-
X- minA
X′ = (new_maxA - new_minA) + new_minA (1)
maxA - _ _ _
X is the actual data, minA is the lowest actual data, maxA is the highest actual data, new_maxA is the highest data scale that is 1, and new_minA is the lowest data scale, where the lowest data scale is 0 [9].
-
2.2 Clustering
This paper uses the K-Means, K-Medoids, and DBSCAN algorithms to group data. The use of the K-Means algorithm is very sensitive to initialize the cluster center because it is done randomly [10]. The K-Means algorithm uses the average value as the center of the cluster. The following are the steps for the K-Means algorithm.
-
a. Choose the k value as the center of the initial cluster at random.
-
b. Each data divided into k clusters and cluster centers obtained using Euclidean Distance.
d-euc = (Zi - ^i ) " (2)
Z->i=o
-
c. Each cluster center is recalculated based on the average value in the cluster obtained.
-
d. Repeat steps two and three if there are changes to the cluster group. The process will stop if there are no changes to the cluster.
The K-Medoids algorithm applies objects as representatives (medoid) for each cluster. The application of the K-Medoids algorithm takes longer than K-Means because it takes about 2 minutes on Rapidminer, while the K-Means method only takes about 1 second [11]. The steps to complete the K-Medoids algorithm are as follows.
-
a. Initialize the center of the cluster with the number of clusters (k).
-
b. Each data or object is allocated to the nearest cluster using Euclidian Distance.
-
c. Randomly select objects in each cluster as new medoid candidates.
-
d. Calculate the distance of each object contained in each cluster with the new medoid candidate.
-
e. Calculate the total deviation (S) by calculating the total new distance value - the total old distance. If S <0 is obtained, exchange the object with the data cluster to create a new set of k objects as a medoid.
-
f. Repeat steps three into five until there are no changes to the medoid so that clusters and cluster members are obtained.
DBSCAN is a grouping method that builds clusters based on density, clusters that are not included in the object are considered noise. The practice of DBSCAN requires a very long time
because the use of this method is done by searching epsilon and min points randomly to get a particular cluster [12]. The steps to complete the DBSCAN algorithm are as follows.
-
a. Initializing min parameters, eps parameters.
-
b. Specify the starting point or p randomly.
-
c. Repeat steps 3 - 5 until all points have been processed.
-
d. Calculate eps or all distance points whose density can be reached up to p.
-
e. If the point that fits eps is more than a small point, then the point p is the core point, and
the group is formed.
-
f. If p is a border point and there is no point whose density can be reached p, then the process continues to another point.
Clusters are formed through the process of data modeling. Data modeling complete by comparing the average of each cluster with a range of RFM values so that the class of each cluster can be found. Each variable R, F, and M has three linguistic variables and domain values [13]. Linguistic variables and domain values for each mean are shown in Table 1.
Table 1. Range of RFM Domain Value Values
|
Attribute |
Linguistic Variable |
Value Random |
|
Recency |
Recently Rather Long Time Long Time |
0 ≤ r ≤ 900 day 901 hari < r < 1800 day 1801 day < r |
|
Frequency |
Seldom Rather Often Often |
0 ≤ f ≤ 1500 trx 1501trx < f < 3000 trx 3001trx < f |
|
Monetary |
Low Medium High |
0 ≤ m ≤ 50000000 rupiah 50000001 rupiah < m < 5000000000 rupiah 5000000001 rupiah < m |
Each class in the RFM model has a client label that states the characteristics of each customer class [14]. Class descriptions for each cluster can be seen in Table 2.
Table 2. Description of Linguistic Variables from Consumer Labels
|
Descriptions of Linguistic Variable |
Class | ||
|
Recency |
Frequency |
Monetary | |
|
Recently |
Seldom |
Low |
Dormant D |
|
Recently |
Seldom |
Medium |
Dormant A |
|
Recently |
Seldom |
High |
Occational A |
|
Recently |
Rather Often |
Low |
Everyday D |
|
Recently |
Rather Often |
Medium |
Golden D |
|
Recently |
Rather Often |
High |
Superstar D |
|
Recently |
Often |
Low |
Everyday A |
|
Recently |
Often |
Medium |
Golden A |
|
Recently |
Often |
High |
Superstar A |
|
Rather Long Time |
Seldom |
Low |
Dormant E |
|
Rather Long Time |
Seldom |
Medium |
Dormant B |
|
Rather Long Time |
Seldom |
High |
Occational B |
|
Rather Long Time |
Rather Often |
Low |
Everyday E |
|
Rather Long Time |
Rather Often |
Medium |
Golden E |
|
Rather Long Time |
Rather Often |
High |
Superstar E |
|
Rather Long Time |
Often |
Low |
Everyday B |
|
Rather Long Time |
Often |
Medium |
Golden B |
|
Rather Long Time |
Often |
High |
Superstar B |
|
Long Time |
Seldom |
Low |
Dormant F |
|
Long Time |
Seldom |
Medium |
Dormant C |
|
Long Time |
Seldom |
High |
Occational C |
|
Long Time |
Rather Often |
Low |
Everyday F |
|
Long Time |
Rather Often |
Medium |
Golden F |
|
Long Time |
Rather Often |
High |
Superstar F |
|
Long Time |
Often |
Low |
Everyday C |
|
Long Time |
Often |
Medium |
Golden C |
|
Long Time |
Often |
High |
Superstar C |
Based on Table 2, there are five customer classes. The most loyal customer with the highest value is called Superstar. The second highest value customer is called Golden. The customer with the second lowest-highest value is called Occasional. Every day customers are customers with an increasing number of low transactions. Customers with Dormant class are customers who have the lowest transaction value.
Clustering was tested with the K-Means, K-Medoids, and DBSCAN method to form 2 clusters until 6 clusters. Below are some of the results of the experiments.

Figure 2. K-Means 2 Cluster Results
Figure 2 shows the results of clustering using the K-Means with the parameter value k = 2. The results of the segmentation of the formation of 2 clusters using K-Means are shown in Table 3. The results of the formation of 2 clusters produce two customer classes, namely Dormant A and Dormant C.
|
Table 3. Segmentation Results Using the RFM Model (Results of the K-Means Method) | ||||
|
Number of Clusters |
Customer Value (%) |
Linguistic Variable (R, F, M) |
Customer Class | |
|
1 |
30 % |
R |
550.056 Recently |
Dormant A |
|
F |
879.57 Seldom | |||
|
M |
1937070868.21 Medium | |||
|
2 |
70 % |
R |
1624.364 Long Time |
Dormant C |
|
F |
626.24 Seldom | |||
|
M |
1899458494.07 Medium | |||

Figure 3. Results of the K-Medoids 2 Cluster
Figure 3 shows the results of clustering using the K-Medoids with the parameter value k = 2. The results of the segmentation of the formation of 2 clusters using K-Medoids are shown in Table 4. The results of the formation of 2 clusters produce two customer classes, namely Dormant A and Dormant C.
|
Table 4. Segmentation Results Using the RFM Model (K-Medoids Mehod Results) | |||
|
Number of Clusters |
Customer Value (%) |
Linguistic Variable (R, F, M) |
Customer Class |
|
1 |
30 % R F M |
525.988 Recently 572.446 Seldom 1880652307 Medium |
Dormant C |
|
2 |
70 % R F M |
137.12 Recently 691.048 Seldom 1955877055 Medium |
Dormant A |
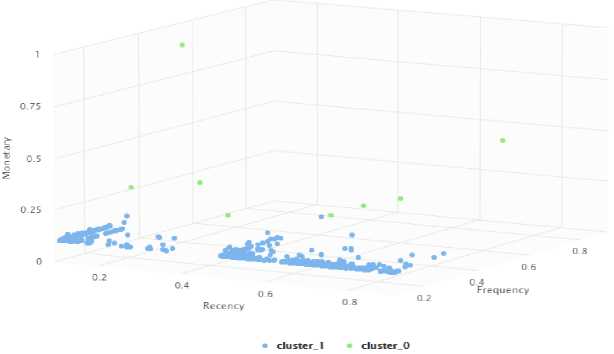
Figure 4. Results of DBSCAN Eps 0.2 and Min Points 500
Figure 4 shows the results of clustering using the DBSCAN Method with eps parameter values of 0.2 and min points 500. The results of the segmentation of the formation of 2 clusters using DBSCAN are shown in Table 5. The results of the formation of 2 clusters produce two customer classes, namely Dormant B and Golden B.
|
Table 5. Segmentation Results Using the RFM Model (DBSCAN Method Results) | |||
|
Number of Clusters |
Customer Value (%) |
Linguistic Variable (R, F, M) |
Customer Class |
|
1 |
0.5 % R F M |
1046.732 Rather Long Time 3230.209 Often 5453827850 Medium |
Golden B |
|
2 |
99 % R F M |
1298.352 Rather Long Time 691.048 Seldom 1899458494 Medium |
Dormant B |
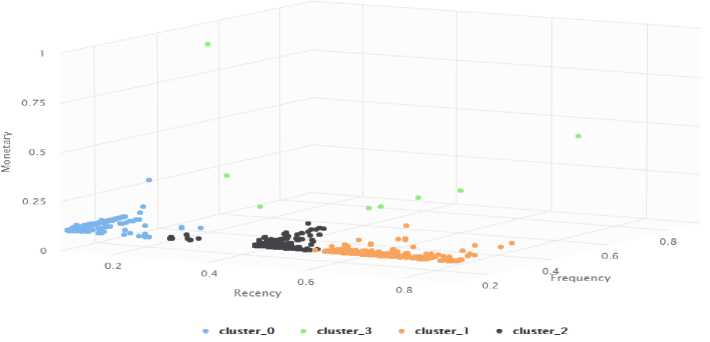
Figure 5. K-Means 4 Cluster Results
Figure 5 shows the results of clustering using the K-Means Method with the parameter value k = 4. The results of the segmentation of the formation of 4 clusters using K-Means are shown in Table 6. The results of the formation of 4 clusters produce four customer classes, namely Dormant A, Dormant B, Dormant C, and Golden B.
Table 6. Segmentation Results Using the RFM Model (K-Means Method Results)
|
Number of Clusters |
Customer Value Linguistic Variable Customer Class (%) (R, F, M) |
|
1 |
29 % R 543.492 Dormant A Recently F 868.951 Seldom M 1918264681 Medium |
|
2 |
31 % R 1882.548 Dormant C Long Time |
|
F |
604.792 Seldom | |||
|
M |
1899458494 Medium | |||
|
3 |
38 % |
R |
1403. 376 Rather Long Time |
Dormant B |
|
F |
626.356 Seldom | |||
|
M |
1899458494 Medium | |||
|
4 |
0.5 % |
R |
1153.944 Rather-Long Time |
Golden B |
|
F |
3300.29 Often | |||
|
M |
5209347418 (Medium) |

Figure 6. Results of the K-Medoids 4 Cluster
Figure 6 shows the results of clustering using the K-Medoids Method with the parameter value k = 4. The results of the segmentation of the formation of 4 clusters using K-Medoids are shown in Table 7. The results of the formation of 4 clusters produce four customer classes, namely Dormant A, Dormant B, Dormant C, and Golden A.
Table 7. Segmentation Results Using the RFM Model (Results of the K-Medoids Method)
|
Number of Clusters |
Customer Value Linguistic Variable Customer Class (%) (R, F, M) |
|
1 |
21 % R 523.8 Golden D Recently F 2739.567 Rather Often M 1880652307 Medium |
|
2 |
31 % R 1967.88 Dormant C Long Time |
|
F |
572.446 Seldom | |||
|
M |
1880652307 Medium | |||
|
3 |
8 % |
R |
525. 988 Recently |
Dormant A |
|
F |
572.446 Seldom | |||
|
M |
1880652307 Medium | |||
|
4 |
38 % |
R |
1377.12 Rather-Long Time |
Dormant B |
|
F |
691.048 Seldom | |||
|
M |
1955877055 Medium |

Figure 7. DBSCAN Eps Method Results in 0.125 and Min Points 2
Figure 7 shows the results of clustering using the DBSCAN Method with eps parameter values of 0.125 and min points 2. The results of the segmentation of the formation of 4 clusters using DBSCAN are shown in Table 8. The results of the formation of 4 clusters produce four customer classes, namely Dormant A, Dormant A, Golden B, and Golden E.
Table 8. Segmentation Results Using the RFM Model (DBSCAN Method Results)
|
Number of Clusters |
Customer Value (%) |
Linguistic Variable (R, F, M) |
Customer Class | |
|
1 |
21 % |
R |
998.596 |
Golden B |
|
Rather Long Time | ||||
|
F |
3305.683 | |||
|
Often | ||||
|
M |
5829951592 | |||
|
Medium | ||||
|
2 |
31 % |
R |
552.244 |
Dormant A |
|
Recently | ||||
|
F |
863.56 | |||
|
Seldom | ||||
|
M |
1899458494 | |||
Medium
|
3 8 % R |
1624.364 Dormant C Long Time |
|
F |
615.574 Seldom |
|
M |
1899458494 Medium |
|
4 38 % R |
1392.436 Golden E Rather Long Time |
|
F |
2588.68 Rather Often |
|
M |
2588.68 Rather Often |
In the Davies Bouldin validity index, the optimum number of clusters is the number of clusters that have the smallest Davies Bouldin index value [15], while in the Silhouette validity index the optimum amount of clusters is the number of clusters that have the largest Silhouette index value [16]. Figures 8, 9, and 10 show the DBI index and Silhouette Index values displayed
graphically for the K-Means,
K-Medoids, and DBSCAN algorithms.
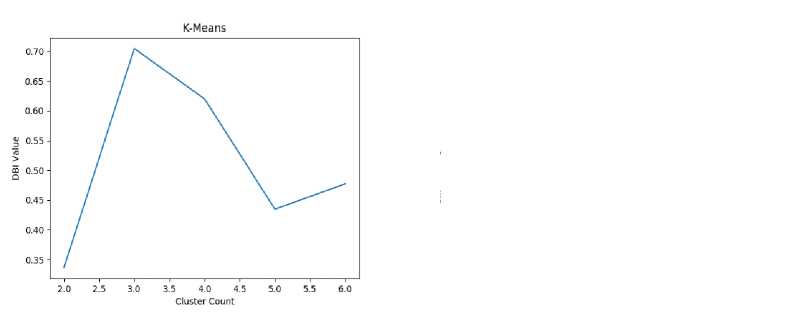

Figure 8. Graph of K-Means Method Cluster Validation
Figure 8 shows the results of the best cluster validation for the K-Means method, where the DBI method produces a value of 0.32 while the Silhouette method produces a value of 0.91.
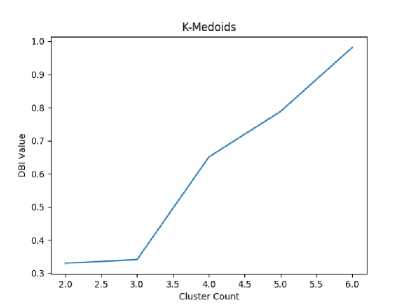

Figure 9. Graph of K-Medoids Cluster Validation
Figure 9 shows the results of the best cluster validation for the K-Medoids method, where the DBI method produces a value of 0.33, while the Silhouette method produces a value of 0.75.
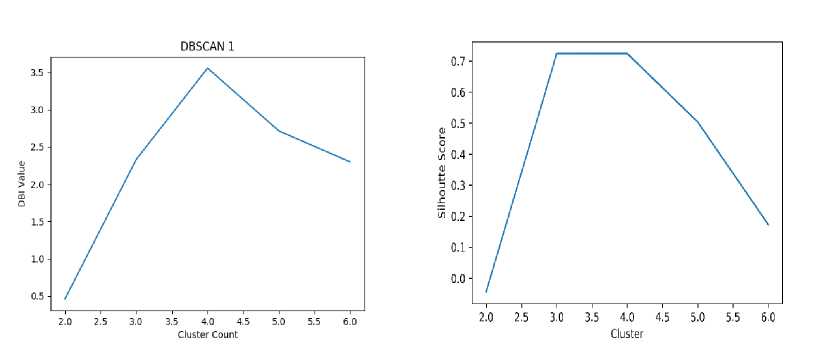
Figure 10. Graph of DBSCAN Cluster Validation
Figure 10 shows the results of the best cluster validation for the K-Medoids method, where the DBI method produces a value of 0.45, while the Silhouette method produces a value of 0.72.
Based on the results in figures 8,9 and 10, the K-Means method has the smallest DBI value and the largest Silhouette value, and it can be concluded that the K-Means method can produce better clusters compared to other methods. Based on testing a number of different clusters that were tested using the Davies Bouldin Index and Silhouette Index, the best number of clusters is 2 clusters, where the similarity of the three methods is seen based on customer characteristics.
Based on this research, the application of the K-Means and K-Medoids methods in the 2 cluster experiment, did not produce the best customer class, but only created the Dormant customer class, the application of the DBSCAN method in the 2 cluster experiment produced the Golden customer class, in other words, the implementation of the DBSCAN method in 2 cluster experiments are better than the K-Means and K-Medoids methods. Whereas in experiment 4, the three cluster methods produced a Golden customer class. This proves that the more tests are carried out, the resulting customer class will be more varied, so that the possibility of the emergence of the best customer class, namely Superstar and Golden, is greater. The results showed that K-Means had the best level of validity than K-Medoids and DBSCAN, where the Davies-Bouldin Index yield was 0.33009058, and the Silhouette Index yield was 0.912671056. Based on testing a number of different clusters that were tested using the Davies Bouldin Index and Silhouette Index, the best number of clusters is 2 clusters.
References
-
[1] I. D. A. A. Y. Primandari, I. K. G. D. Putra, and I. M. Sukarsa, "Customer Segmentation Using Particle Swarm Optimization and K-Means Algorithm," International Journal of Digital Content Technology and its Application, vol. 10, no. 4, pp. 22-28, 2016.
-
[2] I. K. Gede, D. Putra, and D. S. H, "Combination of Adaptive Resonance Theory 2 and RFM Model for Customer Segmentation In Retail Company," International Journal of Computer Applications, vol. 48, no. 2, pp. 18–23, 2012.
-
[3] K. M. Manero, R. Rimiru, and C. Otieno, "Customer Behaviour Segmentation among Mobile Service Providers in Kenya using K-Means Algorithm," International Journal of Computer Science, vol. 15, no. 5, pp. 67–76, 2018.
-
[4] R. A. Carrasco, M. F. Blasco, J. García-Madariaga, and E. Herrera-Viedma, "A Fuzzy Linguistic RFM Model Applied to Campaign Management," International Journal of Interactive Multimedia and Artificial Intelligence, vol. 5, no. 4, p. 21-27, 2019.
-
[5] S. A. Mustaniroh, U. Effendi, and R. L. R. Silalahi, "Integration K-Means Clustering Method and Elbow Method For Identification of The Best Customer Profile Cluster Integration K-Means Clustering Method and Elbow Method For Identification of The Best Customer Profile Cluster," IOP Conference Series: Materials Science and Engineering, vol. 336, pp. 1-6, 2017.
-
[6] Z. Rustam and A. S. Talita, "Fuzzy Kernel K-Medoids Algorithm for Multiclass Multidimensional Data Classification," Journal of Theoretical and Applied Information Technology, vol. 80, no. 1, pp. 147–151, 2015.
-
[7] N. Made, A. Santika, I. K. Gede, D. Putra, and I. M. Sukarsa, “Implementasi Metode Clustering DBSCAN pada Proses Pengambilan Keputusan,” Lontar Komputer, vol. 6, no. 3, pp. 185–191, 2015.
-
[8] D. Virmani, S. Taneja, and G. Malhotra, "Normalization Based K-Means Clustering Algorithm," Journal of Advanced Engineering Research and Science, vol. 5, no. 6, pp. 1– 5, 2015.
-
[9] M. Madhiarasan and S. N. Deepa, "A Novel Criterion to Select Hidden Neuron Numbers in Improved Back Propagation Networks for Wind Speed Forecasting," Application Intelligence, vol. 44, no. 4, pp. 878–893, 2016.
-
[10] P. Pengelompokan, R. Kost, D. I. Kelurahan, and T. Semarang, “Perbandingan Metode K-Means dan Metode DBSCAN pada Pengelompokan Rumah Kost Mahasiswa di Kelurahan Tembalang Semarang,” Jurnal Gaussian, vol. 5, pp. 757–762, 2016.
-
[11] I. Kamila et al., “Perbandingan Algoritma K-Means dan K-Medoids untuk Pengelompokan Data Transaksi Bongkar Muat di Provinsi Riau,” Jurnal Ilmiah Rekayasa dan Manajemen Sistem Informasi, vol. 5, no. 1, pp. 119–125, 2019.
-
[12] I. V Anikin, "Privacy Preserving DBSCAN Clustering Algorithm for Vertically Partitioned Data in Distributed Systems," International Siberian Conference on Control and Communications, vol. 10, pp.1-4, 2017.
-
[13] K. Hamdi and A. Zamiri, "Identifying and Segmenting Customers of Pasargad Insurance Company Through RFM Model (RFM)," International Business Management, vol. 10, no. 18. pp. 4209–4214, 2016.
-
[14] Y. Nugraheni, "Data Mining Using Fuzzy Method for Customer Relationship Management In Retail Industry," Lontar Komputer, vol. 4, no. 1, pp. 188–200, 2013.
-
[15] B. Jumadi Dehotman Sitompul, O. Salim Sitompul, and P. Sihombing, "Enhancement Clustering Evaluation Result of Davies-Bouldin Index with Determining Initial Centroid of K-Means Algorithm," International Conference on Computing and Applied Informatics, vol. 1235, no. 1, pp. 1-6, 2019.
-
[16] A.-M. Shoolihah, M. T. Furqon, and A. W. Widodo, “Implementasi Metode Improved K-Means untuk Mengelompokkan Titik Panas Bumi,” Jurnal Pengembangan Teknolologi Informasi dan Ilmu Komputer Universitas Brawijaya, vol. 1, no. 11, pp. 1270–1276, 2017.
43
Discussion and feedback