Identifying Requirements Association Based on Class Diagram Using Semantic Similarity
on
LONTAR KOMPUTER VOL. 10, NO. 1 APRIL 2019
DOI : 10.24843/LKJITI.2019.v10.i01.p03
Accredited B by RISTEKDIKTI Decree No. 51/E/KPT/2017
p-ISSN 2088-1541
e-ISSN 2541-5832
Identifying Requirements Association Based on Class Diagram Using Semantic Similarity
Hernawati Samosira1, Daniel Siahaana2
aInformatics Department, Institut Teknologi Sepuluh Nopember Kampus ITS, Sukolilo,Surabaya, Indonesia 1hernawati16@mhs.if.its.ac.id 2daniel@if.its.ac.id (corresponding author)
Abstract
Requirements association depicts inter-relation between two or more requirements within a software project. It provides necessary information for developers during decision-making processes, such as change management, development milestones, bug prediction, cost estimation, and work breakdown structure generation. Modeling association between requirements became a focus of software requirements researchers. Previous studies indicate that requirements association was pre-defined by requirements engineer based on their expert judgments. The judgments require knowledge on requirements and their class realizations. This paper introduces a method to generate a mapping between a set of requirement statements and a set of classes of a given project that realized the respected requirements. The method also generates associations among requirements based on information on associations between classes and the class-requirement mapping. The method utilizes element of relational information resided in a class diagram of respected project. A semantic similarity method was used to define the requirements with their realization classes. A class is considered realizing a requirement if and only if their semantic similarity is higher than a certain threshold. A set of experimentation on four different projects was conducted. The result of the approach was compared with the output produced by human annotators using kappa statistics. The approach is considered as having a fair agreement level (i.e. with kappa value 0.37) with the human annotators to identify and model requirement associations.
Keywords: Class Realization, Mapping, Requirements Association, Requirement Statement, Semantic Similarity
Requirements engineering is a collection of activities identify or discover software requirements, and then communicate and document them [1]. It includes a number of processes, i.e. elicitation, analysis, specification, validation, and management of software requirements. During the requirements engineering processes, a change on requirements may occur. A change on a specific requirement may trigger a set of changes on relevant requirements.
There are several studies have been conducted on requirements change [2], [3]. Widiastuti & Siahaan (2008) introduces a graphical model of requirement change called Labeled Transition System for Requirement Change (LTS-RC). LTS-RC models changes on requirements in term of state transitions. A state transition models a requirement changing component. The study suggests that the model requires information related to requirements changes as an input. Müller & Rumpe (2014) models requirements change by analyzing alteration between versions of a design artifact, i.e. class diagram [3]. Any alteration on requirements from previous iteration should have a direct mapping to the changes in class diagram. Figure 1 describes the detail design of modeling requirement association method. It consists of 4 parts, First, it prepares requirement and class. In this part there are 2 data are required, i.e. SRS document and class diagram. Second, it maps requirement and class. This part consists of two sub parts. The first subpart prepares requirement statement and information of class, such as class name, attribute and also method. Then, the second subpart preprocesses text of requirement and text of class into predefined metadata. Lastly, the third subpart calculates the similarity between the two preprocessed text. The similarity value represents the degree of certainty that the respected
requirement was realized by and the respected class. Third, it generates requirement dependency graph. Fourth, it produces a dependency requirement. Therefore, the output of this method is a requirement dependency graph.
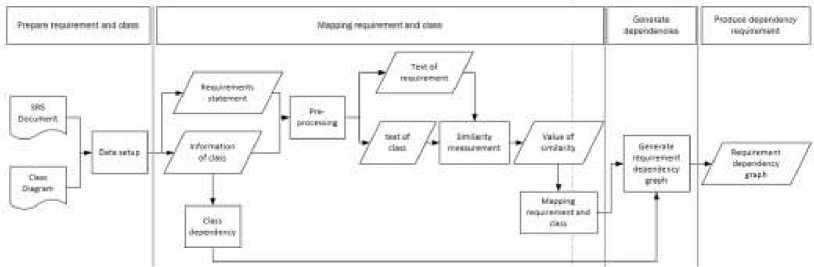
Figure 1 Modeling Requirements Association Method
The previous studies suggest that a change made to a requirement could affect other requirement [2], [3]. There are several reasons why the associations between requirements is important in requirements changes [4]. First, it provides information, such as list of changed modules, development effort with respect to the changed module, and possible bugs, for project manager to predict cost due to a change on a requirement. Second, it indicates dependencies between requirements, which help predicting bug, determining project milestone, and planning a work breakdown structure of a software project.
There have been a number of studies on element dependencies [5]–[13]. Wang & Wang (2016) focuses on dependencies between requirements. The study introduces a dependency model between requirements based on information on the frequency of bug occurrences. The generated model is used to predict feature bug. Thus, it helps providing an initial estimation of the software. However, the identification of requirements dependencies was done based on expert judgment.
This paper introduces a method to map requirements to their class realizations of a given software development project. Giving this mapping and the associations between the classes, the method identifies and models associations between requirements within a software development project [14]. The requirement associations were derived based on information associations extracted from a class diagram of respected project. The process of generating model should be carried after each iteration within the software development lifecycle.
This section provides an overview of research design carried out to develop and evaluate the proposed method for identifying and modeling requirements association. There are four case studies used in this research. All case studies were real software development projects. Each project varies in size and domain. Table 1 describes the projects used as the case studies.
Table 2. Result Preprocessing Requirement Statement and Class
|
Req. ID |
Req. Token |
Class ID |
Class data |
|
R01 |
patron; library; manage; |
C01 |
book;isbn; name; subject; |
|
account |
overview; publisher; publication; date | ||
|
R02 |
patron; library; search; |
C02 |
book; item; barcode; tag; isbn; subject; |
|
catalog; |
title; lang;numberofpages; format; borrowed; loan;period;duedate;isoverdue | ||
|
R03 |
patron; library; reserve;book; item; |
C03 |
author;name; biography; birthdate; |
|
R04 |
library; renew; item; |
C04 |
account; number; history; opened; state; |
|
R05 |
patron; provide; |
C05 |
library; name; address; patron; name; |
|
feedback; |
C06 |
address; librarian; name; address; position; | |
|
C07 |
catalog; | ||
|
C08 |
search; | ||
|
C09 |
manage; |
The aim of this study is to design a method to generate a model of requirements association by means of information extracted from a class diagram. This method was designed in the following processes. First process preprocesses the requirement statements and the class diagram. This process focuses on extracting features of a class and a requirement statement which are relevant to identify and model requirements association. It also identifies requirement associations and class association that can be used in this study. Second process maps requirements to realization classes. This process focuses on finding a method to measure
semantic similarity between a requirement statement and a class. It also focuses on finding a
threshold that can produce the best mapping result. Third process models the associations
between requirements. This process focuses on designing a set of rules to transpose class
association and mapping between requirement statements and classes into requirements associations. Last process visualizes the produced model, i.e. requirements association model. This process focuses on designing a graphical model of requirements association.
Table 3. Set of Requirement Statements of a Project
ID Requirements Statement
R01 Patron or library can manage account
R02 Patron or library can search catalog
R03 Patron or library can reserve book item
R04 Library can renew book item
R05 Patron can provide feedback
Software Requirement Specification (SRS) is used to generate requirement statements. This document includes requirement statements. As an illustration, the Library System is used as an
Table 1. Description of Case Study Projects
|
Project Name |
Project Description |
Number of requirements |
Number of classes |
|
Tutorial Request |
A web based information system used to serve tutorial requests for ITS information majors |
6 |
7 |
|
Department Calender |
Web-based information systems are used to provide information to lecturers and students about their schedules in the Information Department |
6 |
16 |
|
Letter Submission Information System |
Information system used to serve the process and the filing flow of the letter. |
4 |
3 |
|
RAnalyzer |
Software to serve fast financial analysis in each new |
13 |
21 |
iteration to respond to changing requirements
example throughout the paper. Table 3 shows the requirements specification of the Library System. The first column is requirement identity. The second column consist of the respected textual statement of each requirement. Figure 2 shows a class diagram of the Library System. It shows classes and their associations. A class may have a set of information, i.e. class name, attributes, and methods.
Both requirements specification and class diagram are preprocessed to produce string of tokens as shown in Table 2. The third column is class ID. The last column is a list of texts extracted from each class. Using tokenizer, each requirement statements is split into tokens. The next process is removing stop words. A class diagram is also used to generate metadata of each classes within the diagram and their associations. The information includes ID, name, attribute, method, and class associations. Each information is also split into tokens using tokenizer. After tokenizing, all tokens that contain stop words are removed.

flβm∙ Slnng BOtflMS AMttftf
Boo#
Boofc Item
Account
BCCOUFrt!
Library
Cj∣Woα
Ortv1V-^ewn language
n*mβ Stong h4 OQrapO f Stfng IxrtnDalB Date
'tfflu*nefβhM≡ Fonwt
name Stong *»es? S∣rng p⅞⅛rt>⅛n Sirng
∙ιrρr¾cp<
MaflflQO
PflOMMCfc Hardcover AlmIoCoc** AuicCD WJCC ⅞Γ
noma Stong abdreci StrrQ
EφM Frβf∣cn German Sparrah AatBn
ISBN Slmg mme Stfng MJKt 8w*g OMOfve* Slnng putMKhar SMng PLtHcahonDtoe DalB
OMbar id
OOtoty H≡toτ∕[O ∙} opened DHe sw* AKtfumsieie
∙<irwMboe<
Saaich
barcoOe SVng teg WD ■ ^N Sbng "-subject Suing Uha StrrQlrabefnes name∣ Iwrg LanQLflQereOefree lang πumbe*C*Page∙ ∙*togaf formal Former borrowed Dale IoanFBnod Intaper αueθate Date ∣y¾⅜rtλ< t⅛o⅜n = false
Figure 2. Class Diagram of Library System
To map each requirement into each realization class, a matrix Smxn is created. The m indicates the number of classes, while n indicates the number of requirements. Table 4 shows the initial matrix. A cell sij is a semantic similarity value of class-i (ci) and requirement-j (rj). As the initial matrix, each column is filled with 0.
Table 4. The Matrix Smxn of Library System
|
Smxn |
R01 |
R02 |
R03 |
R04 |
R05 |
|
C01 |
0 |
0 |
0 |
0 |
0 |
|
C02 |
0 |
0 |
0 |
0 |
0 |
|
C03 |
0 |
0 |
0 |
0 |
0 |
|
C04 |
0 |
0 |
0 |
0 |
0 |
|
C05 |
0 |
0 |
0 |
0 |
0 |
|
C06 |
0 |
0 |
0 |
0 |
0 |
|
C07 |
0 |
0 |
0 |
0 |
0 |
|
C08 |
0 |
0 |
0 |
0 |
0 |
|
C09 |
0 |
0 |
0 |
0 |
0 |
Table 5. Similarity values between C01 and R01
|
R01-1 |
R01-2 |
R01-3 |
R01-4 | |
|
C01-1 |
0.38 |
0.52 |
0.00 |
0.12 |
|
C01-2 |
0.00 |
0.00 |
0.00 |
0.14 |
|
C01-3 |
0.14 |
0.13 |
0.50 |
0.31 |
|
C01-4 |
0.15 |
0.14 |
0.00 |
0.50 |
|
C01-5 |
0.13 |
0.13 |
0.00 |
0.43 |
|
C01-6 |
0.12 |
0.11 |
0.00 |
0.25 |
|
C01-7 |
0.40 |
0.56 |
0.00 |
0.13 |
|
C01-8 |
0.14 |
0.13 |
0.33 |
0.31 |
Table 6. Class-Requirement Semantic Similarities of Library System
|
ID |
R01 |
R02 |
R03 |
R04 |
R05 |
|
C01 |
0.32 |
0.33 |
0.43 |
0.44 |
0.18 |
|
C02 |
0.21 |
0.22 |
0.30 |
0.28 |
0.10 |
|
C03 |
0.56 |
0.27 |
0.37 |
0.35 |
0.29 |
|
C04 |
0.42 |
0.25 |
0.21 |
0.30 |
0.21 |
|
C05 |
0.54 |
0.36 |
0.46 |
0.53 |
0.30 |
|
C06 |
0.44 |
0.37 |
0.46 |
0.36 |
0.39 |
|
C07 |
0.47 |
0.28 |
0.40 |
0.42 |
0.31 |
|
C08 |
0.20 |
0.40 |
0.32 |
0.38 |
0.18 |
|
C09 |
0.11 |
0.40 |
0.11 |
0.13 |
0.08 |
|
C10 |
0.40 |
0.16 |
0.07 |
0.09 |
0.14 |
Table 7. Mapping Class and Requirement
|
ID |
R01 |
R02 |
R03 |
R04 |
R05 |
|
C01 |
S |
S | |||
|
C02 | |||||
|
C03 |
S | ||||
|
C04 |
S | ||||
|
C05 |
S |
S |
S | ||
|
C06 |
S |
S | |||
|
C07 |
S |
S |
S | ||
|
C08 |
S | ||||
|
C09 |
S | ||||
|
C10 |
S |
|
IMlI |
mix |
IttiJ |
Ml 4 |
Hrii hM< |
BoM |
AM-I |
«UM O J« |
W ^"∣γχj |
AU |
Inw tow SJw | ||||||||||||
|
Clbt I 'j |
Il 1» ∏ W |
"∙⅛' |
QOO QIO |
■ U |
Cll-I |
• M |
• U |
•• |
u: |
Oll |
»JJ |
hOo |
<«•1 |
OM |
AUl *M∣ | |||||||
|
P H |
«14 |
AOT |
AIA |
• M |
«1* |
CtbJ |
AtB |
AM |
AW |
SJJj |
<*01‰Z |
ion |
A∙A | |||||||||
|
«W |
o K |
*41 |
QIB |
nal-» |
AM |
All |
AM |
• u |
u to |
AM |
A∣l |
AM |
AM ' | |||||||||
|
OM |
i !♦ |
• 1* |
Urt |
IM |
CfllM |
ill |
Ii u |
AW |
CM-J |
AU Ajj |
AM • u |
AIB AOO |
OJJ |
I Il |
OiO | |||||||
|
r«-’ |
«u |
IIJ |
QDC |
IlU |
coι-< |
AM |
αιι |
•M |
«41 |
oi ∙i |
• 41 |
CAM |
om oil |
ill |
AM ‘ i’ii | |||||||
|
c#»* |
• U |
»1» |
UW |
• :< |
Cta∣-∙ |
AU |
Ull |
AAA |
•i’ ⅛ IJ |
CiM |
OU |
«00 |
∙4∣ |
Com |
Aii | |||||||
|
Llb* |
a» |
♦ M |
UW |
AM |
UM |
OM |
CtaU |
AW All |
«W |
AM |
Γ⅛i |
O 1* |
αw] |
AM | ||||||||
|
m 4 |
n h |
∙∣∙ |
β JJ |
Ill |
«14 |
AM |
nil |
AM |
AJl |
014 |
AP |
OM |
CflJ-I |
OM |
All |
AU |
AJI | |||||
|
COl vBiMl JBVBBKMfkH NtantoHka ta^M ≡*taM< RBfMi * Btaaaa |
YtoBCM I MBN I BrsaNtoMMtaaRBBrar |
ItoaLOOMlRBM BVSMtatoMltanlBvM |
TtosCU I BtoiM I SvBBtotaMtantovtaB | |||||||||||||||||||
Figure 3. Illustration of Greedy Algorithm Implementation on C01 and R01
For each cell sij, another matrix Wixj is created in order to measure semantic similarity between a class and a requirement. Table 5 illustrates the process of measuring semantic similarity between requirement R01 and class C01 of the Library System. The class C01 contains 8 tokens. The requirement R01 contains 4 tokens. First, the method measures the semantic similarity between all word pairs, i.e. a token-i of the class and a token-j of the requirement. The method uses WuPalmer and Levensthein Distance word similarities for this purpose. For each pair, it tries to measure semantic word similarity between the two tokens. It utilizes hypernym relation of WordNet Thesaurus. Equation 1 shows how the semantic similarity of a token of a class (t1) and a token of a requirement is measured.
S im WP = ^£2_ (1)
(D 1+D 2 )
If it returns similarity value lower than or equal to zero, i.e. they are different part of speeches.
Then, it measures the syntactic similarity of the two tokens. Equation 2 shows how the
Levensthein Distance is used to measure the similarity.
S imLD = 1--—--
(2)
MaxLength
Given all token-pairs similarities as shown in Table 5, a greedy algorithm is applied to calculate the best semantic similarity between the class-requirement pair. The preprocessing of requirements R01 produces four string tokens. Therefore, the string token of R01 is represented by R01-1 until R01-4. The preprocessing of class C01 produces eight string tokens. Therefore, C01 is presented by C01-1 until C01-8. Each cell represents the string similarity value of each token pairs. Figure 3 illustrates how the algorithm is working on C01 and R01 [15]. The algorithm starts by selecting a cell with the highest value, that is, the cell from the “publicationlibrary” pair. And then, the rest of the cells of the same column and row are deleted which is denoted by the cross. If there are still unprocessed cells, this process will be repeated. If there
Table 8. Associations between Classes
|
Source Class |
Destination Class | ||||||||
|
C01 |
C02 C03 |
C04 |
C05 |
C06 |
C07 |
C08 |
C09 |
C10 | |
|
C01 | |||||||||
|
C02 |
s | ||||||||
|
C03 |
c | ||||||||
|
C04 |
c | ||||||||
|
C05 |
c |
c |
H | ||||||
|
C06 |
d | ||||||||
|
C07 |
d |
d | |||||||
|
C08 |
c |
i |
i | ||||||
|
C09 | |||||||||
|
C10 | |||||||||
are no unprocessed cell, the process stops. Given the result, the semantic similarity of C01 and F01 can be calculated as follows:
( 8 + 4)
.
12
= 0.32
By using Equation 1, the sematic similarity of C01 and R01 is 0.32. This calculation is performed on all pairs of requirements and class. Table 6 shows the result of calculating all cells of matrix S. Given a predefined threshold, e.g. 0.40, the method selected all pairs that have semantic similarity values higher than the threshold. The threshold was defined by experimental results. The cells which were marked bold are the class-requirement pairs that are considered having realization relation, i.e. the class realizes the requirement. These cells have similarity value higher than the given threshold. Table 7 shows that class C01 realized two requirements, i.e. R03 and R04. It also shows that requirement R01 was realized by C03, C04, C05, C06, and C07. These prove that the cardinality of realization relation is many to many.
The next step, the method transforms Table 6 to Table 7. The cells with checklist, i.e. sij, indicates that the respected class, i.e. ci, realizes the respected requirement i.e. rj,. Aside the many-to-many relation, Table 7 also shows that there is row without any checklist marker. For an example, the class C02 does not realize any requirement. There are three possible reasons. First, this could be because the class provides functionalities that only support other classes. This means that within a project, there is a probability that a class may not directly realize any requirement. Second, this could be because the class provides functionalities that are never being used to implement or unrelated to any requirement. Third, this could be because the class contains names of class, attribute, and method which are not representing their functions. It also shows that the dataset is not good.
On the other hand, Table 7 also shows that there is a column without any checklist marker. This means that the requirements are not realized by any class. There are two reasons for this. First, this could be because no class realizes the requirement. This means that the project is a failure, since the project delivered deficient artifacts. Second, this could be because the designer failed to address separation of concern. Third, this could be because the class contains names of
Table 11. Association Between Requirements
|
Type |
Description |
|
and (R1 and R2) |
In order R1 to be functional, R1 requires R2 |
|
requires (R1 requires R2) |
R1 requires R2 to work, but not vice versa |
|
temporal (R1 temporal R2) |
R1 should be implemented before R2 or vice versa |
|
cvalue (R1 CVALUE R2) |
R1 affects the value of R2. Values can be positive or negative |
|
icost (R1 ICOST R2) |
R1 affects the cost of R2 implementation. Value can be positive or negative |
|
or (R1 OR R2) |
Only R1 and R2 can be implemented |
|
Table 12. Mapping Requirement |
Table 13. Requirements Association | |||
|
Associations and Class Diagram Associations |
Source |
Relation |
Destination | |
|
R01 |
requires, temporal |
R02 | ||
|
R03 R04 |
temporal temporal |
R01, R02 R01, R02 | ||
|
Requirement Association |
Class Diagram Association | |||
|
R03 R04 |
requires, temporal requires, temporal |
R02 R02 | ||
|
and (r1 and r2) requires (r1 requires r2) |
Implements strong aggregation | |||
|
temporal (r1 temporal r2) |
uses, strong aggregation | |||
class, attribute, and method which are not representing their functions. This condition may occur due to lack of quality during the software design process.
Next step is extracting dependency between classes. Class dependency was extracted based on an association between the respected classes. Table 8 illustrates the class dependency extraction of the Library System. There are a number of class diagram associations, i.e. s, c, h, i, and d. The association s stands for specializes, h stands for has (strong aggregation), c stands for contain (weak aggregation), u stands for uses, and i stands for implements, and d stands for dependency. For example, relation between C02 and C01 is specialization, relation between C03 and C01 is weak aggregation, relation between C05 and C08 is strong aggregation, and relation between C07 and C09 is dependency.
After extracting the class associations resided in the class diagram, a destination class should be mapped to requirement statement list based on realization class-requirement pairs. Table 9 represents association mapping between different requirements. For an example, the requirement R01 has strong aggregation with R02. Strong aggregation means one requirement is required by other requirement. R01 correlates weak aggregation with R03 and R04. R03 and R04 have the same relation to R01, namely weak aggregation and uses. R03 and R04 have the same relationship with R02, which is a strong aggregation and uses. Modeling requirement associations can be seen in IPTEK Journal of Proceeding Series [16].
Table 9 shows the relations between requirements based on their respected class dependencies. For an example, in Table 9 the association of R01 and R02 is "h" (strong aggregation). The ‘strong aggregation’ relation was derived from the following steps:
-
1. Given Table 7, it is known that R01 is implemented by C03, C04, C05, C06, C07 and C10 or R01 = {C03, C04, C05, C06, C07, C10}
-
2. One of the features used is R01 is implemented by C05 (see Step 1). Then in Table 8, it is known that C05 has a “c/weak aggregation” relation to C02, C04 and C08.
-
3. From Table 7, it is known that C02 does not implement any requirement, C04 implements requirement R01, and C08 implements requirement R02. This indicates that R01 has a relation "h (strong aggregation)" to R02.
The description details from Table 9 are shown in Table 10. It represents the associations between requirements obtained based on inter-class associations from class diagram. Association between requirements can be seen in Table 9. Weak aggregation is not included in Table 9 because there is no previous definition of that relation. Furthermore, the type of association used for this study is adopted from Dahlstedt (2001). This explains a number of
association types within requirements. Some of these associations are described in Table 10. There are six association types mentioned in Table 11, i.e. and, requires temporal, cvalue, icost and or.
After analyzing associations between requirements and class diagrams, a number of associations are considered relevant to each cases [17], e.g. the associations of class diagrams. The relevant types are and, requires, and temporal. Details of the requirement and association pairs of the class are given in Table 12. Given the results in Table 7 and Table 8, the requirement associations can be extracted from pre-determined mapping. Those can be seen in Table 12. The results of the requirement mapping association based on class diagrams can be seen in Table 13.
An experiment was designed to provide a proof that the method is a potential solution to model requirements association. Four datasets contain four projects were set up for this purpose (Table 1). The projects were developed within previous bachelor software engineering courses. The
Table 14. Reliability of The Approach in Identifying Realization Class-Requirement
|
Human-1 |
Human-2 |
Human-3 |
Method |
Experts |
Average | |
|
Human-1 |
////////////// |
0.27 |
0.41 |
0.13 |
0.60 |
0.27 |
|
Human-2 |
0.27 |
/////////////// |
0.52 |
0.43 |
0.71 |
0.41 |
|
Human-3 |
0.41 |
0.52 |
////////// |
0.25 |
0.82 |
0.40 |
|
Method |
0.13 |
0.43 |
0.25 |
////////// |
0.37 |
0.27 |
projects are Tutorial Request, Department Calender, Letter Submission Information System and RAnalyzer. To measure the performance of the method, the kappa statistic was used to measure its reliability. Three experts were involved as annotators. The experts work in the field of software engineering and have the experience in the field of requirements specification. The annotators The annotators annotated each class-requirement pair for each project with true or false (equal to Table 6). The annotation is true if and only if the class was considered realizing the respected requirement. The annotation is false if and only if the class was not considered realizing the respected requirement. The annotators also annotated each requirement-pair for each project with true and false (equal to Table 8). The annotation is true if and only if the source requirement was considered depending to the destination requirement. The annotation is false if and only if the source requirement was not considered depending to the destination requirement.
The reliability of the proposed method was measured by calculating the level of agreement between the human annotators and method. The reliability level was based on the kappa statistical method, namely Gwet's AC1. The method was treated as one of the experts whose answers would be compared with the human annotators. Table 14 shows the reliability performance of the method in comparison with the human annotator in identifying class that realizes requirements. The results show that this method has a fair agreement level with respect to the all human annotators. The reason is because human annotators can identify more dependencies between requirements. This is due to the fact that human annotators have implicit knowledge regarding domain problems. The fifth column (with gray color) contains the reliability scores between each expert and the majority answer among human annotators. Almost all experts have moderate level of agreement, but only the third human annotator has the level of almost perfect agreement.
The result of the method compared to human-1 is lower than the value generated by human-2 and human-3. If it is broken down from each dataset, then it is known that the lowest score of Gwet’s AC1 was the result of dataset 1 and dataset 2. Number of requirements in these datasets is 6. Thus, most of the classes only contain class name. While in dataset 2, most of classes in the class diagram do not have a method, this is likely to affect the results of the AC1 generated by the method. Furthermore, classes in dataset-3 have redundant functions. Thus, these results indicate that the method could be used to map the requirements and its realization classes. But low-quality design process may cause inconsistency and low level of compliance of design artifact with respect to their requirements specification.
This study developed a method to identify and model associations between requirements within a software project. To identify and model the requirements association, the method starts by mapping the requirements into their realization classes. The experimentation shows that the method was able to identify an association type among requirements, i.e. requires. Thus, the method is considered having a fair agreement level with the human annotators, i.e. having kappa value 0.37.
Nevertheless, the monitoring process is considered less sensitive in distinguishing the existence of true positive relations. This is due to weighting of class name, attribute, and method that is not accurate. Furthermore, some of the requirements specified by system analysis weren’t transparently realized by a use case. Some classes were not directly derived from the use cases. There were invariants occurred during the transition process between artifacts. Further research is required to experiment with distributed data in order to get the optimal result.
The fair reliability level of the method is the result of explicit knowledge usage, i.e. the textual semantic similarity between requirement statement and the class diagram of a respective software project. Further research is required to experiment with other property of both artifacts, such as structural similarity and context similarity. The context similarity could be achieved by aggregating the information collected by this method (using class diagram artifact) and the information collected from other design artifacts, such as use case diagram, sequence diagram, collaboration diagram, component diagram, state diagram, etc.
Acknowledgement
The author would like to thank Institut Teknologi Sepuluh Nopember and the Del Institute of Technology for their support on this research.
References
-
[1] D. Siahaan, Analisa Kebutuhan dalam Rekayasa Perangkat Lunak, 1st ed. Yogyakarta:
Penerbit Andi, 2012.
-
[2] M. Widiastuti and D. Siahaan, “Mapping the Impact of Requirement Changes Using (LT-
RC),” in 4th International Conference Information & Communication Technology and System, 2008, pp. 315–319.
-
[3] K. Müller and B. Rumpe, “A Model-Based Approach to Impact Analysis Using Model
Differencing,” Proceedings of the 8th International Workshop on Software Quality and Maintainability., 2014.
-
[4] A. G. Dahlstedt and A. Persson, “Requirements Interdependencies : State of the Art and
Future Challenges,” Engineering and Managing Software Requirements, pp. 95–116, 2005.
-
[5] W. Chen, M. Zhang, and H. Li, “Utilizing Dependency Language Models for Graph-based
Dependency Parsing Models,” Proc. 50th Annu. Meet. Assoc. Comput. Linguist. (Volume 1 Long Pap., no. July, pp. 213–222, 2012.
-
[6] M. P. Robillard and G. C. Murphy, “Concern graphs,” Proceedings of the 24th
International Conference on Software Engineering, p. 406, 2002.
-
[7] M. De Marneffe and C. D. Manning, “Stanford typed dependencies manual,” 20090110
Httpnlp Stanford, vol. 40, no. September, pp. 1–22, 2010.
-
[8] W. Wei Zhang, H. Hong Mei, and H. Haiyan Zhao, “A feature-oriented approach to
modeling requirements dependencies,” in 13th IEEE International Conference on Requirements Engineering (RE’05), 2005, pp. 273–282.
-
[9] J. Wang and Q. Wang, “Analyzing and predicting software integration bugs using
network analysis on requirements dependency network,” Requirement Engineering, 2016.
-
[10] A. B. Manik and D. O. Siahaan, “Rancang Bangun Kakas Bantu Deteksi Ketidaksesuaian Kode Sumber terhadap Diagram Urutan,” Jurnal Teknik ITS, vol. 7, no. 1, pp. 23–26, Mar. 2018.
-
[11] D. Siahaan, Y. Desnelita, Gustientiedina, and Sunarti, “Structural and semantic similarity measurement of UML sequence diagrams,” in 2017 11th International Conference on
Information & Communication Technology and System (ICTS), 2017, pp. 227–234.
-
[12] A. M. Yuwantoko, S. Daniel, and A. S. Ahmadiyah, “Pembuatan Kakas Bantu untuk Mendeteksi Ketidaksesuaian Diagram Urutan (Sequence Diagram) dengan Diagram Kasus Penggunaan (Use Case Diagram),” Jurnal Teknik ITS, vol. 6, no. 1, pp. 64–70, Feb. 2017.
-
[13] F. B. Permana and D. O. Siahaan, “Pendekatan Kesamaan Semantik dan Struktur dalam Kasus Penggunaan untuk Mendapatkan Kembali Spesifikasi Kebutuhan Perangkat Lunak,” Journal of Information Systems Engineering and Bussiness
Inteligence, vol. 2, no. 2, p. 57, Oct. 2016.
-
[14] P. Gelu, R. Sarno, and D. Siahaan, “Requirements Association Extraction based on Use Cases Diagram,” Lontar Komputer: Jurnal Ilmiah Teknologi Informasi, vol. 9, no. 1, pp. 11–19, May 2018.
-
[15] M. A.-R. Al-Khiaty and M. Ahmed, “Similarity assessment of UML class diagrams using a greedy algorithm,” in 2014 International Computer Science and Engineering Conference (ICSEC), 2014.
-
[16] D. Hernawati, “Generating Requirement Dependency Graph Based on Class
Dependency,” IPTEK The Journal of Technology and Science., 2018.
-
[17] Å. G. Dahlstedt, “Requirements Interdependencies – a Research Framework,” no. July,
2001
Table 9. Dependency Between Requirements Destination Requirements
|
R01 |
R02 |
R03 |
R04 |
R05 | |
|
R01 |
h |
c |
c | ||
|
R02 | |||||
|
R03 |
c,u |
h,u | |||
|
R04 |
c,u |
h,u | |||
|
R05 |
Table 10. Functionality Based on Class Relationships
|
No. |
Source |
Relation |
Destination |
|
R01 |
strong aggregation |
R02 | |
|
R03 |
uses |
R01, R02 | |
|
R04 |
uses |
R01, R02 | |
|
R03 |
strong aggregation |
R02 | |
|
R04 |
strong aggregation |
R02 |
28
Discussion and feedback