Associative Classification with Classification Based Association (CBA) Algorithm on Transaction Data with Rshiny
on
LONTAR KOMPUTER VOL. 14, NO. 1 APRIL 2023
DOI : 10.24843/LKJITI.2023.v14.i01.p03
Accredited Sinta 2 by RISTEKDIKTI Decree No. 158/E/KPT/2021
p-ISSN 2088-1541
e-ISSN 2541-5832
Associative Classification with Classification Based Association (CBA) Algorithm on Transaction Data with Rshiny
Alesia Arum Frederikaa1, I Putu Agung Bayupatia2, Putu Wira Buanaa3
aInformation Technology Department, Udayana University
Bali, Indonesia
1alesiaarum@student.unud.ac.id (corresponding author)
2bayupati@unud.ac.id wb@unud.ac.id
Abstract
Data mining can be used for businesses with large amounts of data. One of the data mining techniques is Associative Classification. It is a new strategy in data processing that combines association and classification techniques to build a classification model. This research used an associative classification technique on sales transaction data of Frozen Food Stores, which had sales transaction data on their business activities. It would be used in sales strategies to find items often purchased by class customers, namely, members and general. This research aimed to classify based on association rules using the CBA (Classification based Association) algorithm on sales transaction data. The application used the R programming language that business owners could use. The results of the rules obtained from the trial had the value of support, confidence, coverage, and lift ratio, which were the best value levels of a rule. The results of the rules that had the highest lift ratio value from all the data that have been inputted can be used as a reference to be implemented in sales strategies in knowing consumer needs.
Keywords: Data Mining, Associative Classification, Classification Based Association Algorithm, Rshiny
Technology has experienced rapid development and advance nowadays. Along with these technological advances, business development in the economy through the free market brings companies to an intense competition level. Therefore, the amount of business competition and the development of increasingly advanced technology can be used in implementing business with information technology. Implementing information technology in business activities can facilitate companies in carrying out business activities. Business activities in companies have great potential to have abundant data. A lot of data in the company can cause a slow process of retrieving information.
One way to determine market conditions is by observing transaction sales data. Sales transaction data shows the wants and needs of consumers, which are stored for sales reports and income statements. Sales transaction data has a large amount of data but does not have a significant increase in information. Several studies have been conducted in terms of data mining in sales data, such as data mining in grocery stores using the Apriori algorithm [1], data mining on sales transaction data at the Fasentro Fancy store [2], and the application of Data Mining on Goods Sales Transactions at BE-MART Store [3]. These studies used the Apriori algorithm, which used association rules that were very suitable for mining transaction data. In addition, mining transaction data can also be used to analyze consumer purchasing patterns [4] and predict sales transactions [5].
Frozen Food Store is a business in the food sector, with the main product being processed frozen food. Methods of processed frozen food result from food preservation by lowering the temperature to freezing. It aims to slow down the decay process [6]. Frozen Food Store has various types of
products that produce thousands of sales transaction data in its business activities that have not been utilized to provide information in developing sales strategies. Problems arise when the business owner has difficulty analyzing sales transaction data due to a large amount of data and limited data processing tools. Problems related to transaction data analysis can cause inappropriate sales strategies to be carried out.
One of the helpful technology applications in business applications is data mining. Data Mining is a statistical, mathematical, artificial intelligence, and machine learning technique used to extract and identify useful information from various sales data into valuable information in making decisions on these companies or business activities. Associative Classification is one of the applications carried out on sales transaction data [7].
Associative Classification (AC) is a data mining technique that uses association rule discovery methods in classification problems. Several studies prove that AC (Associative Classification) techniques can provide more accurate classification models than traditional classification techniques, such as a decision tree, rule induction, and probabilistic approaches [8]. Classification Rule Mining is a promising approach in data mining to create more interpretable and accurate prediction systems. This approach typically builds on Classification and Association rule data mining techniques, which identify a subset of rules known as Class Association Rules (CAR), whose consequences are limited to the target class label [9]. The rule generation phase is the phase to generate frequent itemsets in the AC (associative Classification) method. This phase extracts rules that aim to generate a set of CAR (Class Association Rules).
The second phase in AC (associative Classification) is the classifier-building phase. The classifier-building phase is a phase to predict or classify data that has not been categorized in a particular class or label. Algorithms of associative classification methods are CBA, CMAR, MCAR, L3G, and so on [10].
The associative classification algorithm used in Frozen Food Store sales data is the Classification Based Association (CBA) found in the R package. R is a programming language for performing statistical and graphical analysis. The R programming language also uses many packages as needed [11].
Innovations are carried out to determine market conditions in frozen food stores using data mining techniques, namely associative Classification. Associative classification analysis can show the wants and needs of consumers in frozen food stores. The package used in implementing associative Classification with the CBA (Classification Based Association) algorithm is the arulesCBA package. Classification Based Association (CBA) integrates classification techniques with association techniques in data mining to find rules. The rules found depend on the minimum support and minimum confidence.
Associative classification analysis with the CBA (Classification Based Association) algorithm on Frozen Food Store sales data can be used to provide information from the results of the rules obtained, namely to find the types of goods often purchased by class members and general customers who have support, confidence, and coverage values, as well as lift ratios that can be used as information in decision making for sales strategies at Frozen Food Stores using the RShiny web framework.
The research phase started with several stages, including the planning stage, the data collection stage, designing the Associative Classification application with the CBA (Classification Based Association) algorithm, and analyzing and evaluating Associative Classification process results with the CBA (Classification Based Association) algorithm).
The planning stage included defining the problem, explaining the research objectives, benefits, and problem boundaries as the basis for making the Associative Classification analysis application, and collecting literature reviews.
Data used in the research was secondary data obtained by researchers from existing sources. The data used was sales transaction data from Frozen Food Stores from October 2019 to January 2020. The number of transactions owned at Frozen Food Stores was 6928 in October, 7322 in November, 6480 in December, and 7164 in January.
The design of the Associative Classification application with the CBA (Classification based Association) algorithm began with modeling with the R language using the arulesCBA package. Furthermore, the application was designed using R and the Shiny package to create the application interface.
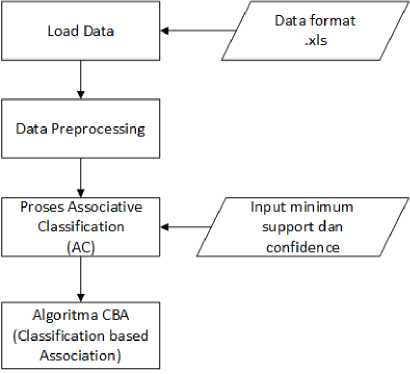
Figure 1. Gambaran Umum Aplikasiover of Lontar Komputer
Figure 1 is the application overview. The data load process was done by inputting data in Excel file format. Data pre-processing prepared raw data into the required data format [12].
The initial input data was from frozen food store sales transactions with 13 attributes: invoice number, transaction code, transaction date, transaction total, item code, item name, item price, category code, category name, quantity, total, class, and customer name. Data pre-processing was done by selecting and transforming data from the initial data into predetermined transformation data. The attributes used were item code and class label. Table 1 is an example of data pre-processing data results.
Table 1. Data Pre-processing Results
Kode_brg Class
|
SOSIS37 |
MEMBER |
|
BAKSO10 |
MEMBER |
|
NAGET50 |
UMUM |
|
BUMBU22 |
UMUM |
|
SOSIS45 |
UMUM |
|
BAKSO10 |
MEMBER |
|
SOSIS45 |
UMUM |
|
SOSIS37 |
MEMBER |
|
BAKSO10 |
MEMBER |
The user would perform the AC (Associative Classification) process with the CBA algorithm. To perform this process, it would use the arules library and the arulesCBA library available in Rstudio. The AC (Associative Classification) process began with the user entering parameters, including minimum support and confidence. Each ruleitems represented an itemset/condset → y, where y is the class label. The ruleitems obtained would get a value using the formula.
|
Support = |
Rulesup |D| |
(1) |
|
Confidence = |
Rulesup condsup |
(2) |
|
Coverage = |
Count, left |D| |
(3) |
|
Lift ratio = |
confidence |
(4) |
|
benchmark conf | ||
Where:
Rulesup
Condsup
|D|
Count left
Benchmark conf
= number of items and class y in dataset D
= number of items in dataset D
= number/size of datasets
= items on the left
= number of count right divided by |D|
The ruleitem rules obtained had a support value, which is a supporting value to determine item dominance level from the entire transaction, a confidence value, which is a certainty value to show the relationship of item combination in a rule, and a coverage value, which is a coverage value of how often the left-hand item (lhs) occurs in all transactions, and a lift ratio value which is the accuracy of item combination in the rules that have been obtained. The results of AC (Associative Classification) rules that had been generated after the AC (Associative Classification) process with the CBA (Classification based Association) algorithm were presented in the form of table data and visualization using the arulesViz library available in Rstudio.
Associative Classification is a combination of association rules with Classification. Associative Classification is a special method based on association rule mining, with attributes or class labels on the rule's right side. For example, X => Y, Y must be a class attribute [13]. Associative Classification is a data mining technique that performs Classification with association rules. Associative classification algorithms have been proposed, such as Classification based Association (CBA), Classification based on Multiple Association Rules (CMAR), Class based Associative Classification (CACA), and Classification based on Predicted Association Rule (CPAR) [14].
Associative Classification (AC) is a suitable classification approach that facilitates managers' prediction and decision-making in a highly accurate and easy-to-interpret manner. Most existing AC algorithms mainly focus on two static metrics of association rules: support and confidence [15]. Associative Classification uses the parameters of minimum support and minimum confidence. Data in associative Classification can be represented in horizontal, vertical, and set theory data representation [16]. Horizontal theory is adopted from association rule mining. This type of theory is found in the CBA algorithm. The vertical approach converts training data into a table that identifies transactions. This type of theory is found in Multi-Class Multi-Label Associative Classification (MMAC) and MultiClass Classification Association Rules (MCAR). The set approach is based on removing redundant attributes from the training dataset.
Furthermore, AC (Associative Classification) applied rule ranking and pruning to minimize the number of rules in the classifier. The reduction made the classifier smaller, improving classification efficiency [17]. The first algorithm proposed in the AC (Associative Classification) field was the CBA (Classification-based Association) algorithm. It worked in two phases, and the first one generated association rules through an exhaustive search algorithm. Then, it ranked the discovered rules to form the final classifier in the second phase [18]. On the other hand, Associative Classification fitted categorical domains very well, and they had the potential to outperform other advanced algorithms. Associative Classification on a distributed computing framework performed on a job, proving the feasibility of such a system [19].
The CBA (Classification-based Association) algorithm is an algorithm that performs classifiers based on an association approach that has a slightly more accurate and effective level. The CBA (Classification-based Association) algorithm is a utilization derived from the Apriori algorithm. CBA discovers and generates rules by applying Aprori rules that generate candidate characteristics. The main difference between an itemset and a ruleitem is that an itemset only appears as an attribute value through itself, where as a ruleitem consists of a classification value attached to an attribute value. The concept of modeling the CBA algorithm is divided into two stages: CBA-RG and CBA-CB [20].
CBA-RG or CBA rule generator is based on the Apriori method in finding the results of association rules in the process. This stage was carried out to find ruleitems that have or meet the parameters of the minimum support. The first step of generating all frequent rule items was to calculate the support of the individual rule items and determine their status. Subsequence with a support value higher than the minimum support was a frequent ruleitem in the previous stage. The process of creating a possible set of new frequent ruleitems was called the candidate ruleitem. The candidate ruleitems were then calculated for their support value to determine candidate ruleitems with a support value more significant than the minimum support to determine frequent candidate ruleitems. After that, the rules (CARs) were produced.
CBA-CB is a classifier builder using CARs or prCARs that have been obtained previously in the CBA-RG stage. Producing a classifier was done by performing an evaluation stage on all possible subsets in the training data and selecting the subset with the rule sequence with the least error by looking at the rules with a more excellent confidence value. For example, if given two rules ri and rj. If the confidence value of riis greater than rj, then ri is among the rules with a higher priority. If the confidence ri and rj have the same value, but the support value of ri is greater than rj, then ri is included in the higher priority rules. If both rules' confidence and support values are the same, but ri is generated earlier than rj, then the first rule order chosen is ri. The stage of building a classifier builder is sorting the generated "r" rules according to the precedence relationship (preceding or having a higher priority). The process was done by selecting the rules with the highest rights in performing the classifier.
The second step was to select the rules in a pre-sorted order for the classifier of R. Rules that were correctly classified would be marked. For example, marked R would become a potential rule in the classifier. The cases were covered and removed from the dataset as candidate rules. The default class selection was based on the remaining data's majority class. For example, if classifier C stops selecting rules, the class becomes the default class C. The next step was to calculate the number of errors made by C and the default class and record them. When no more candidate rules exist, the rules selection process is complete.
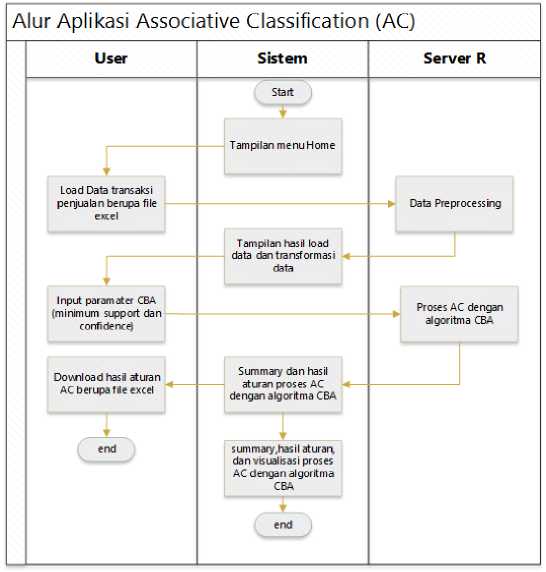
Figure 2. Application Activity Diagram
Creating an Associative Classification application model using the CBA (Classification based Association) algorithm with the arulesCBA package in the R programming language using the shiny web framework for its appearance. The design of the activity diagram in the Associative Classification application using the CBA (Classification based Association) algorithm can be seen in Figure 2.
Figure 2 shows the activity diagram of the associative classification application. The home menu would be displayed when running the application for the first time. The user must input data used in the associative classification process in the form of Excel files. Server R would process and transform the data into the appropriate data format. Thus, the associative classification process could be carried out with a predetermined format. After the process was done, the application displayed the pre-processing data results. After pre-processing the data, the user could perform the associative Classification with the CBA (Classification based Association) algorithm. The user must input minsupp (minimum support) and minconf (minimum confidence).
Furthermore, it would process with the CBA (Classification based Association) algorithm from the data that had been inputted previously by the R server. With the support of the minsupp (minimum support) and minconf (minimum confidence) parameters that the user had input, it would display a summary of the associative classification process, which was the number of rules obtained from the process, the results of the associative classification rules which are details of the results of the rules obtained, and their visualization by the system. The user could save the associative classification results in Excel file format.
Analysis and result evaluation was a stage to analyze and evaluate the results of the Associative Classification process, namely the accuracy value of the Associative Classification rules obtained with the CBA (Classification-based Association) algorithm.
Results and discussion contained a discussion of the application usage in the Associative Classification process with the CBA (Classification based Association) algorithm, evaluating and analyzing the results.
Application usage discusses the application the user used when using the Associative Classification application. When the user used the Associative Classification application, the user would see the home display in the Associative Classification application. The application home menu included the first display visited by the user when using the Associative Classification application. Furthermore, the user entered transaction data that would be used to perform the Associative Classification process. The initial data inputted would be displayed on the load data menu of the Associative Classification application. The data would be converted into transformed data with predefined attributes. The transformed data results on the load data menu, as shown in Figure 3.
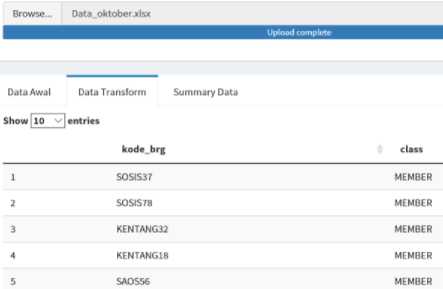
Figure 3. Application Data Load Menu
Figure 3 shows the load data menu displaying transformed data from the initial data entered by the user in the Associative Classification application. Data transform had two attributes, namely item code, and class. Class is customer information that has made transactions at frozen food stores. These two attributes would be converted into data frames.
To be used in performing the Associative Classification process with the CBA (Classification based Association) algorithm, the process is found in the CBA menu, where the user must input the CBA parameters, as shown in Figure 4.
Parameter CBA
∩_______
. Iiiiiiiiii 0.01 0.21 0.41 0.61 0.811
llllιιlllll 0.1 0.28 0.46 0.64 0.821
-
Figure 4. CBA Parameters
Figure 4 shows the CBA parameters display that must be inputted by the user to get the rules result in the Associative Classification process with the CBA (Classification based Association) algorithm. The CBA parameter had input from minimum support with a value from 0.01 to 1 and minimum confidence from 0.1 to 1. The user would input the sales transaction data's minimum support and confidence values. The user would obtain the rules result after inputting the CBA parameters, as shown in Figure 5.
Summary Ilayl Rule* AC Ikst Rules
± Download RuIcsCBA
|
Show 110 v entries |
V≡r.3 |
rhs | |
|
Ihs | |||
|
W |
(kαde brg=BAKSO26∣ |
=* |
IclJss-MtMBtR) |
|
PJ |
(kθde Lrg-NAGt I ⅛) |
=» |
(Class=MtMtilK) |
|
PJ |
(kode bqrSOSlS57) |
≡> |
{class-MΓMBIR) |
|
HI |
IkodeJwg=SAOSMl |
⊂> |
Iclass=MEMKR) |
|
Pl |
{k □deJwg=Kf NTΛNG27) |
≡⅛ |
IcIass=MFMIVR) |
|
W |
(kode.br g≈SCAHOPOβ∣ |
=> |
IcIass=MEMBER) |
|
in |
Ikodc-Iwg=NAGETOAl |
≈> |
IcIass-MEMBER) |
|
(«1 |
(kode brg=NAGET58∣ |
=» |
(Class-MtMBtR) |
|
PJ |
3kodC-br∣ζ<ORNΠ02J |
¾ |
(Class=MEMBtR) |
|
IWl |
∣kodc-bτg-KENTANG23∣ |
∙=> |
Iclass=MEMBER) |
-
Figure 5. CBA A Menu
Figure 5 shows the CBA menu display that displays the rules result obtained in the Associative Classification process with the CBA (Classification based Association) algorithm from the data that had been inputted. Rules result in the image above have a value shown in Figure 6.
|
support |
confidence |
coverage |
lift |
|
0.0104704732653916 |
0.974025974025974 |
0.010749685885802 |
1.24543878114032 |
|
0.0226162222532458 |
0.9/00598802 19⅛21 |
0.0233142538042/2 |
1.24036/533408 73 |
|
0.0100516543347759 |
0.96 |
0.0104704732653916 |
1.2275044626919 |
|
0.0221974033226302 |
0.957831325301205 |
0.0231746474940667 |
1.22473148574304 |
|
0.0203825212899623 |
0.948051948051948 |
0.0714993717716041 |
1.21222708030991 |
|
0.0209409465307832 |
0 943396226415094 |
0.0221974033226302 |
1.20627403959502 |
|
0.0114477174368281 |
0.942528735632184 |
0.012145 74898 78543 |
1.20516482208 735 |
|
0.0269440178696077 |
0 936893203883495 |
0.0287588999022756 |
1.19795894670073 |
|
0.0164735446042161 |
0.936507936507937 |
0.01759039S0858579 |
1.19746632438528 |
|
0.0198240960491414 |
0 928104575163399 |
0.0213597654613989 |
1.18672136235191 |
-
Figure 6. CBA B Menu
The CBA rules result included the value of support, confidence, coverage, and lift ratio. These values could be used as a reference for the accuracy level of a rule. From frozen food sales transaction data, the Associative Classification process with the CBA algorithm, with specific support, Confidence, Coverage, and Lift parameter values, will produce rules used for Classification. Rules resulting from the Associative Classification process with the CBA (Classification based Association) algorithm could be downloaded in .xls file format.
Results evaluation was done to determine the accuracy of the CBA (Classification based Association) algorithm in the testing that had been carried out. Accuracy was achieved by calculating the level of support, confidence, coverage, and lift ratio values generated by the CBA
(Classification-based Association) algorithm. Data testing was conducted on data from October to January, where the number of rules obtained differed based on the minimum support and minimum confidence inputted by the user. Testing conducted with a minimum support of 1% and a minimum confidence of 10% obtained 28 rules. This number differed from the minimum support of 2% with a minimum confidence of 10%, which acquired two rules. It indicated that the smaller the minimum support and confidence, the greater the number of rules obtained. After conducting several experiments, the minimum value for support is 1%, and confidence is 10%. The maximum value will be reached in the Overfitting condition.
This evaluation used 90% training data in October with 6234 transactions that obtained 28 rules with a minimum support of 1% and a minimum confidence of 10%. The following ten rules from the results of the rules obtained in October can be seen in Table 2.
Table 2. Evaluation of CBA Algorithm of 90% Training Data
|
No |
Support |
Confidence |
Coverage |
Lift |
|
1 |
0.013 |
0.977 |
0.013 |
1.28 |
|
2 |
0.024 |
0.961 |
0.025 |
1.26 |
|
3 |
0.011 |
0.945 |
0.011 |
1.24 |
|
4 |
0.026 |
0.931 |
0.028 |
1.22 |
|
5 |
0.010 |
0.916 |
0.011 |
1.20 |
|
6 |
0.010 |
0.916 |
0.011 |
1.20 |
|
7 |
0.018 |
0.912 |
0.020 |
1.19 |
|
8 |
0.011 |
0.911 |
0.012 |
1.197 |
|
9 |
0.022 |
0.909 |
0.024 |
1.194 |
|
10 |
0.021 |
0.905 |
0.023 |
1.18 |
|
Overall Rules Accuracy |
0.75 |
Table 2 shows 10 rule results obtained from 28 rules in the testing with October transaction data on 90% training data. Rule number 1 included the rule KNAGA01 => class=MEMBER with the highest lift ratio value of 1.28 and a confidence value of 0.97. It was concluded that item KNAGA01 was often purchased item by class member customers with a confidence level of 97%, which was the certainty value obtained from the combination of items in a rule. The lift ratio value was used to measure how accurate the resulting rule was. The higher the lift ratio value, the greater the rule accuracy strength. The accuracy obtained from all 28 rules had an accuracy rate of 0.75. The results of the rules were obtained using 80% training data in October, which had a different number of rules, namely, 26 rules with a minimum support of 1% and a minimum confidence of 10%. The following ten rules from the results of the rules obtained in October can be seen in Table 3.
|
Table 3. Evaluation of CBA Algorithm of 80% Training Data No Support Confidence Coverage Lift | ||||
|
1 |
0.013 |
0.98 |
0.01 |
1.29 |
|
2 |
0.024 |
0.96 |
0.02 |
1.26 |
|
3 |
0.027 |
0.95 |
0.02 |
1.24 |
|
4 |
0.010 |
0.93 |
0.01 |
1.23 |
|
5 |
0.022 |
0.92 |
0.02 |
1.21 |
|
6 |
0.023 |
0.92 |
0.02 |
1.21 |
|
7 |
0.013 |
0.90 |
0.01 |
1.19 |
|
8 |
0.011 |
0.90 |
0.01 |
1.18 |
|
9 |
0.016 |
0.90 |
0.01 |
1.18 |
|
10 |
0.013 |
0.90 |
0.01 |
1.18 |
|
Overall Rules Accuracy |
0.74 | |||
Table 3 shows the 10 rule results obtained from 26 rules in the testing with October transaction data that had been carried out. Rule number 1 included the rule code_brg=KNAGA01 => class=MEMBER with the highest lift ratio value of 1.29 and a confidence value of 0.98. It was concluded that item KNAGA01 was often purchased item by class member customers with a confidence level of 98%, which was the certainty value obtained from the combination of items in
a rule. The accuracy obtained from all 26 rules had an accuracy rate of 0.74. The accuracy rate of all rules with 80% and 90% training data differed. It indicated that the greater the number of rules obtained, the greater the accuracy rate. The rule results obtained on 90% of training data in October differed from those in November, which were 26 rules. The following ten rules from the results obtained in November with 90% training data can be seen in Table 4.
Table 4. Evaluation of CBA Algorithm Results of 90% Nov Data
|
No |
Support |
Confidence |
Coverage |
Lift |
|
1 |
0.010 |
0.971 |
0.010 |
1.27 |
|
2 |
0.025 |
0.959 |
0.026 |
1.25 |
|
3 |
0.024 |
0.959 |
0.025 |
1.25 |
|
4 |
0.011 |
0.950 |
0.012 |
1.24 |
|
5 |
0.011 |
0.939 |
0.012 |
1.22 |
|
6 |
0.020 |
0.925 |
0.022 |
1.20 |
|
7 |
0.022 |
0.923 |
0.023 |
1.20 |
|
8 |
0.018 |
0.911 |
0.020 |
1.19 |
|
9 |
0.026 |
0.907 |
0.029 |
1.18 |
|
10 |
0.013 |
0.907 |
0.014 |
1.18 |
|
Overall Rules Accuracy |
0.76 |
Table 4 shows the 10 rule results obtained with 90% training data in November, with a minimum support of 1% and a minimum confidence of 10%. Rule 1 included FLAT28 => class=MEMBER with the highest lift ratio value of 1.27. It indicated that KENTANG28 was often purchased item by member customers in November, with a value of 97% confidence. The accuracy obtained from all 26 rules had an accuracy rate of 0.76. The results of the rules obtained using 80% training data in November, which had a different number of rules, namely 27 rules with a minimum support of 1% and a minimum confidence of 10%, are shown in Table 5.
Table 5. Evaluation of CBA Algorithm Results of 90% Nov Data
|
No |
Support |
Confidence |
Coverage |
Lift |
|
1 |
0.010 |
0.96 |
0.010 |
1.26 |
|
2 |
0.023 |
0.95 |
0.025 |
1.24 |
|
3 |
0.012 |
0.94 |
0.012 |
1.23 |
|
4 |
0.020 |
0.94 |
0.021 |
1.23 |
|
5 |
0.012 |
0.93 |
0.013 |
1.22 |
|
6 |
0.023 |
0.93 |
0.025 |
1.21 |
|
7 |
0.011 |
0.93 |
0.012 |
1.21 |
|
8 |
0.019 |
0.91 |
0.021 |
1.20 |
|
9 |
0.013 |
0.90 |
0.014 |
1.18 |
|
10 |
0.012 |
0.9 |
0.013 |
1.17 |
|
Overall Rules Accuracy |
0.77 | |||
Table 5 shows 10 rule results from 80% training data with a minimum support of 1% and a minimum confidence of 10%. The rule with the highest lift ratio value on 80% of training data differed from 90% of training data, which was 1.26, with a confidence value of 96%. The overall rules accuracy obtained differed from the overall rules accuracy on the 90% training data with a value level of 0.77. It indicated that the greater the number of rules obtained, the greater the overall rules accuracy.
Likewise, the results of the rules were obtained using other months of transaction data using the CBA (Classification based Association) algorithm, which had a different number of rules.
The results of processing sales transaction data from October to January using the CBA (Classification based Association) algorithm to see the pattern of associative classification rules formed with parameters, namely the support value, confidence value, coverage value, and lift ratio value. Associative classification rules with the CBA (Classification based Association) algorithm were selected based on the highest lift ratio value, which was different every month with
two classes, namely general and member classes. A comparison of the rule results used was using 90% training data with a minimum support parameter of 1% and a minimum confidence of 10%. It can be seen in Table 6.
Table 6. Analysis of CBA Algorithm Results
|
bln |
Rules |
Supp |
Conf |
Cov |
Lift |
|
1 |
KNAGA01 => class=MEMBER |
0.0136 |
0.97 |
0.01 |
1.28 |
|
KENTANG13} => class=UMUM |
0.013 |
0.67 |
0.01 |
2.8 | |
|
2 |
KENTANG28 => class=MEMBER |
0.010 |
0.97 |
0.01 |
1.27 |
|
KENTANG13 => class=UMUM |
0.018 |
0.62 |
0.03 |
2.6 | |
|
3 |
SAOS58 => class=MEMBER |
0.010 |
0.98 |
0.01 |
1.27 |
|
KENTANG13 => class=UMUM |
0.019 |
0.6 |
0.03 |
2.6 | |
|
4 |
BAKSO26 => class=MEMBER |
0.010 |
0.98 |
0.01 |
1.26 |
|
KENTANG13 => class=UMUM |
0.016 |
0.63 |
0.02 |
2.9 |
Table 6 shows the analysis of four months of sales transaction data. Each month, the rules results on the member and general classes obtained different results based on the highest lift ratio value. The rule with the highest lift ratio value with four months of transaction data on the member class fell on month 1 data with the rule {code_brg=KNAGA01} => {class=MEMBER}. It indicated that member customers often purchased the item code KNAGA01 with the highest level of accuracy compared to the rules obtained from each other month's data. In contrast to the rule results obtained in the general class, which showed the consistency of the same rule results in the data every month with the highest accuracy based on the lift ratio value which produced the rule {code_brg=KENTANG13} => {class=General} in month 4. This rule showed that general customers often purchased item code KENTANG13 with the same consistency level every month. The comparison of the rules obtained could be used as a decision in the sales strategy by providing discounts or rewards shown to customers.
The application of Associative Classification with the CBA (Classification based Association) algorithm using R and the Shiny framework was able to apply classification cases based on associations in determining often purchased items by general customers and members by processing attribute data according to the criteria to form rules using minimum support and minimum confidence parameters. The rules results obtained in the application of Associative Classification used a minimum support parameter of 1% and a minimum confidence of 10% in the application of Associative Classification. The greater the number of rules obtained, the greater the overall accuracy value level. The ruleitems obtained had the best accuracy based on the lift ratio. It could be used to give discounts or rewards to loyal customers.
References
-
[1] K. Nisa, “Penerapan Data Mining Terhadap Data Transaksi Sebagai Pendukung Informasi Strategi Penjualan Menggunakan Algoritma Apriori,” Jurnal Teknik Informatika Unika Santo Thomas, vol. 6, no. 2, pp. 306–315, 2021.
-
[2] A. Erfina, M. Melawati, and N. Destria Arianti, “Penerapan Metode Data Mining Terhadap Data Transaksi Penjualan Menggunakan Algoritma Apriori (Studi Kasus: Toko Fasentro Fancy),” Jurnal Ilmiah Sains dan Teknologi(SANTIKA), vol. 10, no. 1, pp. 11–17, 2020.
-
[3] F. R. Pare, O. Wati, L. P. Taran, and L. M. Arsai, “Penerapan Data Mining Pada Transaksi
Penjualan Barang Menggunakan Metode Apriori (Studi Kasus:Toko BE-MART),” Jurnal Teknologi Terapan G-Tech, vol. 7, no. 1, pp. 255–261, 2023.
-
[4] A. Maulana and A. A. Fajrin, “Penerapan Data Mining Untuk Analisis Pola Pembelian Konsumen Dengan Algoritma Fp-Growth Pada Data Transaksi Penjualan Spare Part Motor,” Klik - Kumpulan Jurnal Ilmu Komputer, vol. 5, no. 1, p. 27, 2018.
-
[5] P. N. Harahap and S. Sulindawaty, “Implementasi Data Mining Dalam Memprediksi Transaksi Penjualan Menggunakan Algoritma Apriori (Studi Kasus PT.Arma Anugerah Abadi Cabang Sei Rampah),” Matics, vol. 11, no. 2, p. 46, 2020.
-
[6] Siregar Simon Sadok and Friska Abadi, “Penerapan Frozen Food Technology Di Ukm Mimingfish Untuk Meningkatkan Diversifikasi Produksi Dan Ekonomi,” Pro Sejahtera, pp. 2656–5021, 2021.
-
[7] K. D. Rajab, "New Associative Classification Method Based on Rule Pruning for
Classification of Datasets," IEEE Access, vol. 7, pp. 157783–157795, 2019.
-
[8] A. F. Andikos and H. Andri, “Pengujian Association Clasification Dalam Meningkatkan
Kualitas Minyak Sawit Sebagai Bahan Dasar Biodisel,” Jurnal Media Informatika Budidarma, vol. 3, no. 4, p. 340, 2019.
-
[9] H. F. Ong, C. Y. M. Neoh, V. K. Vijayaraj, and Y. X. Low, "Information-Based Rule Ranking for Associative Classification," 2022 International Symposium on Intelligent Signal Processing and Communication Systems (ISPACS), 2022.
-
[10] C. Thanajiranthorn and P. Songram, "Efficient rule generation for associative classification," Algorithms, vol. 13, no. 11, 2020.
-
[11] P. U. Gio and A. R. Effendie, Belajar Bahasa Pemrograman R, vol. 1, no. 1. 2017.
-
[12] I. P. A. P. Wibawa, I. K. A. Purnawan, D. P. S. Putri, and N. K. D. Rusjayanthi, “Prediksi Partisipasi Pemilih dalam Pemilu Presiden 2014 dengan Metode Support Vector Machine,” Jurnal Ilmiah Merpati (Menara Penelitian Akademika Teknologi Informasi), p. 182, 2019.
-
[13] M. Hahsler, I. Johnson, T. Kliegr, and J. Kuchar, "Associative classification in R: Arc, arulesCBA, and rCBA," The R Journal, vol. 11, no. 2, pp. 254–267, 2019.
-
[14] N. Abdelhamid and F. Thabtah, "Associative Classification Approaches: Review and Comparison," Journal of Information & Knowledge Management, vol. 13, no. 3, 2014.
-
[15] W. Cao, Q. Zhong, H. Li, and S. Liang, "A Novel Approach for Associative Classification Based on Information Entropy of Frequent Attribute Set," IEEE Access, vol. 8, pp. 140181– 140193, 2020.
-
[16] D. Sasirekha and A. Punitha, "A comprehensive analysis on associative classification in medical datasets," Indian Journal of Science and Technology, vol. 8, no. 33, 2015.
-
[17] M. Abrar, A. T. H. Sim, and S. Abbas, "Associative classification using automata with structure based merging," International Journal of Advanced Computer Science and Applications(IJACSA), vol. 10, no. 7, pp. 672–685, 2019.
-
[18] F. Padillo, J. M. Luna, and S. Ventura, "Evaluating associative classification algorithms for Big Data," Big Data Analytics, vol. 4, no. 1, 2019.
-
[19] L. Venturini, E. Baralis, and P. Garza, "Scaling associative classification for very large datasets," Journal of Big Data, vol. 4, no. 1, 2017.
-
[20] F. Jiří and T. Kliegr, "Classification based on associations (CBA) - A performance analysis," CEUR Workshop Proceedings, vol. 2204, 2018.
35
Discussion and feedback