The Influence Of Applying Stopword Removal And Smote On Indonesian Sentiment Classification
on
LONTAR KOMPUTER VOL. 14, NO. 3 DECEMBER 2023
DOI : 10.24843/LKJITI.2023.v14.i03.p05
Accredited Sinta 2 by RISTEKDIKTI Decree No. 158/E/KPT/2021
p-ISSN 2088-1541
e-ISSN 2541-5832
The Influence Of Applying Stopword Removal And Smote On Indonesian Sentiment Classification
Arif Bijaksana Putra Negaraa1
aUniversitas Tanjungpura
Abstract
Information, like public opinions or responses, can be obtained through Twitter tweets. These opinions can expressed as a sentiment. Sentiments can be positive, neutral, or negative. Sentiment analysis (opinion mining) on a text can performed through text classification. This research aims to determine the influence of implementing Stopword Removal and SMOTE on the sentiment classification model for Indonesian tweets. The algorithms used in this research are Logistic Regression and Random Forest. Based on the evaluation, the best classification model in this research was achieved by implementing the Random Forest algorithm along with SMOTE, with an f1-score value of 75.03%. Meanwhile, implementing the Random Forest algorithm and Stopword Removal achieved the worst classification model, with an f1-score value of 68.09%. Implementing Stopword Removal in both algorithms has a negative impact in the form of a decrease in the resulting f1-score. Meanwhile, the performance of SMOTE provides a positive impact in the form of an increase in the resulting f1-score. This happened since Stopword Removal could reduce information and alter the meaning of processed tweets, causing the tweet to lose its sentiment.
Keywords: Sentiment Analysis, Stopword Removal, Grid Search, SMOTE, Logistic Regression, Random Forest
In producing information, a collection of factual and actual data must be managed. The dissemination of information can be considered highly rapid, owing to the abundance of digital channels/platforms accessible for expressing ideas and opinions. Social media stands as the most widely used digital platform, thus making disseminating information through social media more efficient and swifter. Twitter is a popular social media platform in Indonesia. Twitter provides a space for its users to interact/discuss through short text messages as a means of its utilization. Thus, the data generated is known as tweets, which, when processed, will result in information. One is public sentiment/opinion, which can serve as a reference for reciprocal societal responses. Sentiments can classified into three categories: positive, neutral, and negative. Sentiment data is typically gathered manually, including methods such as distributing questionnaires. However, in practice, it can be pretty time-consuming and labor-intensive, so tweet data retrieval is more efficient to use. Sentiment classification can be achieved by applying classification methods to text, known as sentiment analysis or opinion mining.
Generally, there are four stages of sentiment analysis: text preprocessing, data vectorization, modeling, and evaluation. Data Cleaning and Modeling stages play a crucial role in sentiment analysis, as both generate the dataset and classification model. The dataset that has been developed is used as training data to obtain a classification model. An accuracy evaluation is performed on this classification model. The text preprocessing stage is conducted on tweet data to handle noise or disturbances, such as using non-standard words, abbreviations, and slang. Stopword Removal is one of the methods commonly applied at the Text Preprocessing stage [1]. Stopword Removal involves eliminating words that are pretty common and frequently appear but do not significantly impact the meaning of a text or sentence. The implementation of Stopword Removal is expected to yield a better dataset. Several parties have conducted research related to the performance of Stopword Removal. This includes an experiment involving the application of Stopword Removal and Stemming using the LSTM (Long Short Term-Memory) algorithm,
where the highest accuracy value was obtained when Stopword Removal and Stemming were not applied, with an accuracy score and f1-score of 0.82 [1].
The modeling stage involves generating a classification model from the input dataset and utilizing a classification algorithm. The parameters of the algorithms are optimized by applying Hyperparameter Tuning. Grid Search is an algorithm that can select a combination of hyperparameters to achieve the highest accuracy value. The parameter values that are obtained are implemented in the classification model. Classification modeling is performed using the Logistic Regression and Random Forest algorithms. This is because, in their implementation, both algorithms can produce good accuracy values and process large amounts of data [2]. Research on implementing Grid Search as a Hyperparameter compared KNN and Logistic Regression Algorithms for classifying emotions in Indonesian tweets with the performance of TF-IDF and Grid Search [3]. The highest accuracy result value was achieved with the Logistic Regression algorithm and the implementation of TF-IDF and Grid Search, yielding an accuracy and f1-score of 65% and 66%, respectively. In General, the performance of methods and algorithms applied for sentiment classification tends to be suboptimal when the utilized dataset is imbalanced [4]. Imbalanced data was handled with SMOTE (Synthetic Minority Oversampling Technique). SMOTE is a technique used to address imbalanced data issues by generating synthetic new data from the minority type in the dataset, thus achieving a balance between classes [5]. With the presence of SMOTE, the dataset will not be biased towards the majority class. Therefore, it is expected to optimize the performance of classification methods and algorithms. Research related to the implementation of SMOTE was the analysis of sentiment in Tokopedia's Twitter tweets using the Naïve Bayes and Random Forest algorithms; it was found that the performance of SMOTE could increase the accuracy values for the Naïve Bayes and Random Forest algorithms by 3.4% and 1.55% respectively. The highest accuracy value achieved by the Random Forest algorithm with the implementation of SMOTE is 86.89% [6].
Based on the presented description, this research will analyze the impact of applying Stopword Removal and SMOTE on the resulting f1-score values. This research employs two classification algorithms, Logistic Regression and Random Forest, for machine classification modeling. Then, the f1-score values produced by both algorithms will be compared to determine which algorithm's application is more optimal for performing sentiment analysis on Indonesian language tweets.
-
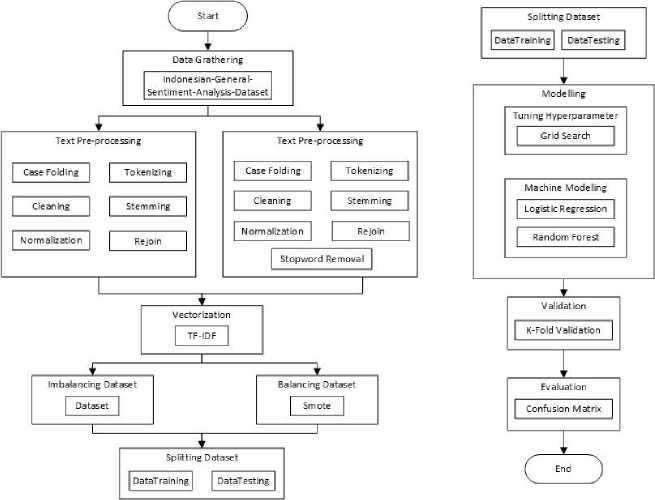
Figure 1. Research Methods
Figure 1 shows the steps of methods that were carried out in this research. There are eight consecutive method stages to be performed. The process starts with data gathering, text preprocessing, vectorization, balancing dataset, splitting dataset, modeling, validation, and evaluation.
In data gathering, the data collected consists of Indonesian text data taken from the research conducted by Ridi Ferdiana, Fahim Jatmiko, Desi Dwi Purwanti, Artmita Sekar Tri Ayu, and Wiliam Fajar Dicka in 2019, entitled 'Indonesian Dataset for Sentiment Analysis' [7]. The data was collected using the Twitter Streaming API over four months, starting from September to December 2018, using Indonesian standard conjunction words as keywords such as adalah, yaitu, juga, and seperti. This dataset consists of 10,820 labeled sentences categorized into three sentiment classes: 3,228 positive sentences, 3,556 neutral sentences, and 4,036 negatives. The Indonesian Sentiment Analysis Dataset is an Excel dataset stored in (.csv) format. The sentence samples in the dataset can be seen in Table 1.
Table 1. Dataset Indonesia
|
No |
Tweet |
Label |
|
1 |
persahabatan ialah saat kita memberi namun tak mengharapkan balasan |
Netral |
|
2 |
Rajin makan tahu bisa pintar |
Positif |
|
3 |
buset dah aku udah pasrah aja klo ketemu yg beginian |
Negatif |
Text preprocessing refers to steps or techniques used to clean, organize, and transform raw text into a more easily processed form by natural language processing (NLP) models or other computational systems. The goal is to enhance the quality of text data and facilitate further analysis or processing. This involves lowercasing, tokenization, text cleaning, stopword removal, stemming or lemmatization, normalization, and vectorization. The ultimate aim is to simplify and reduce the complexity of the text, making it easier for models to extract relevant patterns or information.
The text preprocessing steps in this research include the following.
-
a. Cleaning
In the cleaning process, the tweets in the Indonesian Dataset for Sentiment Analysis are cleaned by removing punctuation or delimiters, numbers, symbols, and usernames [1].
-
b. Case Folding
In the case folding process, the characters of each word in the data are standardized by converting all letters in each word to lowercase [8].
-
c. Normalization
In the normalization process, changes and language normalization are applied to words, where non-standard words, abbreviations, and words in colloquial and slang language are transformed into words that adhere to the proper rules of writing in the Indonesian language, as per the guidelines of the 'Kamus Besar Bahasa Indonesia' (KBBI) [9].
-
d. Tokenizing
In tokenizing, the sentences are split into words or tokens using white spaces or spaces [10].
-
e. Stopword Removal
In the stopword removal process, words that often commonly occur but are insignificant and irrelevant are removed, such as conjunctions and possessive and personal pronouns [1].
-
f. Stemming
In the stemming process, the words are transformed into base forms by removing prefixes and suffixes [11].
-
g. Rejoin
In the rejoin process, the words or tokens resulting from the stemming process are recombined into a complete sentence [11]
The results of the Data Cleaning stage or text Preprocessing on the sample dataset can be seen in Table 2.
Table 2. Text Preprocessing
|
No |
Teks Preprocessing |
|
1 |
Tampang kriminal ,pasti malu keluarganya punya anak gak punya akhlak begini. e au |
|
2 |
Tampang kriminal pasti malu keluarganya punya anak Cleaning gak punya akhlak begini |
|
3 |
tampang kriminal pasti malu keluarganya punya anak gak punya akhlak begini ase o ng |
|
4 |
tampang kriminal pasti malu keluarganya punya anak Normalization enggak punya akhlak begini |
|
5 |
['tampang', 'kriminal', 'pasti', 'malu', 'keluarganya', 'punya', 'anak', 'enggak', 'punya', 'akhlak', 'begini'] Tokenizing |
|
6 |
['tampang', 'kriminal', 'malu', 'keluarganya', 'anak', 'akhlak'] Stopword Removal |
|
7 8 |
['tampang', 'kriminal', 'malu', 'keluarga', 'anak', 'akhlak'] Stemming tampang kriminal malu keluarga anak akhlak Rejoin |
2.3. Frequency Distribution
Frequency Distribution is carried out to determine the number of occurrences or frequency of a particular word. This research performs the frequency counting process using the FreqDist function in the NLTK library. Frequency distribution for text preprocessing data and text
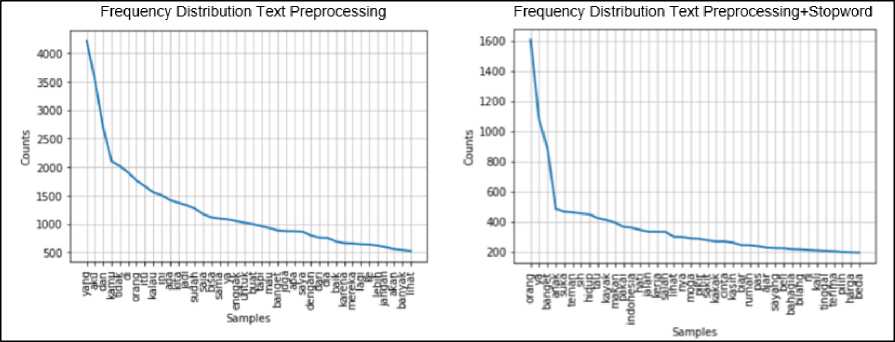
preprocessing + stopword removal data can be seen in Figure 2.
-
Figure 2. Frequency Distribution
The number of vocabulary and tokens in text preprocessing data and text preprocessing + stopword removal data can be found in Table 3.
|
Table 3. Detail Vocabulary & Token | |
|
Total Vocabulary & Token Dataset | |
|
Total Vocabulary |
7.617 |
|
Total Token |
148.961 |
|
Total Vocabulary & Token Dataset Stopword | |
|
Total Vocabulary |
7.506 |
|
Total Token |
73.623 |
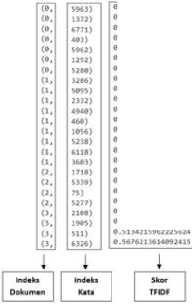
In Vectorization, word occurrence vectors in documents are created using TF-IDF weighting. TF-IDF (Term Frequency – Inverse Document Frequency) is a method of weighting and vectorizing each word (Term) in text data into numerical values by combining two modeling concepts, Term Frequency (TF) and Inverse Document Frequency (IDF). TF (Term Frequency) represents the
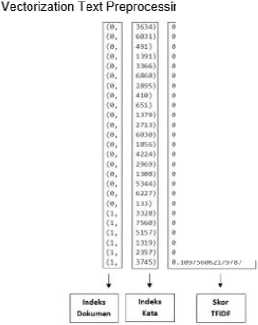
frequency of a word's occurrence in a sentence within text data. At the same time, IDF (Inverse Document Frequency) calculates how a word is distributed across text data [12]. This weighting is performed because computers only understand and process data numerically. In this research, the TF-IDF vectorization process is performed using the TfidfVectorizer() and fit_transform() functions in the Scikit-Learn library. The results of weighting/vectorization for the dataset Text Preprocessing and Text Preprocessing + Stopword Removal can be seen in Figure 3. It consists of three parts: document index, word index, TF-IDF score, and Vocabulary Content.
Vectorization Text Preprocessing
tΓj97≡93S∏665βi3i D.z9S7*seiwβ62i9n ft.192⅞lfl99849322U 0.298⅛M85176541β33 0.616717536B9SW92
A. 2a2⅞Mθl ISSliftB ⅛.41MMSJMW0744S 0.24MJJ7532βe⅛5SJ 0.1 TMlMSBlTflBfltf?
BaSiftftTftMTWTSMft ft .094M5Wβ⅛S994 MS 0,15295977065595*76 0.19481970837704607 ⅛.17i26901i8⅛797M 0.4⅛75mi62⅛97⅛i ft,76 7« 10)7966M7 5 0.4S6780B387150ββ46 0.3aj6WM974B89i56 0.5127827587963659 0,5S7507MMWH67 B-MMlTiTMtfSJftl S,«t«M5WM53571 B.51M215962J2S6i4
Vocabulary Content!
{⅛ku': 133, ⅛e∣a∣u': 6227, 'ρertahanin': 5344, 'dapaf: 1308, Tsalau': 2969, 'memeli 4234, ⅛ngga∣i': 1856, 'salah': 6030, ,jadi,: 2 713, 'dengan': 13/9, 'begitu': 651, 'atas': 410, juga': 2695, Tau': 6868, 'kita': 3366, lCkpan': 1391, ’bakal': 491. ⅛ah∣πr: 6031/lagi': 3634, ‘laki’: 3647. 'sejati'; 6195. 'akan-: 110, ’pergi': 5301, 'dan': 1294, 'cari': 1072. 'bahagia': 468, 'baru': 577, 'orang': 5001, 'lain': 3644, 'karena': 3049, ’rasa’; 5723, 'diri’: 1612, ‘lebih’: 3745, 'harga': 2 357, 'daripada': 1319, 'pasang': 5157, 'yang': 7560, 'khianat': 3 328,
+ Stopword Removal
∙.44Wl*7Maj)W55 B.3S134ll24∞l354e >,WJ7tSWWlH Φ.2∙α7⅞7M2M461β5 ⅛. ISflMftflTeftBftflMTS ». JMMftJi WTfll SM ». IS J*4S3⅛SBa⅛54βM
VantMPeneitfTt ft. SMHiSflTJHSftOi
8.1KS3i9i4KTSM17 ft.l7V87i3JWβlfl844?
i.iUJ»?lt»MtMJ 6.14577714a⅛935T9 ». 1 W5⅛⅛M6717<∣M ∙, ITnnaMiiMBMa ft. 1*M9M6MJ1⅛41M e. law riB¾eeβJS323
»,2Z»5*i»7ww7M5 !.MftOOSll 1 IftTTBflftft J-16M21M1¾99452 »-163Wt61«?il2fl6 ».14111462 WftTll J S lft⅛756β62inT87
Vocabulary content:
Vpertahanin': 5280, 'dapat': 1292, ’salah': 5962, 'atas': 403, 'tau': 6771, 'depan': 1372, 'salah in’: 5963, 'laki': 3603, 'sejati'; 6118, 'pergi'; 5238, 'cari'; 1056, 'bahagia': 460, 'orang'; 4940, 'harga'; 2332, 'pasang*; 5095, 'khianat': 3286, 'personal': 5277, 'agenda': 75, 'ρi∣ih': 5339r 'duluan': 1718, Theilaon': 6326r 'band': 511, Yavorif: 1905, 'generasi': 2108,
-
Figure 3. Vectorization Dataset
The Indonesian Dataset for Sentiment Analysis is balanced using SMOTE. SMOTE or Synthetic Minority Oversampling Technique is a technique introduced by Nithes V Chawla to address imbalanced datasets [5]. By augmenting the minority class data through synthetic data generated from replicating the minority class instances, SMOTE balances the distribution of minority and majority class data in the dataset. The synthetic data or new samples are obtained by finding the k-nearest neighbors of each data point in the minority class and then creating replicas of those data points [13]. The result of dataset balancing can be seen in Figure 4.

Figure 4. SMOTE
The dataset is divided into two parts: training data and testing data. Training data is used to train the system to recognize the desired patterns. Testing data is used to evaluate the trained system's performance. In this research, the dataset is divided into 90% training data and 10% testing data; the splitting of training and testing data in the dataset can be seen in Figure 5.

Figure 5. Splitting Dataset
-
2.7. Tuning Hyperparameter
Tuning Hyperparameters is a process to optimize the performance of machine learning by selecting the best and optimal hyperparameters. Then, the chosen hyperparameters will be implemented in the machine learning classification algorithm modeling. In this research, the method for Hyperparameter Tuning is Grid Search. Grid Search is an algorithm that is applied to select the best variations of parameters by working through the process of combining all the input parameters. In its implementation, Grid Search typically involves defining a dictionary to store all the hyperparameters that need to be combined or searched for first. Then, this algorithm will perform model calculations based on all the stored hyperparameters. After that, the bestperforming hyperparameter combination for the machine modeling will be obtained based on the resulting f1-score values [14]. The hyperparameters that will undergo Hyperparameter Tuning are the C values in Logistic Regression and the values for Estimators, Max_depth, Max_features, and Criterion in Random Forest.
Machine Modeling designed in this research employs two classification algorithm approaches: Logistic Regression and Random Forest. Sixteen classification machine models are constructed, consisting of eight Logistic Regression models and eight Random Forest models.
Logistic Regression is a data analysis technique in statistics designed to determine the relationship between a dependent variable and one or more independent variables. This technique is also known as a regression model. In applying logistic Regression, the dependent variable used is categorical (nominal or ordinal), while the independent variable is categorical or continuous [15].
Random Forest is an Ensemble Classifier algorithm, which, in its implementation, combines several methods by combining multiple Decision Trees. Its functioning involves combining and performing majority voting on the outcomes of each Decision Tree, ultimately resulting in the final classification class/decision [16]. The Decision Trees constructed by Random Forest are formed through random data sampling and considering all the features. Decision Trees consist of root, internal, and leaf nodes created by considering information gained to determine the root node and rules[17].
The testing scenarios constructed in this research consist of four model scenarios for each algorithm. The details of the scenarios can seen in Table 4.
Table 4. Testing Scenario
|
Testing Scenario |
Stopword Removal |
Smote |
Classification Algorithm |
|
Scenario 1 |
- |
- |
LG / RF |
|
Scenario 2 |
ѵ |
- |
LG / RF |
|
Scenario 3 |
- |
ѵ |
LG / RF |
|
Scenario 4 |
ѵ |
ѵ |
LG / RF |
In this research, the evaluation is conducted on the training data using 10-fold cross-validation (CV) and on the testing data using Confusion Matrix. 10-Fold Cross Validation divides the dataset into ten parts (folds), where one part (fold) later becomes training data (validation fold), and the remaining nine parts (fold) become test data (train fold). Measurements are repeated iteratively until each part (fold) out of the ten parts (folds) has been used as the training data (validation fold). Then, the average accuracy value of the 10-fold cross-validation (CV) conducted on the training dataset is a benchmark for the validation results. Confusion Matrix is used to evaluate the performance of a classification model. Within the confusion matrix, there is information related to the actual classification and predictions made by the classification model, allowing for the
calculation of accuracy, precision, and recall values as benchmarks for the performance produced by the classification model [18].
This section contains the results and discussion of the conducted research. Details and specific results using methods and algorithms can be presented as descriptions, charts, or figures.
The results of Tuning Hyperparameter using Grid Search on the Logistic Regression and Random Forest algorithms can observed in Table 5. It includes detailed values for the parameter C in the Logistic Regression algorithm and the parameters Estimators, Max-depth, Max-features, and Criterion in the Random Forest algorithm.
|
Table 5. Tuning Hyperparameter | |||
|
Logistic Regression | |||
|
Scenario |
Hyperparameter | ||
|
C | |||
|
1.9100000000000008 1.4100000000000004 2.4 2.7400000000000015 | ||
|
Random Forest | |||
|
Scenario |
Hyperparameter | ||
|
Estimators |
Max-depth |
Max-features Criterion | |
|
1 2 3 4 |
500 400 500 450 |
193 211 197 155 |
Log2 Entropy Log2 Entropy Log2 Entropy Log2 Gini |
The evaluation in this research refers to the results of 10-fold cross-validation and the confusion matrix. It is based on the achievement of the highest f1-score value, the comparison of each scenario to the default scenario, and the influence of applying each method in the scenario for each algorithm. Then, the results from both algorithms are compared to determine the best performance achieved between them.
The evaluation results of Logistic Regression are shown in Table 6; it is observed that overall, each scenario experiences an increase in the f1-score evaluation value from testing data to training data, except for the fourth scenario. Therefore, the fourth scenario is experiencing overfitting. The scenario that achieved the highest f1-score value in Logistic Regression is the one with SMOTE implementation (Scenario 3), which is 72.70%. Meanwhile, the scenario with the lowest f1-score is the one with Stopword Removal implementation (Scenario 2), which is 69.23% for the f1-score. Based on the comparison of each scenario to the default scenario, it is found that the scenario that experienced the highest increase in f1-score value is the one with SMOTE implementation (Scenario 3), which is +0.80%. Meanwhile, the scenario that experienced the highest decrease in the f1-score value is the one with Stopword Removal implementation, which is -2.67% (Scenario 2). Implementing Stopword Removal on the Logistic Regression algorithm decreases the resulting f1-score. The highest decrease in f1-score based on the application of Stopword Removal is with the combination of Stopword Removal and SMOTE (Scenario 4), which is -3.21%, while the lowest decrease in f1-score is with the Stopword Removal combination (Scenario 2), which is -2.67%. The implementation of SMOTE on the Logistic Regression algorithm increases the resulting f1-score. The highest increase in f1-score based on the application of SMOTE is with the SMOTE combination (Scenario 3), which is +0.80%, while the lowest increase in f1-score is with the combination of SMOTE and Stopword Removal (Scenario 4), which is +0.26%. The best scenario obtained for the Logistic Regression algorithm is with the implementation of SMOTE (Scenario 3), which results in a f1-score of 72.70% and a
+0.80% increase in the f1-score. On the other hand, the worst scenario is with the implementation of Stopword Removal (Scenario 2), which yields an f1-score of 69.23% and a -2.67% decrease in the f1-score.
Table 6. Evaluation of Logistic Regression
|
Training and Testing Data Evaluation Result | ||||
|
Testing Metric |
Scenario |
Data |
Δ Gap | |
|
Train |
Test | |||
|
1 |
69.46% |
71.90% |
+2.44 | |
|
2 |
67.47% |
69.13% |
+1.66 | |
|
Accuracy |
3 |
72.65% |
72.67% |
+0.02 |
|
4 |
70.84% |
69.45% |
-1.39 | |
|
1 |
69.75% |
72.27% |
+2.52 | |
|
2 |
67.80% |
69.37% |
+1.57 | |
|
Precision |
3 |
72.85% |
72.86% |
+0.01 |
|
4 |
71.05% |
69.70% |
-1.35 | |
|
1 |
69.23% |
71.69% |
+2.46 | |
|
2 |
67.28% |
69.16% |
+1.84 | |
|
Recall |
3 |
72.65% |
72.67% |
+0.02 |
|
4 |
70.84% |
69.44% |
-1.40 | |
|
1 |
69.39% |
71.90% |
+2.51 | |
|
2 |
67.41% |
69.23% |
+1.82 | |
|
F1-score |
3 |
72.69% |
72.70% |
+0.01 |
|
4 |
70.85% |
69.49% |
-1.36 | |
|
Comparison of Each Scenario to the Default Scenario | ||
|
Testing Metric |
Scenario |
Δ Scenario-Default |
|
Accuracy |
|
- -2.77 % 0.77 % -2.45 % |
Comparison of Each Scenario to the Default Scenario
|
Testing Metric |
Scenario |
Δ Scenario-Default |
|
1. Default |
- | |
|
Precision |
2. Stopword Removal |
-2.90 % |
|
3. Smote |
0.59 % | |
|
4. Stopword Removal + Smote |
-2.57 % | |
|
1. Default |
- | |
|
Recall |
2. Stopword Removal |
-2.53 % |
|
3. Smote |
0.98 % | |
|
4. Stopword Removal + Smote |
-2.25 % | |
|
1. Default |
- | |
|
F1-score |
|
-2.67 % +0.80 % |
|
4. Stopword Removal + Smote |
-2.41 % |
|
The Influence of Applying Each Method in the Scenario | |||
|
Testing Metric |
Scenario |
Stopword Removal |
Smote |
|
1 |
- |
- | |
|
2 |
-2.77 % Scenario(2-1) |
- | |
|
Δ Accuracy |
3 |
- |
+0.77% Scenario(3-1) |
|
4 |
-3.22 % |
+0.32% | |
|
Scenario(4-3) |
Scenario(4-2) | ||
|
1 |
- |
- | |
|
2 |
-2.90 % Scenario(2-1) |
- | |
|
Δ Precision |
3 |
- |
+0.59% Scenario(3-1) |
|
4 |
-3.16 % |
+0.33% | |
|
Scenario(4-3) |
Scenario(4-2) | ||
|
1 |
- |
- | |
|
Δ Recall |
2 |
-2.53 % Scenario(2-1) |
- +0.98% |
|
3 |
- | ||
|
Scenario(3-1) | |||
|
4 |
-3.23 % |
+0.28% | |
|
Scenario(4-3) |
Scenario(4-2) | ||
|
1 |
- |
- | |
|
2 |
-2.67 % Scenario(2-1) |
- | |
|
Δ F1-score |
3 |
- |
+0.80% Scenario(3-1) |
|
4 |
-3.21 % |
+0.26% | |
|
Scenario(4-3) |
Scenario(4-2) |
The evaluation results of Random Forest are shown in Table 7; it is observed that all scenarios experience an increase in the f1-score evaluation value from testing data to training data, indicating that there are no scenarios experiencing overfitting. The scenario that achieved the highest f1-score value in Random Forest is the one with SMOTE implementation (Scenario 3), which is 75.03%. Meanwhile, the scenario with the lowest f1-score is the one with Stopword Removal implementation (Scenario 2), which is 68.73%. Based on comparing each scenario to the default scenario in the Random Forest algorithm, the scenario that experienced the highest increase in f1-score value is the one with SMOTE implementation (Scenario 3), which is +6.11%. Meanwhile, the highest decrease in the f1-score value is the one with Stopword Removal implementation (Scenario 2), which is -0.19%. Implementing Stopword Removal on the Random Forest algorithm decreases the resulting f1-score. The highest decrease in f1-score based on the application of Stopword Removal is with the combination of Stopword Removal and SMOTE (Scenario 4), which is -2.03%, while the lowest decrease in f1-score is with the Stopword Removal combination (Scenario 2), which is -0.19%. The implementation of SMOTE on the Random Forest algorithm increases the resulting f1-score. The highest increase in f1-score based on the application of SMOTE is with the SMOTE combination (Scenario 3), which is +6.11%, while the lowest increase in f1-score is with the combination of SMOTE and Stopword Removal (Scenario 4), which is +4.27%. The best scenario obtained for the Random Forest algorithm is with the implementation of SMOTE (Scenario 3), which results in a f1-score of 75.03% and a +6.11% increase in the f1-score. On the other hand, the worst scenario is with the implementation of Stopword Removal (Scenario 2), which yields a f1-score of 68.73% and a -0.19% decrease in the f1-score.
Table 7. Evaluation of Random Forest
Training and Testing Data Evaluation Result
|
Testing Metric |
Scenario |
Data |
Δ Gap | |
|
Train |
Test | |||
|
1 |
68.24% |
69.41% |
+1.17 | |
|
2 |
66.23% |
68.85% |
+2.62 | |
|
Accuracy |
3 |
74.85% |
74.98% |
+0.13 |
|
4 |
72.61% |
73.00% |
+0.39 | |
|
1 |
69.69% |
70.78% |
+1.09 | |
|
2 |
67.64% |
70.19% |
+2.55 | |
|
Precision |
3 |
75.08% |
75.23% |
+0.15 |
|
4 |
73.29% |
73.62% |
+0.33 | |
|
1 |
67.40% |
68.54% |
+1.14 | |
|
2 |
65.61% |
68.31% |
+2.70 | |
|
Recall |
3 |
74.85% |
74.98% |
+0.13 |
|
4 |
72.61% |
72.99% |
+0.38 | |
|
1 |
67.79% |
68.92% |
+1.13 | |
|
2 |
66.00% |
68.73% |
+2.73 | |
|
F1-score |
3 |
74.89% |
75.03% |
+0.14 |
|
4 |
72.61% |
73.00% |
+0.39 | |
|
Testing Metric |
Comparison of Each Scenario to the Default Scenario Scenario Δ Scenario-Default | |||
|
Accuracy Precision Recall F1-score |
|
Removal Removal + Smote Removal Removal + Smote Removal Removal + Smote Removal Removal + Smote |
- -0.56 % 5.57 % 3.59 % - -0.59 % 4.45 % 2.84 % - -0.23 % 6.44 % 4.45 % - -0.19 % +6.11 % +4.08 % | |
|
The Influence of Applying Each Method in the Scenario | ||||
|
Testing Metric |
Scenario |
Stopword Removal |
Smote | |
|
Δ Accuracy Δ Precision Δ Recall Δ F1-score |
1 2 3 4 1 2 3 4 1 2 3 4 1 2 3 4 |
- -0.56 % Scenario(2-1) - -1.98 % Scenario(4-3) - -0.59 % Scenario(2-1) - -1.61 % Scenario(4-3) - -0.23% Scenario(2-1) - -1.99 % Scenario(4-3) - -0.19 % Scenario(2-1) - -2.03 % Scenario(4-3) |
- - +5.57 % Scenario(3-1) +4.15 % Scenario(4-2) - - +4.45 % Scenario(3-1) +3.43 % Scenario(4-2) - - +6.44 % Scenario(3-1) +4.68 % Scenario(4-2) - - +6.11 % Scenario(3-1) +4.27 % Scenario(4-2) | |
The comparison of evaluation results between algorithms has been shown in Table 8. The highest f1-score value produced by both algorithms is in the Random Forest algorithm with the implementation of SMOTE (Scenario 3), which is 75.03%. Meanwhile, the lowest f1-score value produced is in the Random Forest algorithm with the implementation of Stopword Removal (Scenario 2), which is 68.73%. In models where SMOTE is not applied (Scenarios 1 and 2), the Logistic Regression algorithm produces better f1-scores. The highest f1-score value obtained is
71.90% in the first scenario, which involves the implementation of a Hyperparameter Tuning (Default). On the other hand, in models where SMOTE is applied (Scenarios 3 and 4), the Random Forest algorithm yields better f1-scores. The highest f1-score value achieved is 75.03% in the third scenario, which involves the implementation of SMOTE. Comparing each scenario to the default scenario for both algorithms shows that the highest increase in f1-score value is achieved in the Random Forest algorithm (scenario 3) with the implementation of SMOTE, which is +6.11%. The highest decrease in the f1-score value is observed in the Logistic Regression algorithm (scenario 2) with the implementation of Stopword Removal, which is -2.67%. Implementing Stopword Removal to both algorithms results in a decrease in the f1-score. The model that experiences the highest decline in f1-score based on the implementation of Stopword Removal in this research is the Logistic Regression algorithm with the combination of Stopword Removal and SMOTE (Scenario 4), which is -3.21%. Meanwhile, the lowest decrease is observed in the Random Forest algorithm with the implementation of Stopword Removal (Scenario 2), which is -0.19%. Additionally, applying Stopword Removal to both algorithms is better done as it leads to the lowest decrease in f1-score. The implementation of SMOTE in both algorithms can increase the f1-score. The model that experiences the highest increase in f1-score based on the implementation of SMOTE in this research is the Random Forest algorithm with the implementation of SMOTE (Scenario 3), which is +6.11%. Meanwhile, the lowest increase is observed in the Logistic Regression algorithm with the combination of Stopword Removal and SMOTE (Scenario 4), which is +0.26%. The best sentiment analysis classification model for Indonesian tweets obtained in this research uses the Random Forest algorithm with the implementation of SMOTE (Scenario 3), which achieves a f1-score of 75.03% and a +6.11% increase in the f1-score. On the other hand, the worst is obtained using the Random Forest algorithm with the implementation of Stopword Removal (Scenario 2), which results in a f1-score of 68.73% and a -0.19% increase in the f1-score. The combined implementation of Stopword Removal and SMOTE (Scenario 4) in both algorithms does not result in the best f1-score and the highest increase in f1-score. This is due to the application of Stopword Removal, which removes frequently occurring but deemed insignificant words that significantly impact the meaning of a sentence based on the utilized stoplist, such as conjunctions and pronouns. In this research, the stoplist for Stopword Removal is generated using the NLTK library, which is more suitable for document classification rather than sentiment analysis. Consequently, applying Stopword Removal using NLTK's stoplist in sentiment classification can diminish the information in a sentence, causing it to lose its true meaning (sentiment), leading to suboptimal performance in classification, i.e., a decrease in the f1-score.
Table 8. Evaluation of Logistic Regression vs Random Forest
Comparison of Logistic Regression and Random Forest Evaluation
|
Testing Metric |
Scenario |
Algoritmn |
Δ F1-Score (LR-RF) | |
|
Logistic Regression |
Random Forest | |||
|
1 |
71.90% |
69.41% |
2.49 % | |
|
Accuracy |
2 |
69.13% |
68.85% |
0.28 % |
|
3 |
72.67% |
74.98% |
-2.31 % | |
|
4 |
69.45% |
73.00% |
-3.55 % | |
|
1 |
72.27% |
70.78% |
1.49 % | |
|
Precision |
2 |
69.37% |
70.19% |
-0.82 % |
|
3 |
72.86% |
75.23% |
-2.37 % | |
|
4 |
69.70% |
73.62% |
-3.92 % | |
|
1 |
71.69% |
68.54% |
3.15 % | |
|
Recall |
2 |
69.16% |
68.31% |
0.85 % |
|
3 |
72.67% |
74.98% |
-2.31 % | |
|
4 |
69.44% |
72.99% |
-3.55 % | |
|
1 |
71.90% |
68.92% |
2.98 % | |
|
F1-score |
2 |
69.23% |
68.73% |
0.50 % |
|
3 |
72.70% |
75.03% |
-2.33 % | |
|
4 |
69.49% |
73.00% |
-3.51 % | |
|
Testing Metric |
Comparison of Scenario to Default Scenario in Both Algorithms Algoritmn Δ F1-Score Scenario Logistic Random Forest (LR-RF) Regression |
|
Accuracy |
1 - - - 2 -2.77 % -0.56 % -2.21 % 3 0.77 % 5.57 % -4.80 % 4 -2.45 % 3.59 % -6.04 % |
|
Precision |
2 -2.90 % -0.59 % -2.31 % 3 0.59 % 4.45 % -3.86 % 4 -2.57 % 2.84 % -5.41 % |
|
Recall |
-- 2 -2.53 % -0.23 % -2.30 % 3 0.98 % 6.44 % -5.46 % 4 -2.25 % 4.45 % -6.70 % |
|
F1-score |
2 -2.67 % -0.19 % -2.48 % 3 +0.80 % +6.11 % -5.31% 4 -2.41 % +4.08 % -6.49% |
|
Testing Metric |
Comparison of Stopword Removal in Both Algorithms Algoritmn Δ F1-Score Scenario Logistic Random Forest (LR-RF) Regression |
|
Δ Accuracy |
1 - - - 2 -2.77 % -0.56 % -2.21 % 3 - - - 4 -3.22 % -1.98 % -1.24 % |
|
Δ Precision |
2 -2.90 % -0.59 % -2.31 % 3 - - - 4 -3.16 % -1.61 % -1.55 % |
|
Δ Recall |
2 -3.23 % -0.23% -3.00 % 3 - - - 4 -2.67 % -1.99 % -0.68 % |
|
Δ F1-score |
2 -2.67 % -0.19% -2.48 % 3 - - - 4 -3.21 % -2.03 % -1.18 % |
|
Testing Metric |
Comparison of SMOTE in Both Algorithms Algoritmn Δ F1-Score Scenario Logistic Random Forest (LR-RF) Regression |
|
Δ Accuracy |
1 - - - 2 - - - 3 +0.77% +5.57 % -4.80 % 4 +0.32% +4.15 % -3.83 % |
|
Δ Precision |
2 - - - 3 +0.59% +4.45 % -3.89 % 4 +0.33% +3.43 % -3.10 % |
|
Δ Recall |
2 - - - 3 +0.98% +6.44 % -5.46 % 4 +0.28% +4.68 % -4.40 % |
|
Δ F1-score |
2 - - - 3 +0.80% +6.11% -5.31 % |
4 +0.26% +4.27% -4.01 %
Based on the research, the conclusion is that the best sentiment analysis classification model for Indonesian tweets in this research is achieved using the Random Forest algorithm with SMOTE applied. It resulted in an f1-score of 75.03%, showing an improvement of +6.11% in the f1-score value. Meanwhile, the worst is achieved using the Random Forest algorithm with Stopword Removal applied. It resulted in an f1-score of 68.73%, showing a decrease of -0.19% in the f1-score value. Secondly, the implementation of Stopword Removal on Logistic Regression and Random Forest algorithms can lead to a reduction in the f1-score values. This is because Stopword Removal can potentially reduce information and alter the meaning of the processed tweets, causing them to lose their sentiment. Furthermore, implementing the NLTK stoplist used for Stopword Removal in this research is more optimally effective for document classification than sentiment classification, so implementing a more suitable stoplist for sentiment classification can be an option. The highest decrease in the f1-score is observed in the Logistic Regression algorithm by applying Stopword Removal and SMOTE. In contrast, the lowest reduction in the f1-score is kept in the Random Forest algorithm with Stopword Removal. Using Stopword Removal for both algorithms is preferable, resulting in the lowest decrease in f1-score. Thirdly, implementing SMOTE on Logistic Regression and Random Forest algorithms generally increases the f1-score values. The dataset used in each scenario that applies SMOTE to both algorithms has a balanced class distribution, preventing tendencies or biases in sentiment classification towards the majority class. The Random Forest algorithm obtained the highest increase in the f1-score with the implementation of SMOTE, amounting to +6.11%. Meanwhile, the lowest increase in f1-score is observed in the Logistic Regression algorithm with the combined implementation of SMOTE and Stopword Removal, amounting to +0.26%.
References
-
[1] A. Santosa, I. Purnamasari, and R. Mayasari, “Pengaruh stopword removal dan stemming terhadap performa klasifikasi teks komentar kebijakan new normal menggunakan algoritma,” Jurnal Sains Komputer & Informatika, vol. 6, no. 1, pp. 81–93, 2022, doi: 10.30645/j-sakti.v6i1.427.
-
[2] I. Firmansyah, J. T. Samudra, D. Pardede, and Z. Situmorang, “Komparasi random forest dan logistic regression dalam klasifikasi penderita covid-19 berdasarkan gejalanya,” Journal of Science and Social Research, vol. 5, no. 3, p. 595, 2022, doi: 10.54314/jssr.v5i3.994.
-
[3] A. B. P. Negara, H. Muhardi, and F. Sajid, “Perbandingan Algoritma Klasifikasi terhadap Emosi Tweet Berbahasa Indonesia,” Jurnal Edukasi dan Penelitian Informatika, vol. 7, no. 2, p. 242, 2021, doi: 10.26418/jp.v7i2.48198.
-
[4] M. Noveanto, H. Sastypratiwi, H. Muhardi, and J. H. Hadari Nawawi Pontianak, “Uji akurasi klasifikasi emosi pada lirik lagu bahasa indonesia,” Jurnal Sistem dan Teknologi Informasi, vol. 10, no. 3, pp. 311–318, 2022, doi: 10.26418/justin.v10i3.56804.
-
[5] C. Cahyaningtyas, Y. Nataliani, and I. R. Widiasari, “Analisis sentimen pada rating aplikasi shopee menggunakan metode decision tree berbasis smote,” AITI: Jurnal Teknologi Informasi, vol. 18, no. 2, pp. 173–184, 2021, doi: 10.24246/aiti.v18i2.173-184.
-
[6] A. Andreyestha and Q. N. Azizah, “Analisa sentimen kicauan twitter tokopedia dengan optimalisasi data tidak seimbang menggunakan algoritma smote,” Infotek: Jurnal Informatika dan Teknologi, vol. 5, no. 1, pp. 108–116, 2022, doi: 10.29408/jit.v5i1.4581.
-
[7] R. Ferdiana, F. Jatmiko, D. D. Purwanti, A. S. T. Ayu, and W. F. Dicka, “Dataset indonesia untuk analisis sentimen,” Jurnal Nasional Teknik Elektro dan Teknologi Informasi, vol. 8, no. 4, p. 334, 2019, doi: 10.22146/jnteti.v8i4.533.
-
[8] Y. Sari, “Pengenalan Natural Language Toolkit (NLTK),” Yogyakarta, 2019.
-
[9] I. F. Rozi, R. Ardiansyah, and N. Rebeka, “Penerapan Normalisasi Kata Tidak Baku Menggunakan Levenshtein Distance pada Analisa Sentimen Layanan PT . KAI di Twitter,” Seminar Informatika Aplikatif, pp. 106–112, 2019.
-
[10] M. S. Anwar, I. M. I. Subroto, and S. Mulyono, “Sistem pencarian e-journal menggunakan metode stopword removal dan stemming,” Prosiding KONFERENSI ILMIAH MAHASISWA UNISSULA (KIMU) 2, pp. 58–70, 2019, [Online]. Available:
https://jurnal.unissula.ac.id/index.php/kimueng/article/view/8420
-
[11] M. Darwis, G. T. Pranoto, Y. E. Wicaksana, and Y. Yaddarabullah, “Implementation of TF-IDF Algorithm and K-mean Clustering Method to Predict Words or Topics on Twitter,” Jurnal Informatika dan Sains, vol. 3, no. 2, pp. 49–55, 2020, doi: 10.31326/jisa.v3i2.831.
-
[12] S. Khairunnisa, A. Adiwijaya, and S. Al Faraby, “Pengaruh text preprocessing terhadap analisis sentimen komentar masyarakat pada media sosial twitter,” Jurnal Media Informatika Budidarma, vol. 5, no. 2, pp. 406–414, 2021, doi: 10.30865/mib.v5i2.2835.
-
[13] E. M. O. N. Haryanto, A. K. A. Estetikha, and R. A. Setiawan, “Implementasi smote untuk mengatasi imbalanced data pada sentimen analisis sentimen hotel di nusa tenggara barat dengan menggunakan algoritma svm,” Jurnal Informasi Interaktif, vol. 7, no. 1, p. 16, 2022.
-
[14] M. Azhar and H. F. Pardede, “Klasifikasi Dialek Pengujar Bahasa Inggris Menggunakan Random Forest,” Jurnal Media Informatika Budidarma, vol. 5, no. 2, pp. 439–446, 2021, doi: 10.30865/mib.v5i2.2754.
-
[15] Ramli, D. Yuniarti, and R. Goejantoro, “Perbandingan metode klasifikasi regresi logistik dengan jaringan saraf tiruan,” Jurnal Eksponensial, vol. 4, no. 1, pp. 17–24, 2013.
-
[16] A. Ferdita Nugraha, R. F. A. Aziza, and Y. Pristyanto, “Penerapan metode stacking dan random forest untuk meningkatkan kinerja klasifikasi pada proses deteksi web phishing,” Jurnal Infomedia: Teknik Informatika, Multimedia & Jaringan, vol. 7, no. 1, pp. 39–44, 2022, doi: 10.30811/jim.v7i1.2959.
-
[17] H. Nalatissifa, W. Gata, S. Diantika, and K. Nisa, “Perbandingan kinerja algoritma klasifikasi naive bayes, support vector machine (svm), dan random forest untuk prediksi ketidakhadiran di tempat kerja,” Jurnal Informatika Universitas Pamulang, vol. 5, no. 4, pp. 578–584, 2021, doi: 10.32493/informatika.v5i4.7575.
-
[18] S. Khomsah and Agus Sasmito Aribowo, “Model text-preprocessing komentar youtube dalam bahasa indonesia,” Rekayasa Sistem dan Teknologi Informasi, vol. 4, no. 10, pp. 648– 654, 2020, doi: 10.29207/resti.v4i4.2035.
185
Discussion and feedback