Utilization of the 915 MHz LoRa Communication Module as a Navigational Tool in Rural Areas
on
Majalah Ilmiah Teknologi Elektro, Vol.22, No.1, Jan-Juni 2023
DOI: https://doi.org/10.24843/ MITE.2023.v22i01.P15
117
Utilization of the 915 MHz LoRa Communication Module as a Navigational Tool in Rural Areas
Ridwan Satrio Hadikusuma1, Nur Wahid Azhar2
[Submission: 23-01-2023, Accepted: 25-02-2023]
Abstract—The high interest of mountain climbers in Indonesia also increases the risk of accidents that can occur in climbing. To reduce this risk, we need a tool system that can assist local officers in monitoring the location and condition of climbers. However, due to the many signal limitations and internet connections in mountainous terrain or rural areas, there is a need for other alternative media that can be used to monitor climbers' location and conditions. The LoRa (Long Range) communication module can solve the mountain's limited signal and internet connection. Navigation uses the LoRa SX1276 module based on Radio Frequency (RF) as the transmission medium in the 915 MHz frequency range. The data transmission uses the repeater principle as a bridging medium between devices which can then be displayed via the Android application via Cloud Firestore or Bluetooth media. From the results of the tests that have been carried out, it can be concluded that the system works well in transmitting data via Radio Frequency (RF) with an average RSS reduction of -5.1 dBm every 45 m at a radius of 450 m, Cloud Firestore with an average delay of 0.3855 seconds and Bluetooth with reduced RSSI of -5.5 dBm every 5 m with a maximum radius of 50m
Keyword— Radio Frequency (RF), Wireless, Aplication Android, Cloud Firestore, LoRa.
Intisari— Tingginya minat pendaki gunung yang ada di Indonesia, juga meningkatkan resiko kecelakaan yang dapat terjadi dalam pendakian. Untuk mengurangi resiko tersebut maka perlunya suatu sistem alat yang dapat membantu petugas setempat dalam pemantauan lokasi dan kondisi pendaki. Namun karena banyaknya keterbatasan sinyal dan koneksi internet yang ada pada medan pegunungan atau area rural, maka perlunya media alternatif lain yang dapat digunakan sebagai media pemantauan lokasi dan kondisi pendaki. modul komunikasi LoRa (Long Range) dapat menjadi solusi pada keterbatasan sinyal dan koneksi internet yang ada di gunung. navigasi menggunakan modul LoRa SX1276 berbasis Radio Frequency (RF) sebagai media transmisi pada rentang frekuensi 915 MHz. Pentransmisian data tersebut menggunakan prinsip repeater sebagai media penjembatan antara perangkat yang kemudian dapat ditampilkan melalui Aplikasi Android melalui Cloud Firestore atau melalui media Bluetooth. Dari hasil pengujian yang telah dilakukan, dapat disimpulkan sistem bekerja dengan baik dalam mentransmisikan data melalui Radio Frequency (RF)
dengan pengurangan RSS rata – rata sebesar -5,1 dBm setiap 45 m pada radius 450 m, Cloud Firestore dengan jeda rata – rata selama 0,3855 detik dan Bluetooth dengan pengurangan RSSI sebesar -5,5 dBm setiap 5 m dengan radius maksimal 50m
Kata Kunci— Radio Frequency (RF), Wireless, Aplikasi Android, Cloud Firestore, LoRa.
A mountain is a land that has a land surface that rises higher than the surrounding area. Mountains generally have sharp and rocky slopes. A mountain is usually taller and steeper than a hill and has a minimum elevation of 2000 feet or 610 m [1]. The beautiful views of the mountains and the urge to go on adventures in the great outdoors have led to a high level of interest in mountaineering in Indonesia from year to year. The number of visitors in 2012 was around 38,250 people, then in 2013, there were 82,577 visitors, and in 2014 it increased to 96,587 people [2]. Then climbing Mount Tambora in 2015 was recorded at 5,000 to 6,000 people, and in the same year, the number of visiting tourists who climbed Mount Rinjani reached 24,000.
Meanwhile, the Bromo Tengger Semeru National Park recorded 550,000 domestic and foreign people visiting Mount Bromo and Mount Semeru in 2014 [3]. The increasing number of mountain climbers can affect the level of risk of accidents that occur. According to Priyasidharta [4], at least 28 victims died while climbing Mount Semeru from 1969 to 2017, which were recorded at the Ranupane climbing post. Then 83 cases of death occurred in all mountains in Indonesia from July 2013 to May 2017, even in the period of 1 year from May 2016 to May 2017, 22 people died [2]. To minimize the number of accidents, we need a system that can monitor the condition of climbers in order to provide faster handling if an accident occurs. However, due to the limited internet network in mountainous terrain, it is not easy to access communication for monitoring climbers [4].
A navigation tool is a tool that functions to find out the coordinates and body temperature of climbers, which can be monitored through the Android application. The Navigation System is divided into two main parts: the Hardware and Software[14][15]. In the Hardware section[16], Communication in the Navigation System is divided into three parts: Sender, Repeater, and Receiver. The communication module uses the LoRa SX1276 module in the 915 MHz frequency range based on Radio Frequency (RF) as the transmission medium [17-20]. The data transmission uses the repeater principle as a media bridge between devices. The Sender Navigation System will send data in the form of temperature and location of climbers to the Receiver via the p-ISSN:1693 – 2951; e-ISSN: 2503-2372

Repeater as a bridge using Radio Frequency (RF) media [6-8]. The data that the Receiver has received is then sent via Cloud Firestore or Bluetooth media to be displayed on the Android Application. From this statement, a navigation tool using the LoRa communication module can be a solution for monitoring mountain climbers to minimize the high number of accidents that occur on the mountain [9-11].
Several previous studies that have been carried out by previous researchers have resulted in solutions. The results of these studies can be described and used as a comparison with what the authors will do with this research. as in research conducted by Michael Paul Smart Simbolon, Heru Wijanarko, and others [5] which discusses the application of wireless communication using Lora. Michael Paul found that communication using LoRa which works at a frequency of 915 MHz, set SF=7 and BW=125 KHz, obtained the farthest range of up to 456.01 meters. this is in line with research also conducted by Asma Yanziah, Sopian Soim, Martinus Mujur Rose related to testing and analyzing LoRa coverage which states that based on the average RSSI of testing and calculations, RSSI has decreased while packet loss has increased with each additional distance. From this study, the maximum LoRa range is 2 km [27].
The research was conducted by Ayub Repa Batong, Prihadi Murdiyat, Abdul Hamid Kurniawan on analyzing the feasibility of a wireless-based LoRa communication system. From the measurement results at 433 MHz and 915 MHz, the RSSI value is greater than -120 dB, the SNR is greater than -20 dB, and the PL value is less than 3%. This shows that LoRa is feasible to be used as a monitoring system communication network. In addition, it was also found that LoRa with a working frequency of 433 MHz has better performance than LoRa with a frequency of 915 MHz [28].
The method used in this study uses quantitative methods. This research method uses data in the form of numbers as a tool to analyze the results. This study collects measurements of the device and explores several aspects related to the existing problems so that the results follow the related data. Figure 1 shows the stages carried out in the research method.
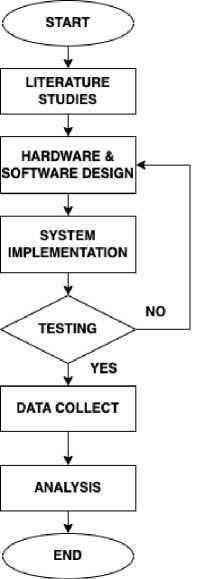
Figure 1: Research Method Flowchart
A. Design System
The design of this system begins with making a system block diagram that shows the design concept of the system to be made.
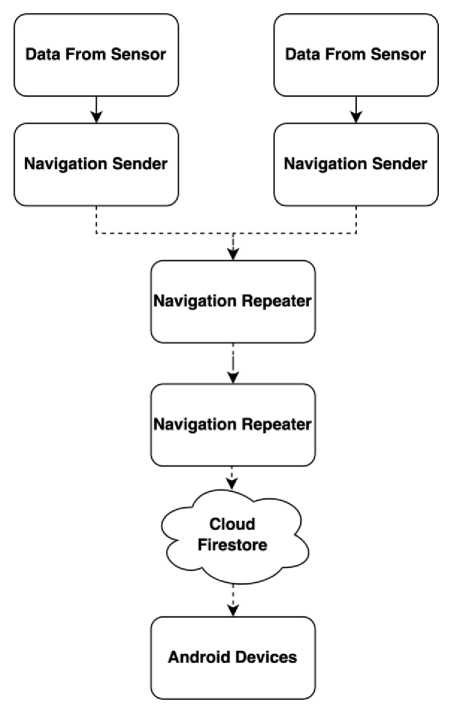
Figure 2: Block Diagram of Data Transmission System Design
From Figure 2 it is known that the data received by the sensor is then received by the Navigation Sender, then the data is displayed using OLED and transmitted via Radio Frequency using a LoRa module in the 915 MHz frequency range. then the transmitted data is captured by the Repeater Navigation then displayed using OLED and retransmitted via Radio Frequency using the LoRa module. The transmitted data is then received by the Navigation Receiver and displayed using an OLED. Then the data is transmitted via Bluetooth media using the Bluetooth module and via the Internet media using Cloud Firestore. On Android devices data can be received via the Internet media or via Bluetooth media. Data can be accessed through an Android application that has been created for the Android Operation System (OS).
-
B. ID Design in Transmission Data
Designing the ID for the transmitted data is necessary to overcome data overlapping due to data transmission at the same frequency. The frequency used in this research transmission system is 915 HZ. The ID code used as a filter for the data received is in the form of text that says "Tracker.ID". The ID design is illustrated through the Flowchart in Figure 3.
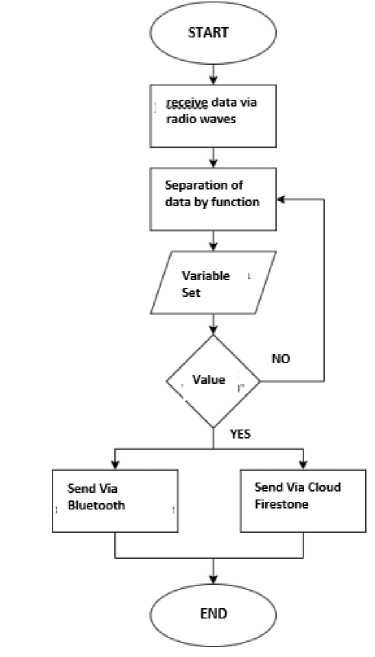
Figure 3: Transmission Data ID Filtering Flowchart
Filtering ID in the data received is carried out using the substing method in the data that has been initiated in a variable. After filtering data on the variables that have been initiated with the data received, then make a comparison of comparisons, if the data received does not have an ID in the form of text that
reads "Tracker.id", then the data will not be continued towards Cloud Firestore and Bluetooth [12-13].
-
C. Electronics Design
Sender is a part of the navigation system that functions to receive coordinate data from satellites and body temperature from explorers. The data will be transmitted via radio waves. The following is a schematic of the Sender.
Ridwan Satrio Hadikusuma: Utilization of the 915…
p-ISSN:1693 – 2951; e-ISSN: 2503-2372
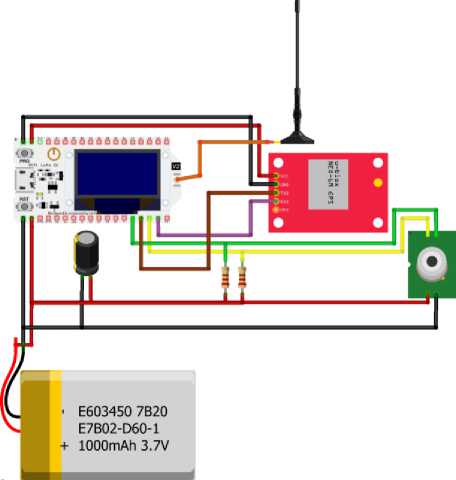
Figure 4: Sender with LoRa 915 MHz
Meanwhile, the repeater is a part of the navigation system that functions to bridge the Sender and Receiver, in order to increase the distance of data transmission between Sender and Receiver[21]. The following is a schematic of the Repeater on the navigation system.

Figure 5: Repeater in navigation system
Finally, there is the Receiver which is part of the navigation system which functions to receive data transmitted by the Sender and Repeater via radio waves. The following is a schematic of the receiver.
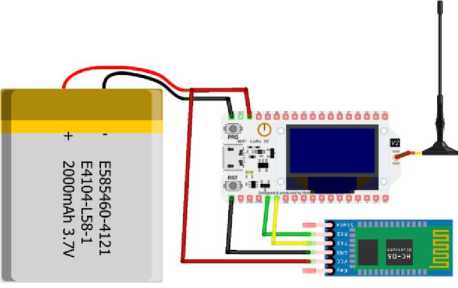
Figure 6: Receiver with LoRa 915 MHz
-
D. Analysis Method
The method used in this study is by observing or conducting field studies to measure and collect the data needed in this study. There are several stages, namely as follows:
-
1. Data collection
Data collection is carried out by activating the hardware system on the navigation system, namely Sender, Repeater and Receiver, then observing the data transmission that occurs [2225]. System software is used to observe the results of data transmitted from the hardware system using the Android application.
The data needed in this study are as follows:
-
a. Signal strength data (RSSI) received by the Repeater from the Sender
-
b. Signal strength data (RSSI) received by the Receiver from the Sender
-
c. Signal strength data (RSSI) received by the Receiver from the Repeater
-
d. Signal strength data (RSSI) and Bluetooth transmission distance from Sender to Android device
-
e. Data on the duration of data transmission from Receiver to Cloud Firestore
-
2. Data recapitulation
At this stage, data collection was carried out from the results of data collection and then sorting the required data based on the group in this study.
-
3. Data processing
At this stage the data that has been obtained will be adjusted to the formula or method to be analyzed. If the data obtained is incomplete, it is necessary to test and retrieve data again so that the data to be processed meets the needs before being analyzed.
-
E. Measurement Method
In this study the data obtained previously from testing and data collection will be analyzed using quantitative methods. This method of analysis is carried out by reading numbers, tables and graphs and then describing them again [26]. The analysis was carried out using a calculation formula related to research.
The things analyzed are:
-
a. RSSI value on LoRa transmission
-
b. RSSI value on Bluetooth transmission
-
c. Delay value on delivery to Cloud Firestore
-
A. Testing the Sender's Signal Strength to the Repeater in the 915 MHz Frequency Range
This test is carried out by giving the distance between the Sender and the Repeater and recording the RSSI value displayed on the OLED Repeater in units of dBm as shown in Figure 7 (left). The data is an indicator of signal strength based on the transmission distance parameter between the Sender and the Repeater which is displayed through the Application which is also shown in Figure 7 (right).
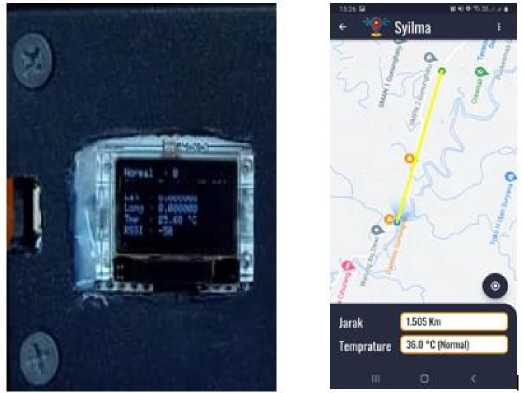
Figure 7: OLED display repeater(left) and Data Tracker Viewer(right)
This test is carried out to determine the signal strength and the maximum distance that can be transmitted between the Sender to the Repeater. This test is needed to determine the difference in the RSSI signal value at each transmission distance between the Sender and the Repeater. The test data is shown in Table 1.
TABLE I
Table of Sender Signal Strength Testing to Receiver at 915MHz Frequency
|
No |
RSSI |
Latitude |
Longtitude |
Distance |
|
1. |
- 70 dBm |
- 7.02317 |
107.29035 |
43 m |
|
2. |
- 74 dBm |
- 7.02385 |
107.28968 |
91 m |
|
3. |
- 77 dBm |
- 7.02412 |
107.28939 |
132 m |
|
4. |
- 81 dBm |
- 7.02454 |
107.28922 |
182 m |
|
5. |
- 85 dBm |
- 7.02485 |
107.28897 |
225 m |
|
6. |
- 88 dBm |
- 7.02517 |
107.28875 |
269 m |
|
7. |
- 91 dBm |
- 7.02551 |
107.28861 |
310 m |
|
8 |
- 97 dBm |
- 7.02595 |
107.28831 |
368 m |
|
9. |
- 100 dBm |
- 7.02616 |
107.28811 |
400 m |
|
10. |
- 112 dBm |
- 7.02662 |
107.28792 |
451 m |
From the test data we can find the average value of the difference in RSSI on changes in distance. By knowing the average value of the difference in RSSI, we can estimate the reduction in signal quality in the transmission between the Sender and the Repeater by 4.9 dBm every 45.3 m. From this
test we can also find out that the maximum distance of data transmission between the Sender and the Repeater is 451 m.
-
B. Testing the Sender's Signal Strength to the Receiver at a Frequency of 915 MHz
This test is carried out by giving the distance between the Sender and the Receiver and recording the signal strength value (RSSI) displayed on the OLED Receiver in units of dBm as shown in Figure 8 (left). The data is an indicator of signal strength based on the transmission distance parameter between the Sender and Receiver which is displayed via the navigation system application shown in Figure 8 (right).
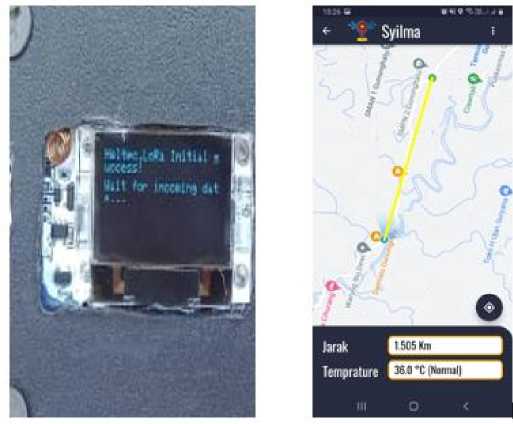
Figure 8: OLED display receiver(left) and Data Tracker Viewer(right)
This test is carried out to determine the signal strength and the maximum distance that can be transmitted between the Sender and the Receiver. This test is needed to determine the difference in the value of the RSSI signal at each transmission distance between the Sender and the Receiver. The test data is shown in Table 2.
TABLE II
Table of Sender Signal Strength Testing to SENDER at 915MHz Frequency
|
No |
RSSI |
Latitude |
Longtitude |
Distance |
|
1. |
- 71 dBm |
- 7.01958 |
107.29216 |
45 m |
|
2. |
- 77 dBm |
- 7.01992 |
107.29220 |
80 m |
|
3. |
- 80 dBm |
- 7.02018 |
107.29227 |
113 m |
|
4. |
- 88 dBm |
- 7.02057 |
107.29222 |
157 m |
|
5. |
- 90 dBm |
- 7.02088 |
107.29179 |
198 m |
|
6. |
- 95 dBm |
- 7.02119 |
107.29151 |
241 m |
|
7. |
- 100 dBm |
- 7.02146 |
107.29123 |
280 m |
|
8 |
- 105 dBm |
- 7.02174 |
107.29095 |
322 m |
|
9. |
- 107 dBm |
- 7.022001 |
107.29054 |
365 m |
Ridwan Satrio Hadikusuma: Utilization of the 915…
|
10. |
- 111 dBm |
- 7.02216 |
107.29022 |
399 m |
From the test data we can find the average value of the difference in RSSI on changes in distance. By knowing the average value of the RSSI difference, we can estimate a reduction in signal quality in transmission between Sender and Receiver of -4.4 dBm every 39.3 m. From this test we can also find out that the maximum distance for data transmission between the Sender and the Receiver is 399 m.
-
C. Repeater Signal Strength Test Toward Receiver At 915
MHz Frequency
This test is carried out by giving the Repeater a distance from the Receiver and recording the RSSI value displayed on the OLED Receiver in dBm units as shown in Figure 9 (left). The data is an indicator of signal strength based on the transmission distance parameter between the Repeater and the Receiver which is displayed through the navigation system application shown in Figure 9 (right).
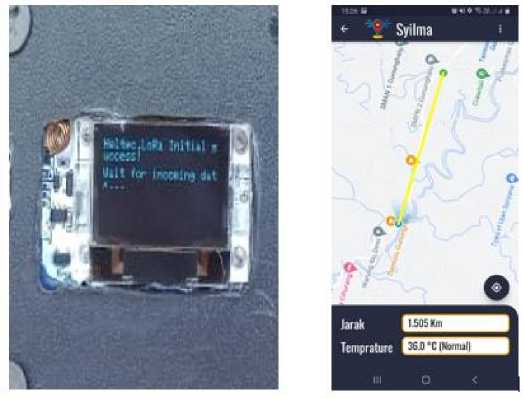
Figure 9: OLED display receiver(left) and Data Tracker Viewer(right)
This test is carried out to determine the signal strength and the maximum distance that can be transmitted between the Repeater and the Receiver. This test is needed to determine the difference in the RSSI signal value at each transmission distance between the Repeater and the Receiver. The test data is shown in Table 3.
TABLE III
Table of Repeater Signal Strength Testing to Receiver at 915 MHz Frequency
|
No |
RSSI |
Latitude |
Longtitude |
Distance |
|
1. |
- 64 dBm |
- 7.01962 |
107.29215 |
48 m |
|
2. |
- 68 dBm |
- 7.02008 |
107.29233 |
98 m |
|
3. |
- 70 dBm |
- 7.02054 |
107.29219 |
150 m |
|
4. |
- 76 dBm |
- 7.02092 |
107.29172 |
201 m |
|
5. |
- 81 dBm |
- 7.02131 |
107.29139 |
253 m |
p-ISSN:1693 – 2951; e-ISSN: 2503-2372

9 772503 237160
|
6. |
- 87 dBm |
- 7.02161 |
107.29106 |
299 m |
|
7. |
- 90 dBm |
- 7.02192 |
107.29072 |
347 m |
|
8 |
- 94 dBm |
- 7.02215 |
107.29024 |
397 m |
|
9. |
- 100 dBm |
- 7.02250 |
107.28992 |
449 m |
|
10. |
- 110 dBm |
- 7.02309 |
107.28996 |
502 m |
From the test data we can find the average value of the difference in RSSI on changes in distance. By knowing the average value of the RSSI difference, we can estimate a reduction in signal quality in transmission between the Repeater and the Receiver of -6.2 dBm every 50.3 m. From this test we can also find out that the maximum distance of data transmission between the Repeater and the Receiver is 502 m.
-
D. Signal Strength Test and Bluetooth Transmission Distance
In this test, the Bluetooth module used is the HC-06. This test is carried out by giving the distance between the receiver and the device or mobile phone that you want to link to the Bluetooth connection, which is measured using a measuring meter. This test aims to determine the maximum distance for devices to connect to Bluetooth from the receiver. Bluetooth signal strength data is obtained through monitoring from the navigation system application based on the distance between the Receiver and the linked mobile device as shown in Figure
10.
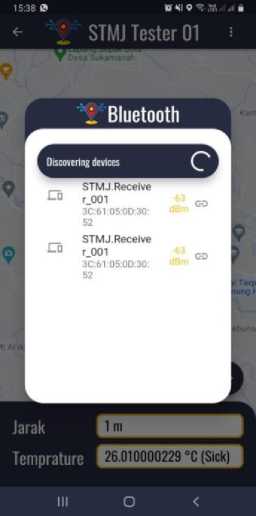
Figure 10: Bluetooth Signal Strong Data Viewer
The test was carried out 10 times in a row to get the average data from the test. The data is then arranged based on the distance between the Receiver and the cellphone device. The test data is shown in Table 4.
From the test data, we can find the average value of the difference in RSSI on changes in distance. By knowing the average value of the RSSI difference, we can estimate the reduction in signal quality in the transmission between the receiver and the Android device by -5.4 dBm every 5 m. From
this test we can also find out that the maximum distance for transmitting data via Bluetooth between the receiver and the Android device is 50 m.
TABLE IV
Table of Testing Signal Strength and Bluetooth Transmission Distance
|
No |
RSSI (dBm) |
Distance (m) |
|
1. |
- 46 dBm |
0 m |
|
2. |
- 78 dBm |
5 m |
|
3. |
- 84 dBm |
10 m |
|
4. |
- 92 dBm |
15 m |
|
5. |
- 93 dBm |
20 m |
|
6. |
- 94 dBm |
25 m |
|
7. |
- 95 dBm |
30 m |
|
8. |
- 96 dBm |
35 m |
|
9. |
- 97 dBm |
40 m |
|
10. |
- 98dBm |
45 m |
|
11. |
- 100 dBm |
50 m |
-
E. Testing the Duration of Data Delivery from Receiver to Cloud Firestore
This test is carried out by calculating the comparison of the sending time on the Receiver when it has received data from the Repeater with the time of receiving data on Cloud Firestore using a wireless connection (Wi-Fi) which previously tested an upload speed of 17 Mbps. The following table compares the duration of sending data from Receiver to Cloud Firestore.
TABLE V
Table of Testing Data Delivery Duration from Receiver to Cloud Firestore
|
No |
Receiver time receiver |
Cloud Firestore time received |
Difference (ms) |
|
1 |
19:04:27.257 |
19:04:27.628 |
371 |
|
2 |
19:04:37.355 |
19:04:37.906 |
551 |
|
3 |
19:04:47.510 |
19:04:47.841 |
331 |
|
4 |
19:04:57.614 |
19:04:57.945 |
331 |
|
5 |
19:05:07.746 |
19:05:08.078 |
332 |
|
6 |
19:05:17.851 |
19:05:18.370 |
519 |
|
7 |
19:05:27.941 |
19:05:28.320 |
379 |
|
8 |
19:05:38.074 |
19:05:38.405 |
331 |
|
9 |
19:05:48.202 |
19:05:48.533 |
331 |
|
10 |
19:05:58.299 |
19:05:58.678 |
379 |
|
Total |
3855 | ||
From the test data on sending data from the Receiver to Cloud Firestore which was carried out 10 times in a row, the total duration required is 3855 ms with an average of 385.5 ms or 0.3885 s.
The performance of the data transmission system on the Navigation System tool is because it can transmit data properly from the Sender to the Receiver and sends the data via Bluetooth and Cloud Firestore. In addition, the transmission system is quite reliable because it can transmit due to a decrease in signal quality in the transmission between Sender and Repeater of -4.9 dBm every 45.3 m with a maximum distance of 451 m using 915 MHz frequency. Then in the transmission between Sender to Receiver there is a decrease in signal quality of -4.4 dBm every 39.3 m. with a maximum distance of 399 m at a frequency of 915 MHz. Then the decrease in signal quality in transmission between the Repeater to the Receiver is -6.2 dBm every 50.3 m with a maximum transmission distance of 502 m. The transmission between the receiver and the Android device is -5.4 dBm every 5 m with a maximum data transmission distance of 50 m. The delay or duration required for the Receiver to send data to Cloud Firestore is 0.3855 seconds.
Referensi
-
[1] M. hardian Putranto, “Pemahaman Pendaki Gunung Tentang Pertolongan Pertama Pada Kegiatan Pendakian Di Basecamp Promasan Gunung Ungaran,” p. Hal 2, 2019.
-
[2] A. Rais, “Pemahaman Pendaki Gunung Terhadap Ilmu Pendakian Di Gunung Ungaran,” Unnes, p. 14, 2019.
-
[3] J. M. Masjhoer, D. Wibowo, B. Q. Sadida, and I. T. Ogista, “Latar Belakang Wisata minat khusus menjadi definisi yang tepat dalam menggambarkan aktifitas wisata pendakian gunung , dimana dalam konsep wisata ini kualitas wisatawan yang menjadi tolak ukur , bukan kuantitas selayaknya wisata massal . Beberapa tahun be,” no. 1, pp. 1– 16.
-
[4] P. Ekasari and A. Hadi Dharmawan, “Dampak Sosial-Ekonomi Masuknya Pengaruh Internet Dalam Kehidupan Remaja Di Pedesaan,” Sodality J. Sosiol. Pedesaan, vol. 6, no. 1, 2012, doi:
10.22500/sodality.v6i1.5809.
-
[5] M. P. S. Simbolon, H. Wijanarko, F. Nakul, and R. Mahdaliza, “Penerapan Komunikasi Nirkabel LoRa pada Sistem Pencatat Kehadiran Portabel,” J. Appl. Electr. Eng., vol. 5, no. 2, pp. 30–35, 2021, doi: 10.30871/jaee.v5i2.3096.
-
[6] R. Hadiansyah and D. W. I. P. Nugraha, “Analisis Kinerja Radio Frekuensi ( RF ) Interface Pada Perangkat Digital Microwave Digital Fixed Radio System ( DFRS ),” vol. 4, no. 1, pp. 35–50, 2016.
-
[7] v. M. buyanov, “Gelombang Radio,” Angewandte Chemie International Edition, 6(11), 951–952., 1967. http://p2k.unkris.ac.id/en3/3065-
2962/Radio_25632_p2k-unkris.html
-
[8] N. J. Larasati, “Frekuensi Radio,” Sekretariat KPID Provinsi Banten, 2016. https://setkpid.bantenprov.go.id/read/berita/212/Frekuensi-
Radio.html
-
[9] A. Y. Prasetya and T. Suryani, “Implementasi Modulasi dan Demodulasi M-ary QAM pada DSK TMS320C6416T,” Implementasi Modul. dan Demodulasi M-ary QAM pada DSK TMS320C6416T, vol. 1, no. 1, pp. 1–6, 2013.
-
[10] R. G. Manilk, “Jenis - jenis modulasi sinyal.” https://fit.labs.telkomuniversity.ac.id/jenis-jenis-modulasi-sinyal/
-
[11] Firebase, “Cloud Firestore,” Firebase Google, Julio, 2021. https://firebase.google.com/docs/firestore?authuser=0
Ridwan Satrio Hadikusuma: Utilization of the 915…
-
[12] W. N. Suliyanti, “Studi Literatur Basis Data SQL dan NoSQL,” Kilat, vol. 8, no. 1, pp. 48–51, 2019, doi: 10.33322/kilat.v8i1.460.
-
[13] P. B. Muhammad, W. Yahya, and A. Basuki, “Analisis Perbandingan Kinerja Protokol Websocket dengan Protokol SSE pada Teknologi Push Notification,” J. Pengemb. Teknol. Inf. dan Ilmu Komput. Univ. Brawijaya, vol. 2, no. 6, pp. 2235–2242, 2018, [Online]. Available: http://repository.ub.ac.id/3431/
-
[14] A. Prafanto, E. Budiman, P. P. Widagdo, G. M. Putra, and R. Wardhana, “Pendeteksi Kehadiran menggunakan ESP32 untuk Sistem Pengunci Pintu Otomatis,” JTT (Jurnal Teknol. Ter., vol. 7, no. 1, p. 37, 2021, doi: 10.31884/jtt.v7i1.318.
-
[15] I. P. A. W. Widyatmika, N. P. A. W. Indrawati, I. W. W. A. Prastya, I. K. Darminta, I. G. N. Sangka, and A. A. N. G. Sapteka, “Perbandingan Kinerja Arduino Uno dan ESP32 Terhadap Pengukuran Arus dan Tegangan,” J. Otomasi Kontrol dan Instrumentasi, vol. 13, no. 1, pp. 35– 47, 2021, doi: 10.5614/joki.2021.13.1.4.
-
[16] W. M. Putri, “Apa Itu Lora ?,” 2018.
https://nesr.labs.telkomuniversity.ac.id/apa-itu-lora/
-
[17] S. F. Mochamad, F. Imansyah, and J. Marpaung, “Analisis Kinerja Modul Transceiver SX1278 pada Sistem Monitoring dengan Jaringan Star,” J. Untan, vol. 2, no. 1, 2021.
-
[18] Sora, “Pengertian Bluetooth, Fungsi Dan Cara Kerjanya,” 2016, [Online]. Available: https://www.pengertianku.net/2015/03/pengertian-bluetooth-fungsi-dan-cara-kerjanya.html
-
[19] G. C. Setyawan and A. Uno, “Bluetooth Remote Controlled Robot berbasis Arduino Uno,” vol. 07, no. 02, pp. 1–7, 1978.
-
[20] M. Yusro and A. Diamah, Sensor dan Transduser Teori dan Aplikasi. 2019.
-
[21] B. A. Sugiarso, A. S. M. Lumenta, B. S. Narasiang, and A. M. Rumagit, “Aplikasi Sensor Polusi Udara,” J. Tek. Elektro dan Komput., vol. 8, no. 3, pp. 193–200, 2019.
-
[22] M. Arif, “Sejarah wifi dan perkembangan wifi,” Sej. wifi dan Perkemb. wifi, p. 5, 2019.
-
[23] M. Rusdan and M. Sabar, “Design and Analysis of Wireless Network with Wireless Distribution System using Multi-Factor Authenticationbased User Authentication,” J. Inf. Technol., vol. 2, no. 1, pp. 17–24, 2020, doi: 10.47292/joint.v2i1.004.
-
[24] S. Tjandra and G. S. Chandra, “Pemanfaatan Flutter dan Electron Framework pada Aplikasi Inventori dan Pengaturan Pengiriman Barang,” J. Inf. Syst. Hosp. Technol., vol. 2, no. 02, pp. 76–81, 2020, doi: 10.37823/insight.v2i02.109.
-
[25] E. Maiyana, “Pemanfaatan Android Dalam Perancangan Aplikasi Kumpulan Doa,” J. Sains dan Inform., vol. 4, no. 1, pp. 54–65, 2018, doi: 10.22216/jsi.v4i1.3409.
-
[26] Minlab, “Apa itu Android? Berikut Pengertian, Kelebihan, serta Kekurangannya!,” Bitlabs, 2020. https://bitlabs.id/blog/android-adalah/
-
[27] A. Yanziah, S. Soim, and M. M. Rose, “Analisis Jarak Jangkauan Lora Dengan Parameter Rssi Dan Packet Loss Pada Area Urban,” J. Teknol. Technoscientia, vol. 13, no. 1, pp. 27–34, 2020.
-
[28] A. R. Batong, P. Murdiyat, and A. H. Kurniawan, “Analisis Kelayakan LoRa Untuk Jaringan Komunikasi Sistem Monitoring Listrik Di Politeknik Negeri Samarinda,” PoliGrid, vol. 1, no. 2, p. 55, 2020, doi: 10.46964/poligrid.v1i2.602.
p-ISSN:1693 – 2951; e-ISSN: 2503-2372

.
[ HALAMAN INI SENGAJA DIKOSONGKAN ]
ISSN 1693 – 2951
Ridwan Satrio Hadikusuma: Utilization of the 915…
Discussion and feedback