Influence of Tourism on Spatial Change in Tulamben-Amed, Karangasem, Bali
on
Journal of A Sustainable Global South, p-ISSN: 2579-6062
Influence of Tourism on Spatial Change in Tulamben-Amed, Karangasem, Bali
Wehelmina Linda Herlophina Dethan1, Syamsul A. Paturusi2, and Antonius K. Muktiwibowo3
Architectural Master’s Program Faculty of Engineering, Udayana University Denpasar, Indonesia erlophina@gmail.com
Architectural Master’s Program Faculty of Engineering, Udayana University Denpasar, Indonesia
Architectural Master’s Program Faculty of Engineering, Udayana University Denpasar, Indonesia
Abstract
Tourism development in the Tulamben-Amed National Tourism Strategic Area caused some changes in spatial use. Such changes are change of farming (salt and rice fileds) function into tourist accommodation and increasing development of tourism facilities in the coastal boundary area which contradicted to regional spatial plan. This study aims to investigate How and What causes the changes. The method used in this study is a quantitative correlation based on Geographic Information Systems (GIS), combined with statistics of Pearson Test and Pearson Scatter Diagram. The results showed that the change in spatial use increase 4% Per year while the intensity was 33 buildings Per hectare. It is also indicates that the region’s development is on involvement cycle. Factors that causing changes are characteristics of tourist attraction, spatial agglomeration of tourism facilities, higher prices on land used for tourism facilities than those that are not used for it, accessibility comfort levels for tourist, limitation of land physical feasibility, and different natural disaster characteristics between segments. Recommendation of this study are calculating the comparison of the preservation and the economic value of coastal borders, controlling the change of agricultural land functions, structuring integrated spatial plans between tourist attraction and developed alternative locations to reduce spatial agglomeration on the coastal borders area.
Index Terms—tourism, spatial correlation, spatial change, Tulamben-Amed.
The development of tourism has caused several changes in spatial use in Tulamben-Amed tourism area. Such changes are change of farming (salt and rice fields) function into tourist accommodation around Amed and Jemeluk, and increasing development of tourism facilities in the coastal boundary area which contradicted to Karangasem Region Spatial Plan because at the plan this area is designated as a protected area. According to Suartika and Widiarsa [1] this
happened due to limitations of land. In addition, the establishment of this area as a National Tourism Strategic Area (KSPN) as in National Tourist Plan of Indonesia (RIPPARNAS) has accelerated the increase of spatial change in this area.
The internal change of the area and the impetus for the economic growth of the area implicates increasing rate of change from non-tourism spatial use to tourism spatial use. This requires certain barrier as not all activities in this area must be transformed into tourism, such as traditional salt farming activities as one of the local cultural heritage and preservation of the coastal border area to protect the
functions of the beach, beach purity, building safety, and the availability of public spaces.
The development of this area according to Butler [2] will enter development stage. The consequence of development stage is the creation of a systematic tourism market so that it will set aside local facilities and there can also be a decline in environmental quality due to change of land function for tourism facilities.
During this period, research that influences dependent and independent variables tied to the use several analytical techniques, among others: Cross tabulation analysis (crosstab) and statistical test T. Both of these analytical techniques use more numbers in tabular data less to display the results in spatially. Therefore, it has evolved a spatial correlation analysis technique based on GIS (geographic information system) that can integrate tabular and spatial data as good as visualize the change in spatial use. With the various considerations that has described, this study was implemented using the spatial correlation analysis method combined with statistical correlation analysis of the Pearson test and the Pearson Scatter Diagram.
-
A. Tourism Developments
The development of tourism occurs due to changes in tourist attraction and the elements of amenities within a certain period of time. Tourist attraction is everything that unique, beautiful and valuable in the form of natural wealth, culture and man-made results. That is the destination of tourists. Natural attractions (physiography and climate) and culture are tourist attractions that has a higher competitive value of other types of tourist attractions [3]. The amenities (tourism facilities) are all the facilities provided to support the ease, comfort and safety of tourists in making visits to the tourism destination. Tourism facilities include: accommodation facilities, restaurant facilities, information facilities and tourism services, tourism Information Center, tourism police, souvenir shops and directions/information boards/tourist traffic signs. Meanwhile, the development of the tourism area according to Butler [2] will pass through a life cycle which is divided into several stages, namely exploration, involvement, development, consolidation, stagnation, and rejuvenation.
-
B. Change of Spatial Use
The development of tourism sector always causes changes in the spatial use. Changes in spatial use are interpreted as increasing or decreasing the division of space allocation for tourism activities that can be seen from the mass or volume changes and changes in the intensity of the space use. Mass changes is the change in the mass or volume of spatial use [4]. While changing the intensity of spatial use could be observed from the building density changes at a residential unit [5]. Further Sudiarso [6] said that the dense of building population is 80-100 building
units per hectare.
According to Kaiser et. al [7] the change in spatial use can be understood from two perspectives, land is a limited commodity so that its use must conform to the capabilities and suitability of its natural physical support; and land is a resource that has an image and aesthetic value. According to Khambali [8] there are also two factors determining the development of space that is physical factors and economic factors. Physical factors include geographical conditions that will affect the function and shape of the region (e.g. coastal towns will tend to be semicircular in port-centered) and topography as a limiting development (e.g. areas on flat areas are more easily developed in all directions than mountainous areas). Economic factors include value and price of land as a consequence of increasing land needs.
Yunus [9] points out several forces that cause the change of spatial use. The forces are centrifugal, centripetal, and lateral forces, where each force has its own pull and push factors. Some components that change the spatial use according to Clawson and Steward [10] are land tenure, land prices and accessibility. Changes in spatial use are also related to location theory from Weber and Von Thunen [1] and the economic agglomeration [2].
The research is located in Tulamben-Amed area, Abang and Kubu District, Karangasem Regency, Bali. In accordance with the research area's character, the region is divided into west segment and east segment as Figure 1.
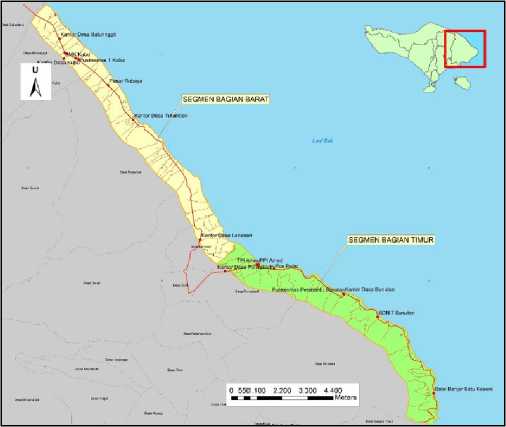
Fig. 1. Tulamben-Amed Region.
This research using quantitative method which including spatial correlation research using ArcGIS ArcMap 10.3 as the software. This analysis was combined with Pearson's Test statistical analysis and the plot spread in the Pearson Scatter Diagram to determine the significant level of relationship between research variables. The initial stage of
research was determining the research variables divided into dependent variables and independent variables. In Figure 2 can be seen the types of dependent variables denoted by X and the independent variables denoted by Y.
X
Y
DEPENDENT VARIABLES
INDEPENDENT VARIABLES
-
• Distance from tourist attractions (X1)
-
• Number of tourist visitor (X2)
-
• Distribution of tourism facilities (X3)
-
• Quality Tourist Facilities (X4)
-
• Land value (X5)
-
• Land tenure (X6)
-
• Acessibility (X7)
-
• Land suitability (X8)
-
• Characteristics of disaster (X9)
-
• Change of the mass spatial use (Y1)
-
• Change of the intensity spatial use (Y2)
-
Fig. 2. Dependent variables (X) and independent variables (Y).
The next stage was collection of primary and secondary data. Primary data is collected through field observation while secondary data is obtained from various sources. The third stage was mapping of X variables as well as Y variables so that the data can be analytic in spatial. The fourth stage was overlay between the X variables and the Y variables to figure out the relationship between variables. The next stage conducted statistical tests on the results of spatial correlation to determine the level of relation of both variables. In this statistical test used the Pearson's Test and the Pearson Scatter Diagram. The next stage was discussion of the research results by referencing the theories. The last stage was drawing conclusions and giving suggestions as a result of this study.
-
A. Spatial change
Tulamben-Amed area has a diverse tourist attractions. As stated in the KSPN Tulamben-Amed master plan, the type of tourist attractions in the region are divided into the main and supporting tourist attractions. The main tourist attractions are the dive site and the natural landscape as describe in figure 3. While the supporting attractions are based on the cultural life of local people with one of them is traditional salt-making activities as describe in figure 4. According to observation there is tourist attraction with panoramic view that also interesting for the traveler. All existing tourist attractions are scattered along the coast and sea with more concentrated in the eastern segment.
This natural and special tourist attraction has increased tourist visits from year to year. From the data of two tourist attractions that have been operated is known that the average tourist visit in Tulamben Beach is 33,284 tourists each year while Jemeluk beach is 6,028 tourists every year. Ritchie and Crouch [3] stated that natural and cultural attractions can provide the highest added value to the development of a tourism area. The stated also occurred in the research area because it has led to the establishment of
more than 2,537 tourism building units. The spread of the tourism building divided into 665 units in the western segment and 1,883 units in the eastern segment in the area as seen in table 1. Almost the same as the distribution of the tourist attractions, the spread of tourism facilities also linear along the coast and more concentrated in the eastern segment. It is also known that there are five four-star hotel and one five-star hotel in the region.
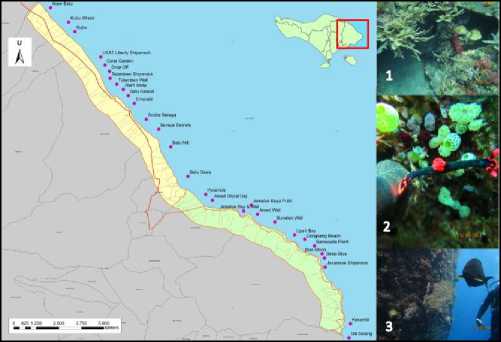
Fig. 3. The main tourist attraction of Tulamben-Amed area. Photo caption: 1) The dive site and the underwater beauty of Tulamben ocean. 2) Natural healthy coral reefs and various marine creatures, at certain times can be found reef sharks and dolphins. 3) The shipwreck of the USS Liberty that began to appear.
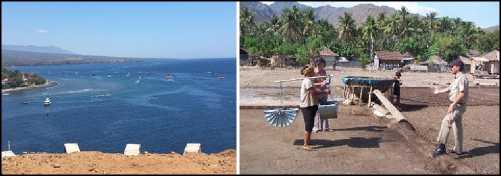
Fig. 4. Several cultural attractions in Amed include the annual festival of Jukung Dive and traditional salt-making
TABLE 1
Tourism Facilities in Tulamben-Amed
|
Amenities |
Western Segmen |
Eastern Segmen |
Total |
|
art shop |
0 |
7 |
7 |
|
hotel |
619 |
1625 |
2244 |
|
public parking |
0 |
1 |
1 |
|
tourist jetty |
0 |
1 |
1 |
|
restaurant |
27 |
144 |
171 |
|
shuttle bus |
0 |
2 |
2 |
|
shop |
2 |
8 |
10 |
|
tourist information |
1 |
2 |
3 |
|
diving |
4 |
14 |
18 |
|
yoga |
0 |
1 |
1 |
|
stall |
1 |
69 |
70 |
|
rest area |
0 |
9 |
9 |
Growing numbers of visitors has increased the need for tourism facilities, thus triggering the construction of hotels and homestays. The developing of tourism facilities also caused increase change of land function from agricultural
into tourist accommodations. Most of the agricultural land that switch functions are rice fields and salt fields. In addition, many local people who switch professions from farmers or fishermen to become tour guide, this also trigger the change of function of several local facilities into tourism facilities. For example, Amed fish landing site (TPI) that was built for fishing activities changed function to be the pier crossing tours to Gili Trawangan, Lombok.
Due to the high development of tourism facilities, there have been changes in spatial use. These changes can be observed in Table 2 where it can be seen that the area of land use for tourism services from 2001 until the year 2019 has always increased in both segments while the area of agricultural land especially the rice fields and salt fields decreased from the year 2001 to 2019.
TABLE 2
Land Use in Tulamben-Amed
|
Land use |
Western Segmen |
Eastern Segmen | ||||||
|
2001 |
2007 |
2012 |
2019 |
2001 |
2007 |
2012 |
2019 | |
|
mining |
28,12 |
1,96 |
1,96 |
50,91 |
0,00 |
0,00 |
0,00 |
0,00 |
|
tourism |
6,48 |
22,85 |
51,2 |
75,39 |
20,27 |
24,97 |
73,89 |
91,8 |
|
services settlements |
55,82 |
135,09 |
148,75 |
272,6 |
44,08 |
108,76 |
108,2 |
232,74 |
|
farms |
0,83 |
21,45 |
21,29 |
45,73 |
1,29 |
99,44 |
95,86 |
17,09 |
|
salt fields |
5,38 |
16,52 |
4,31 |
0,04 |
27,7 |
16,79 |
10,03 |
4,74 |
|
boat parking |
0,43 |
0,43 |
1,96 |
3,28 |
7,42 |
3,59 |
12,98 |
16,33 |
|
grassland |
329,96 |
955,96 |
938,29 |
839,78 |
29,45 |
705,37 |
572,65 |
375,52 |
|
river |
10,19 |
13,01 |
13,01 |
13,85 |
18,29 |
14,41 |
13,75 |
13,9 |
|
dried farms |
991,86 |
261,78 |
248,3 |
127,48 |
336,46 |
331,19 |
421,17 |
494,23 |
|
empty land |
0,00 |
0,00 |
0,00 |
0,00 |
749,52 |
0,18 |
0,07 |
49,47 |
|
rice fields |
0,00 |
0,00 |
0,00 |
0,00 |
104,34 |
48,7 |
46,54 |
41,17 |
|
shrub |
0,00 |
0,00 |
0,00 |
0,00 |
17,25 |
2,68 |
0,95 |
19,11 |
The results of the overlay between the land use maps of year 2001, year 2007, year 2012 and year 2019 showed that changes in spatial use mostly took place in coastal areas with different patterns of each segment. Land use changes in the western segment have sporadic patterns on some coastal sections as seen in Figure 5, while land use changes in the eastern segments have linear pattern along the coast as seen in Figure 6.
With the following pattern of change it is not surprising that the change in the function of agricultural land, which according to Khambali [8] is not profitable, will always occur. A salt field that lies in the location of grouping tourist accommodation that also has the highest land value from around it, encourages people to sell their land and attract investors to buy. The spread of this change also causes the coastal borders in the region to have multiple functions on one side as a protected area while on the other side become a magnet for the economic development of the region.
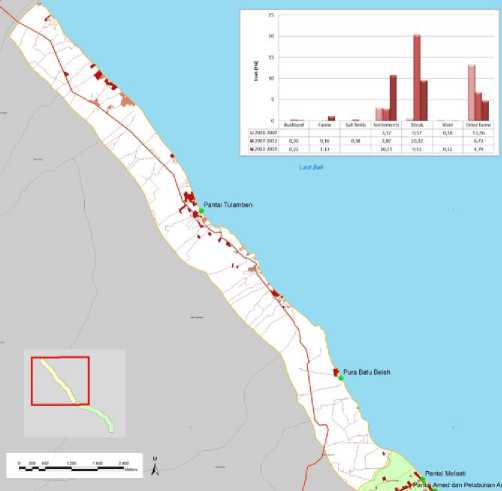
Fig. 5. Changes in spatial use in the western segment occur sporadic and clustered in several parts of the beach.
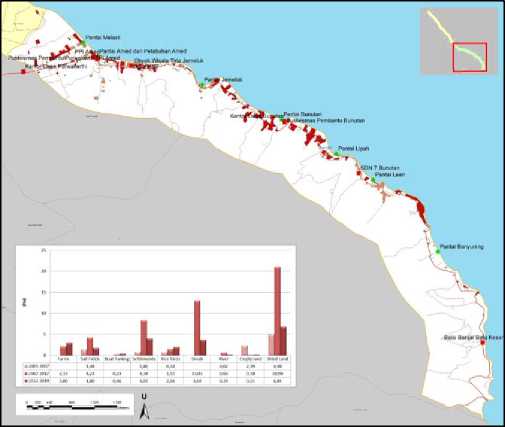
Fig. 6. Changes in spatial use in the eastern segments occur linearly along the coast or on the north and south sides of the region's main road.
The results of the overlay between the maps of land use over four periods, showed that the extensive change of the spatial use (Y1) in the western segment and in the eastern segment is approximately 4% per year, as seen in Table 3. This means that the development of this region tends to increase annually. Although in the period of 2001 to 2019 there are several global issues that have been shaken but presumably not significantly affect the growth of tourism in the region.
|
TABLE 3 Spatial Change in Tulamben-Amed | ||||||
|
No |
Land Use |
2001-2007 |
Change Period 2007-2012 |
2012-2019 |
Average Per Period |
Average Per Year |
|
A |
Western Segmen | |||||
|
settlements |
3,17 |
2,87 |
10,75 |
5,6 |
0,93 | |
|
shrub |
0,57 |
20,32 |
9,51 |
10,13 |
1,69 | |
|
river |
0,18 |
0 |
0,12 |
0,1 |
0,02 | |
|
dried farms |
13,26 |
6,73 |
4,79 |
8,26 |
1,38 | |
|
bushland |
0 |
0,3 |
0,22 |
0,17 |
0,03 | |
|
farms |
0 |
0,16 |
1,13 |
0,43 |
0,07 | |
|
salt fields |
0 |
0,38 |
0 |
0,13 |
0,02 | |
|
Total |
17,19 |
30,76 |
26,53 |
24,83 |
4,14 | |
|
B |
Eastern Segmen | |||||
|
salt fields |
1,48 |
4,23 |
1,8 |
2,5 |
0,42 | |
|
Settlements |
0,8 |
8,38 |
4,02 |
4,4 |
0,73 | |
|
rice fields |
0,74 |
1,52 |
2,04 |
1,43 |
0,24 | |
|
River |
0,02 |
0,66 |
0,24 |
0,3 |
0,05 | |
|
empty land |
2,39 |
0,18 |
0,21 |
0,93 |
0,15 | |
|
dried farms |
4,98 |
20,98 |
6,84 |
10,93 |
1,82 | |
|
Farms |
0 |
2,13 |
3 |
1,71 |
0,28 | |
|
boat parking |
0 |
0,23 |
0,46 |
0,23 |
0,04 | |
|
Shrub |
0 |
13,03 |
3,64 |
5,56 |
0,93 | |
|
Total |
10,4 |
51,35 |
22,24 |
28 |
4,67 | |
Meanwhile, by the results of overlay between the maps of buldings intensity over four periods, showed that the spread pattern of intensity spatial changes in both segments is also different from each other. In Figure 7 it appears that the change of intensity spatial use (Y2) in the western segment occurred around the main road of Amlapura-Singaraja while in Figure 8 it appears that the change of intensity spatial use (Y2) in the eastern segment occurred on the north side of Culik-Seraya-Amlapura road or along the shore. The median intensity of building density in this region amounted to 33 units per hectare as in Table 4. These conditions again show that coastal borders area play a crucial role for the economic development of the region.
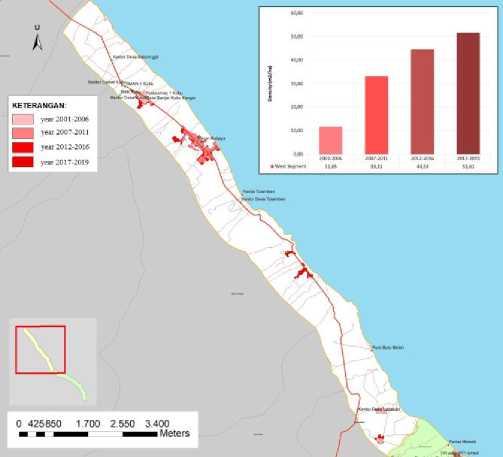
Fig. 7. Intensity change in the western segment influenced by the development of settlements around the main road of Amlapura-Singaraja with the main concentration at Camat Kubu office, Rubaya market, Batudawa hamlet and some residential units in Labasari village.
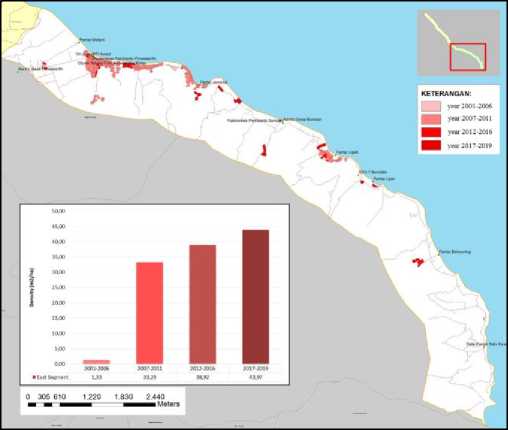
Fig. 8. Changes in the density of the eastern segment are influenced by the development of tourism facilities along the coast and are classiect around Amed Beach, Jemeluk Beach, Lipah Beach, Lean Beach and Banyuning Beach
TABLE 4
Intensity of Buildings in Tulamben-Amed
|
Segment |
Buildings |
Build Area |
Density |
|
West Segment |
12.752 |
347,99 |
37 |
|
East Segment |
9.319 |
324,54 |
29 |
-
B. Factors caused changing of spatial use
Adisasmita (2014) cited Alfred Weber's statement stating that an industry would consider the optimum location near the source of raw materials. In tourism, tourist accommodation is seen as an industry that also strongly considers the optimum location of a tourist attraction. Tourist attractions in this region based on KSPN Tulamben-Amed document are the ocean (dive site), ocean landscape, coastal landscape, cultural tourism and socio-economic tourism attractions. With these types of attractions, the optimal location for building accommodation is also around the attractions. Through the analysis of GIS spatial correlation using the gradation radius of 100 meters, 200 meters, 500 meters and 1000 meters showed some of the following phenomena:
-
1. Around the main tourist attractions will occur change in spatial use as far as 500 meters and the intensity changes as far as 200 meters from it. Yunus [9] stated that this could occur due to the attractiveness of the facility's completeness around the main attractions as the center of tourism activity.
-
2. Density of the main tourist attraction in the east segment causes more height changes in the spatial use because there is also happen spatial agglomeration of tourism facilities. This is not separated from the economical advantages due to the economic agglomeration, one of which is the price comparison of relevant
accommodation for tourists, especially the majority of tourists who visit this area are backpackers [11].
-
3. Near the supporting tourist attraction occur extensive changes up to 1000 meters and intensity changes ranging from 100 meters to 500 meters from it. This condition is in accordance with the opinion of Yunus [9] that changes in spatial use will occur in the area with more completed public facilities from other areas.
-
4. Around the attractions of panoramic view will occur mass change of spatial use within 100 meters from the attraction while the change of intensity occurs at a distance of 200 meters from it. These results correspond to the Kaiser et. al [7] opinion that the aesthetic value of the land plays a major role in the change of spatial use for tourism and the opinions of Ritchie and Crouch [3] that natural tourist attraction dominates the competition in the selection of land for tourism.
-
5. The attraction of traditional salt farm activities has no effect on changes in spatial use instead, changes in spatial use can eliminate the existence of this attraction. Although according to Ritchie and Crouch [3] cultural attractions also have a high competitive value but apparently Amed's traditional salting making does not have a high competitiveness so that changes in spatial use will always capture the farm fields. This is because the change in spatial use will choose more profitable land use [8].
The results of this analysis were supported by Pearson's test results with a correlation coefficient between the X1 and Y1 was at 0.96 and the plot spread in the Pearson Scatter diagram showed a close level of relationship. While the correlation coefficient between the X1 and Y2 is at a rate of 0.81 and in the Pearson Scatter diagram showed a close level of relationship too.
Number of tourists according to Widiatmaka and Hardjowigeno [12] can cause changes in spatial use. This opinion does not explain whether the relationship related to the rise or fall of the number. Through the spatial correlation between numbers of tourist visits with the changing of the spatial use it appears that the increase in the number of visits in a tourist attraction is not worth with the change in the surrounding space. It can be observed on the higher changes occurring in Jemeluk than Tulamben despite the lower number of visits to Jemeluk than Tulamben. This phenomenon shows that the number of visit factors more related to length of stay, especially in the attraction of special interest as in this region, than number of visitors. Sudana et. al. [11] through the results of their study explained that the interest of tourists visiting Tulamben-Amed lately not only for physical activities but also for fun, gathering with friends and so forth. This seems to also influence the choice of travelers to prefer accommodations around Jemeluk beach rather than Tulamben Beach. These results were supported by Pearson's statistical test that the correlation coefficient between X2 and Y1 was 0.70 with a close-level relationship when viewed from the plot spread of the Scatter Pearson diagram but the correlation between
X2 and Y2 was not present because the number of the correlates coefficient was 1.00.
The location of tourism facilities that woke up previously became a reference to the development of tourism facilities thereafter. This is in line with the economic agglomeration theory and optimal location theory. Brueckner [2] explained that economic agglomeration provides various economic advantages for buyers (tourists) or sellers (tourism actors) especially in terms of transportation so that there will be spatial agglomeration. Weber [13] also emphasized that there are several locations that are optimally chosen for the development of the accommodation industry. The development of tourism facilities in the Tulamben-Amed area also tends to agglomerate around the main tourist attraction so that changes in spatial use also occur in gradual around the attraction. The statistical correlation test results also support the results of the GIS analysis in which the correlation between X3 and Y1 has a significant level of 0.31 with a close relationship of the same level, and at the correlation between X3 and Y2 has a significantly equivalent of 0.44 with the relationship properties also closely based on the Scatter chart.
Butler [2] stated that the development of tourism area was influenced by the quality of tourism facilities. It is further said that the quality of a tourism facility develops in line with the life cycle of the region. The results showed that there was no significant change of spatial use around the star-quality accommodations. This results in accordance with the theory of life cycle because in the stage of involvement, the number of star-quality accommodation is still relatively slight. Pearson's test results also showed a correlation of the relationship between X4 and Y1 of 0.65 but the plot spread of the Scatter Pearson diagram stated that the relationship was not very close. While the correlation of X4 with Y2 relations cannot be analyzed because of the very few quality accommodation in the region.
Clawson and Steward [10] suggested that land prices were one of the components related to the development of the region. Land prices according to Khambali [8] related to the increase in the value and price of land. These two factors further by Stone [8] are the consequences of increasing land needs and space extensibility and will lead to the change function of agricultural land. Suartika and Widiarsa [1] also asserted that the limited land availability is one of the causes of land function change. Yunus [9] also suggested that the price of land is one that causes the centrifugal movements change in spatial use. Through the results of spatial correlation it is evident that the widespread change in the highest spatial use occurs in high-priced zones as well. Consequently there is a change in the function of agricultural land (salt fields, paddy field technical irrigation even local service facilities of fish landing centers and fish landing sites) become tourism facilities around the zone with the highest land value. It is supported by Pearson's
statistics test that the X5 correlation number with the Y1 reaches 0.81 with a spread of Scatter the plot indicates a close relationship and at the correlation of X5 with Y2 has a significant status of 0.63 with a plot spread in the Pearson Scatter diagram indicating the level of close relationship. Meanwhile, the results showed a different tendency with the land lease theory of Von Thunen because the gradation of land prices between zones did not change as the distance changes from the center of the area but more linear ones following the distance from the beach or the main road.
Land tenure also become one of the factors that causing development of an area as submit by Clawson and Steward in Vom Hofe and Wang [10] and spatially, this factor may observed from land ownership. In this study the correlation was implemented using extensive data ownership of the land that appeared most often (mode) in each segment. As for the data on land tenure from the Land Office of Karangasem Regency then the broad mode of land tenure in the west segment is 24,740 m² and in the east segment 200 m². These results show that changes in spatial use are more common on large areas of ownership in the western segment and on land with relatively small holdings in the eastern segment. However from the Pearson test can we figures out that the correlation coefficient of X6 and Y1 amounted to 0.12 and the correlation coefficient of X6 with Y2 by -0.001 and the plot spread of the Scatter Pearson diagram shows that variable relationship of X6 to Y1 and X6 with Y2 has an inclose relationship.
The association of land or accessibility is one of the contributing factors to the change in spatial use, which is expressed by Clawson and [10]. This is in line with the opinion of Yunus [9] which includes accessibility as a contributing factor to the lateral movement between the subzones within an area. The results showed that changes in spatial use occurred as the difference in accessibility conditions. This is seen from the higher changes in the use of space around the district road (Culik-Seraya) rather than around the provincial road (Amlapura-Singaraja). This condition in accordance with the accessibility conditions in the western segment is more crowded because of interdistrict vehicles, tourist transportation, mining transportation and the existence of parking in several public facilities such as markets, office facilities and education. While the eastern segment is only traversed by tourism transport vehicles and local residents’ vehicles so that the traffic here impressed more comfortable. The results of the analysis were supported by the Pearson test between X7 and Y1 of 0.90 with a plot spread of the Scatter Pearson diagram including a close relationship and a correlation of X1 with Y2 by 0.94 with a plot spread of the Scatter Pearson diagram as well as closely.
Kaiser et. al [7] and Yunus [9] stated that the change in the intensity of the spatial use in the flat land would be much higher than that of the other parts of the same subzone. Yunus [9] also placed the physical condition factor of
the land as a centrifugal force that could attract or encourage changes in spatial use. Further Branch [8] explains that geographic conditions will affect the function and shape of the area while the topographical conditions cause constraints for the development of the region. Differences in the physical conditions of the relatively flat western segment and the relatively hilly east segment shows that changes in spatial use appear more happening on land suitable for physical development. Especially in the eastern segment, almost all changes in spatial use occur on a flat or suitable land for buildings although there are also some facilities was built on the steep area. The Pearson statistical test results showed that the correlation between X8 and Y1 was present at 0.96 with a plot spread in a Pearson scatter chart showing close connections and a correlation between X8 and Y2 by 0.87 and including a closely-visible relationship of a Pearson scatter chart.
The physical condition of a land is one of the factors that can cause lateral movement between subzones in a region that causes changes in spatial use [9]. Physical characteristics of a land include the condition of the area where the land is located, whether flood areas, lability areas and others. This is significant with the condition of this region that is vulnerable to disaster especially in the western segment which includes the disaster of volcanic Gunung Agung, disaster of tsunami and disaster of land shifts while in the eastern segment only disaster of flooding over some areas. According to Yunus [9] a disaster-safe area has more appeal to changes in spatial use. The results of this research show the results that are contrary to the opinion of Yunus [9] because the change of spatial use in the western segment that is very vulnerable to the disaster remains high unless the change in the intensity of spatial use that tends to occur on the safe land of disaster. It is supported by Pearson's statistical test of the relationship between X9 and Y1 with a correlation coefficient of 0.92 with a plot spread in a tightly-tight scatter diagram and a correlation between the X9 with Y2 gaining a coefficient of 0.98 and including a close relationship seen from the plot of a Scatter-Pearson diagram.
Through the above discussion can be conclude that from nine factors that tested only six dominant factors that influence the change of spatial use in Tulamben-Amed area. Factors that causing spatial change are characteristics of tourist attractions, spatial agglomeration of tourism facilities, higher land prices on land used for tourism facilities than those not used for it, accessibility comfort levels for tourist, limitation of land physical feasibility, and different natural disaster characteristics between segments. While the number of tourist visit factors, accommodation quality, and land tenure does not affect the change in the region's spatial use due to shifting interest of tourist visitor, the stage of tourism area that on the involvement cycle and the low-density settlements.
The tourism development in Tulamben-Amed area is not separated from the main tourist attraction in the form of beautiful beaches and sea. This natural and distinctive attraction increases the number of tourist visits each year so that local community also begin to involved in the provision of tourism facilities. Consequently, increasing the development of hotels and homestays, increasing change of agricultural land function into tourist accommodations and also change the functions of several local facilities in the centers area to become tourism facilities. The change in spatial use occurs by 4% per year with an average density of 33 buildings per hectare. This spatial change largely happening on the coast so that the coastal borders area have a dual function, on one side for protection on the other side as a puller for economic growth. Factors that causing spatial change are characteristics of tourist attractions, spatial agglomeration of tourism facilities, higher land prices on land used for tourism facilities than those not used for it, accessibility comfort levels for tourist, limitation of land physical feasibility, and different natural disaster characteristics between segments.
Based on the results of this research, the suggestions that can be submitted for spatial planning in the Tulamben-Amed area are:
-
1. Comprehensively calculates the value of coastal area borders either sustainability value or economic value to determine the best function for this area in regional spatial plan.
-
2. Controlling and directing the change of agricultural land function to preserve the culture of local community.
-
3. Maintain a low level density by arranging fishermen settlements as an alternative tourist attraction so as to extend length of stay.
-
4. Preserve the attraction of tourism by drafting detailed and inter-integrated tourist attraction spatial plans.
-
5. Researching alternative development areas mainly to the south to detract spatial agglomeration of tourism facilities on the eastern segment so as to reduce environmental burden on the coastal areas.
References
-
[1] Suartika, G.A.M., and I Putu A. Widiastra, (2018). Control over land function in Mangupura urban areas Badung Regency. SPACE: Journal Building Environment (SPACE: Journal of the Built Environment), 5 (2), 167-180.
-
[2] Brueckner, Jan K. (2011). Lectures On Urban Economics. Cambridge: The MIT Press.
-
[3] Ritchie, J.R.Brent, dan Crouch,Geoffrey L. (2010). A Model of destination competitiveness / sustainability: Brazilian perspective. Available: https://www.researchgate.net.
-
[4] Pontoh, Nia K., and Iwan Kustiwan. (2009). Introduction to urban planning. Bandung: Bandung Institute of Technology.
-
[5] Zulkaidi, Denny. (1999). Understanding the change in city land utilization as a basis for its handling policy. Regional and city Planning Journal, 108 (l0),108-124
-
[6] Santosa, Mas and B. Heru Santoso. (2013). Thermal performance of buildings in high-density environments with variable roof, wall, ventilation and ceiling (case studies in high density Surabaya, Malang and SUMENEP). Gema Teknik Journal 1 (10), 113-121.
-
[7] Kaiser, Edward J., Godschalk, David R., and Chaplin, F. Stuart. (1995). Urban Land Use Planning (4th ed). Illinois : University of Illinois Press.
-
[8] Khambali, I. (2017). City forest vegetation planning model. Yogyakarta: Andi.
-
[9] Yunus, Hadi Sabari. (2008). The dynamics of the Peri-Urban region, the future determinant of the city. Yogyakarta: Pustaka Pelajar.
-
[10] Vom Hofe, Rainer and Xinhao Wang. (2007). Research Methods In Urban and Regional Planning. Beijing: Tsinghua University Press.
-
[11] Sudana, I Putu, Helmi Cahyana and I Ketut Suwena. Characteristics and motivation of foreign tourists visit Jemeluk-Amed Beach, Purwakerthi Village, District Abang, Karangasem. Journal of Travel Industry, 6 (1), 32-41.
-
[12] Widiatmaka, and Sarwono Hardjowigeno,. (2018). Evaluation of land appropriateness and land use planning (fifth mold). Yogyakarta: Gadjah Mada University Press.
Discussion and feedback